
Abstract
Vibration based energy harvesting with piezoelectric material is considered as an alternative power source to run the low power devices, specially for remote area where power is unavailable and also increasing high power demand in the world. This paper presents prototype implementation of non-controlled rectifier circuit utilizing piezo-bending generator (PBG) to estimate output power. This study also investigates the output power of PBG by choosing different capacitances, resistive loads and diodes. In this study, a non-controlled full-wave rectifier is designed and implemented for energy harvesting circuit (EHC). The energy harvesting rectifier circuit is simulated using Matlab software and implemented into prototype board to verify the results. Finally, the study concludes that the output power of the rectifier circuit is high with low resistive loads and Schottky diodes, and the output voltage becomes smooth with suitable value of capacitance.
Introduction
The energy harvesting from the ambient energy sources, such as vibration, sound, heat, solar, wind, solid waste etc, is gaining popularity day by day due to the increasing power demand [1, 2, 3, 4, 5, 6]. Along with the renewable energy generations, the micro level energy harvesting becomes focused to the researchers and developers to power the ultra-low power devices at remote or faraway area because the diffusion of micro level natural energies and generated deformed waste energies i.e. thermal or vibration can have a decent support to power bank [7, 8, 9, 10, 11]. To harvest the micro scale energy from the vibration of piezoelectric material is now larger attention to be researched. Since the piezoelectric crystal based vibration transducer generates low AC voltage output with fluctuations and harmonics, it is difficult to process this low level signal of various magnitudes. However, the most contemporary applications of piezoelectricity use piezoelectric ceramics instead of naturally occurring piezoelectric crystals [12, 13, 14]. The piezoelectric ceramic materials afford a number of advantages; they are hard, dense and can be manufactured to almost any shape and size. Piezoelectric ceramic based transducers have become increasingly popular in vibration control applications. They are used as sensors and actuators in structural vibration control systems. They provide excellent actuation and sensing capabilities. The piezoelectric ceramic materials, such as lead zirconate titanate (PZT), can be processed to exhibit significant piezoelectric properties. PZT ceramics are relatively easy to produce, and exhibits strong coupling between mechanical and electrical domains [15, 16, 17].
Many vibration-based energy harvesting systems use a piezoelectric transducer as an AC source. The transducer generates voltage which must be rectified before supplying to the load. In general, the voltage is rectified using a full-wave diode bridge rectifier. However, thee diode bridge rectifier is not fully efficient to convert low voltage AC to DC in micro energy harvesting because the forward voltage of diode potential might be higher than the harvested signal [18, 19, 20]. Therefore, proper diode selection is important for rectifier circuit to harvest the energy from piezoelectric harvester. The proper designing and configuring the filter circuit are also significant for obtaining the optimal output. In recent years, to improve the energy harvesting, many studies utilize various technologies with slight modifications in harvesting tools, processing and interfacing techniques [21, 22].
In this study, an EHC with efficient full-wave bridge rectifier is designed, simulated and analysed, and also verified the simulated results through hardware implementation. The rest of the paper is organized as follows: Section 2 presents overview of the piezoelectric energy harvester. Section 3 presents methodology. Section 4 represents PBG setup for analysis. Section 5 presents simulation analysis. Section 6 represents hardware Implementation. Section 7 represents results and discussion. Finally conclusion is given in Section 8.
Overview of the piezoelectric energy harvester
This section describes the overview of piezoelectric based energy harvesting system considering the PBG, AC-DC rectifier, filter and temporary storage device. The below block diagram is presented (step-by-step) to illustrate the piezoelectric based energy harvesting system, as shown in Fig. 1.
Block diagram of energy harvester system.
Overview of the energy harvesting schematic diagram.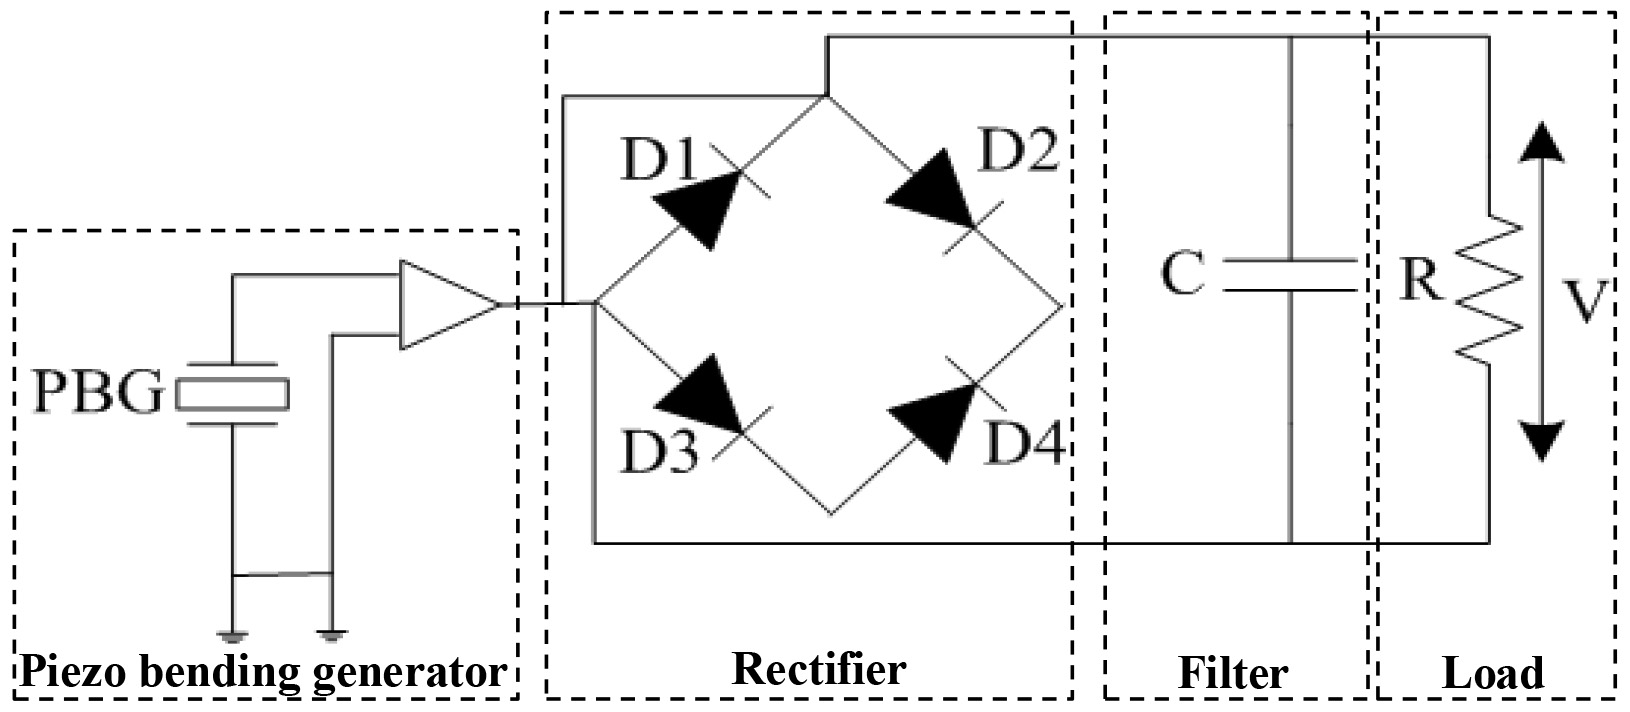
With the recent flow of micro scale devices, PBG can provide a convenient alternative power sources used to operate certain types of sensors/actuators. Piezoelectric materials can be used as a means of transforming ambient vibrations into electrical power that can be rectified, filter and stored used to run for low power devices as shown in Fig. 2. In this figure, the amplifier is used to measure any static force with the circuit of PBG. A rectifier circuit is developed because PBG generate AC electrical energy which must first be rectified before it is used by a load. The output of rectifier DC voltage contains ripples. Usually, these ripples are highest for a single-phase half wave rectifier and reduce for a single-phase full wave rectifier. For most of applications, direct voltage from a rectifier to load may lead poor operation of the circuit. If the rectifier output is smooth and steady, then the overall operation of the circuit becomes better because the filter circuit reduces the ripples and produces constant DC voltage. To design the EHC, capacitor plays an important role which is needed to consider for storing energy. The storage devices are such as capacitor, rechargeable batteries and super-capacitors.
This study has been performed using the following design-flow as shown in Fig. 4. To do this work, the commercially energy harvesting kits PBG model EH220-A4-503YB vibration sensor has been used as an input in simulation and hardware implementation. The PBG is mounted on the vibration shaker to convert mechanical energy to electrical energy as AC output. The experimental results of the PBG are measuring by using oscilloscope. The EHC is simulated using Matlab software and the designed (i.e. smart electronic EHC) is implemented in hardware to verify and validate the results.
PBG setup for analysis
The PBG sensors are based on the principle of the electromechanical energy conversion. The mechanical input and electrical output is the basis of these transducers i.e. these transducers exhibit piezoelectric effect. When certain solid materials are deformed, they generate within them an electric charge. This effect is reversible and thus if a charge is applied, the material will mechanically deform in response. These are known as piezoelectric effect.
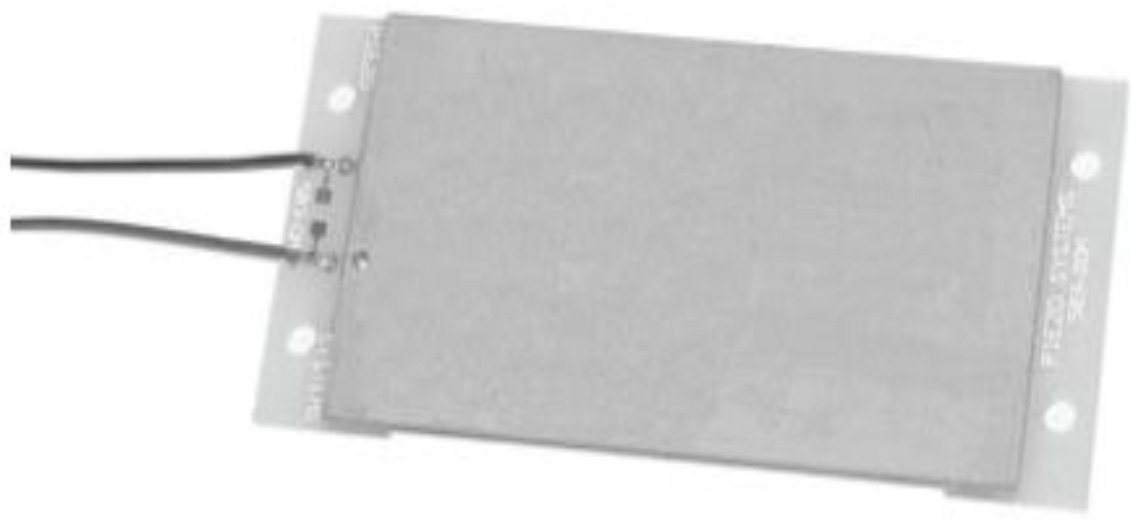
Single PBG has been tested with the energy harvesting power conversion circuits. The prototype of a PBG (EH220-A4-503YB) is shown in Fig. 4. The parameter specifications of PBG are summaries in Table 1. The energy harvesting bender one side is flexed and another side is free to move. When a piezoelectric transducer is stressed mechanically by a force vibration, its electrodes receive a charge that tends to counteract the imposed strain. This charge will be collected, stored and delivered to power electrical circuits.
Flowchart of this work. Prototype of the PBG.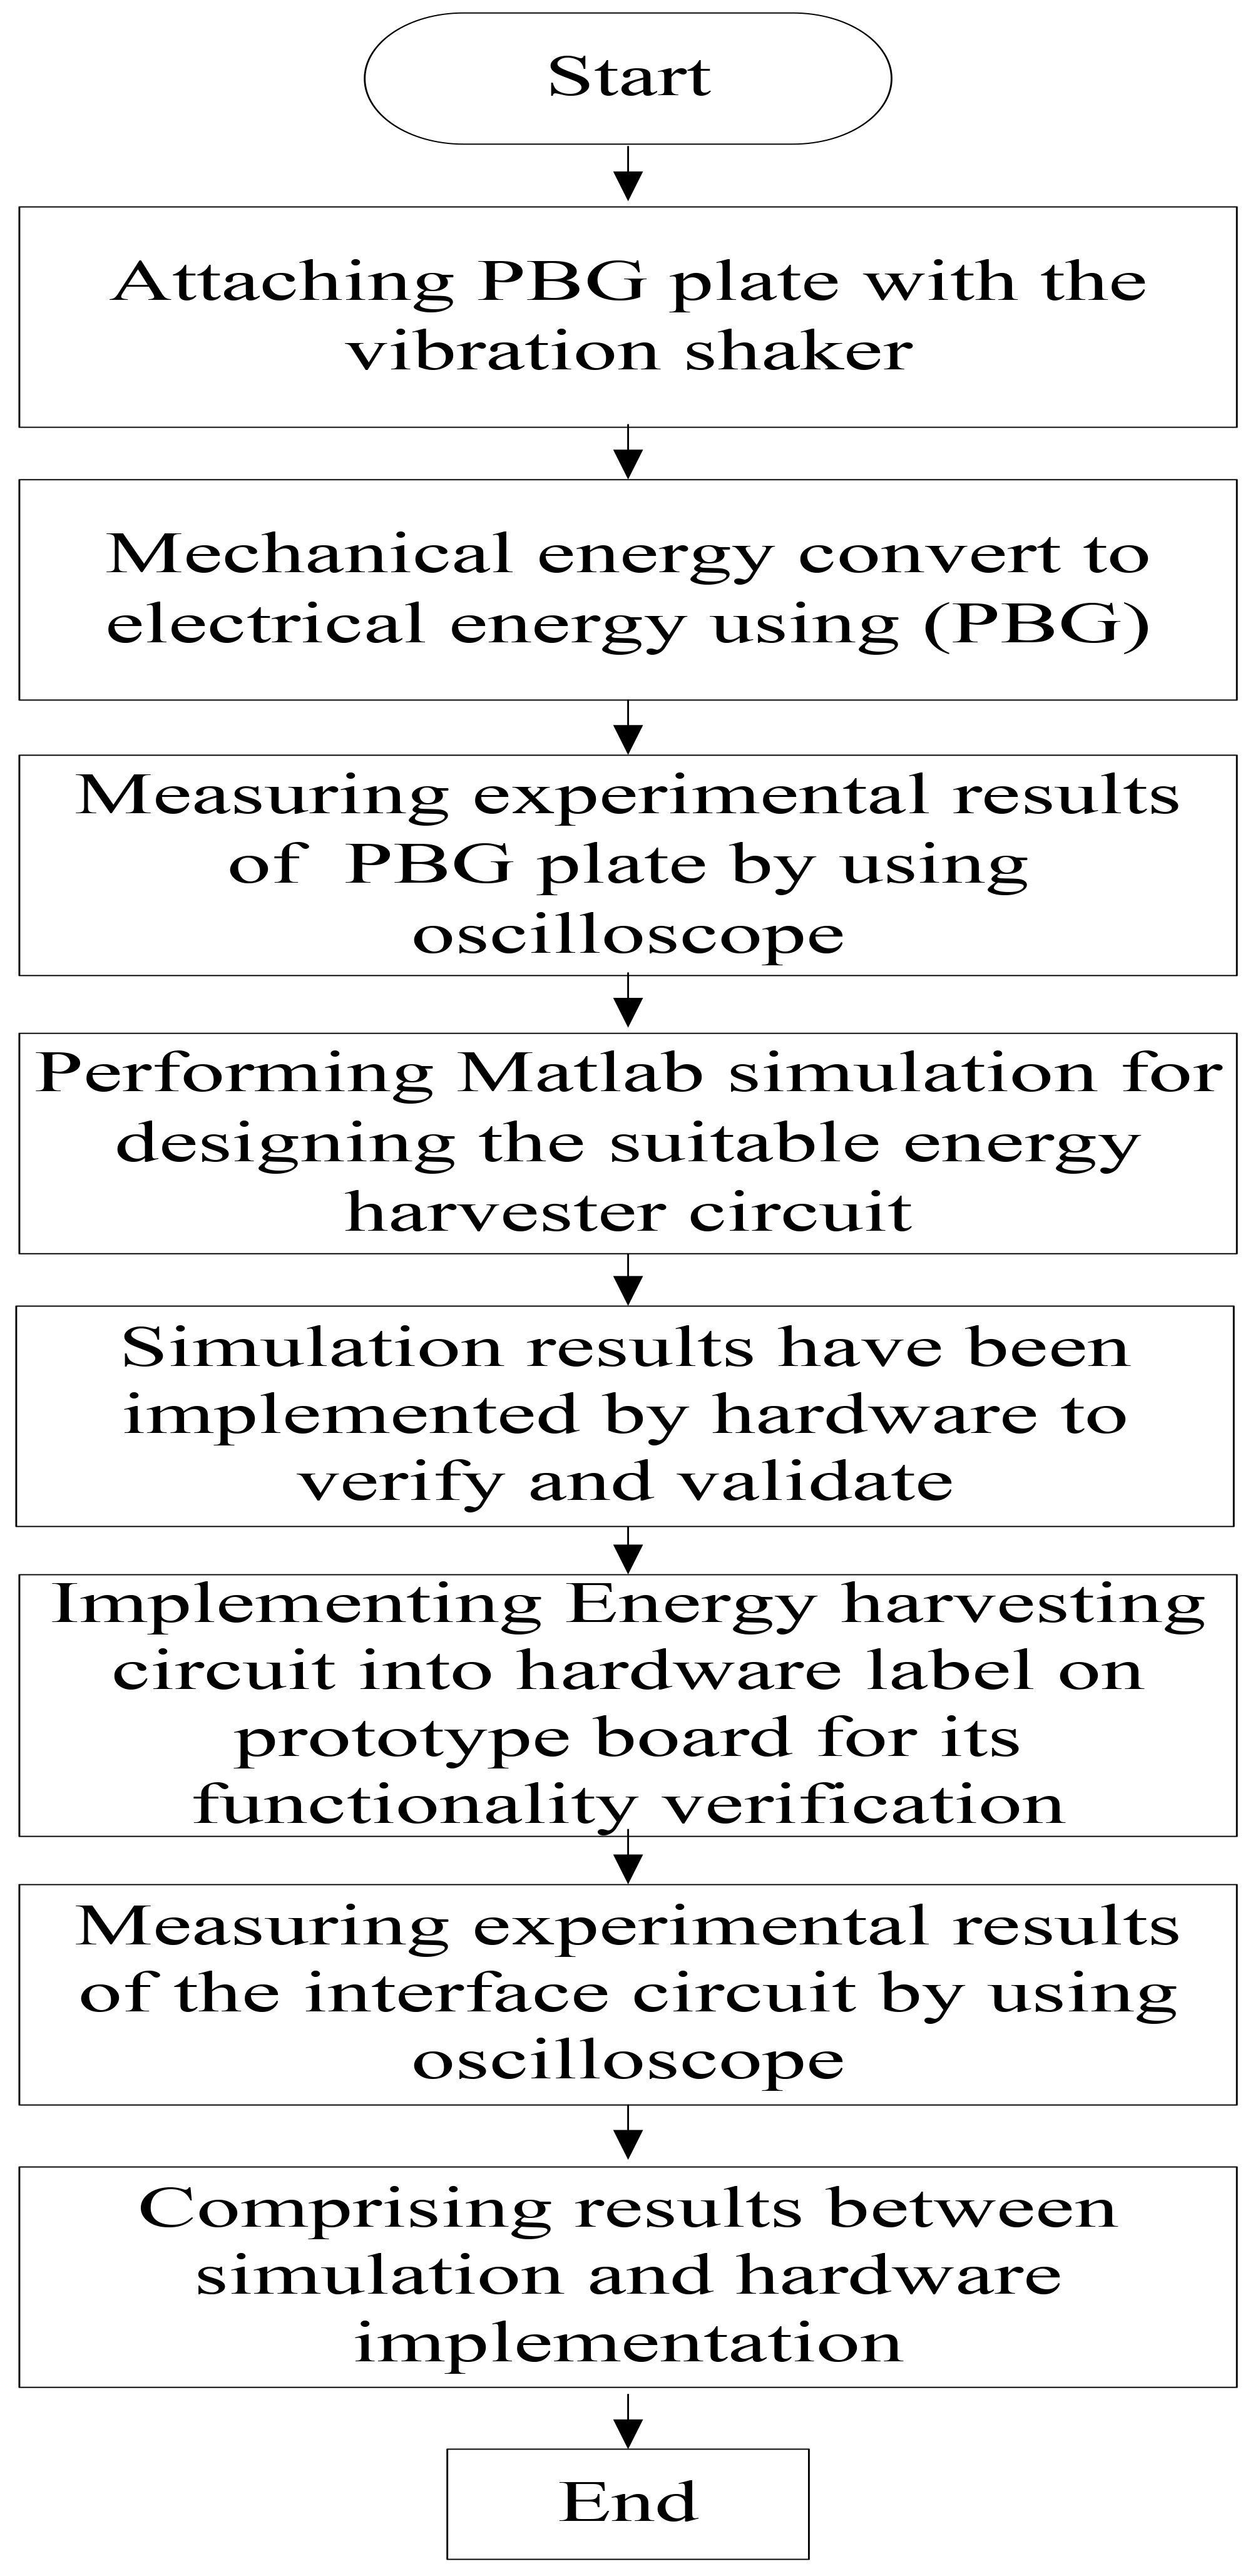
Piezoelectric bending generator parameters
The energy harvesting bender is a pre-mounted and prewired double quick-mount bending generator. The use of a frequency generator with power amplifier is preferred to control the mechanical energy generation by varying frequency. The output of PBG is shown in oscilloscope. Detail layout for the experimental test setup is shown in Fig. 5. To do the PBG analysis, the natural frequency has been changed manually between 10 Hz to 68 Hz through the amplifier unit and investigates the resonance frequency of the PBG details as shown in results and discussion part.
Experimental setup of the energy harvester PBG.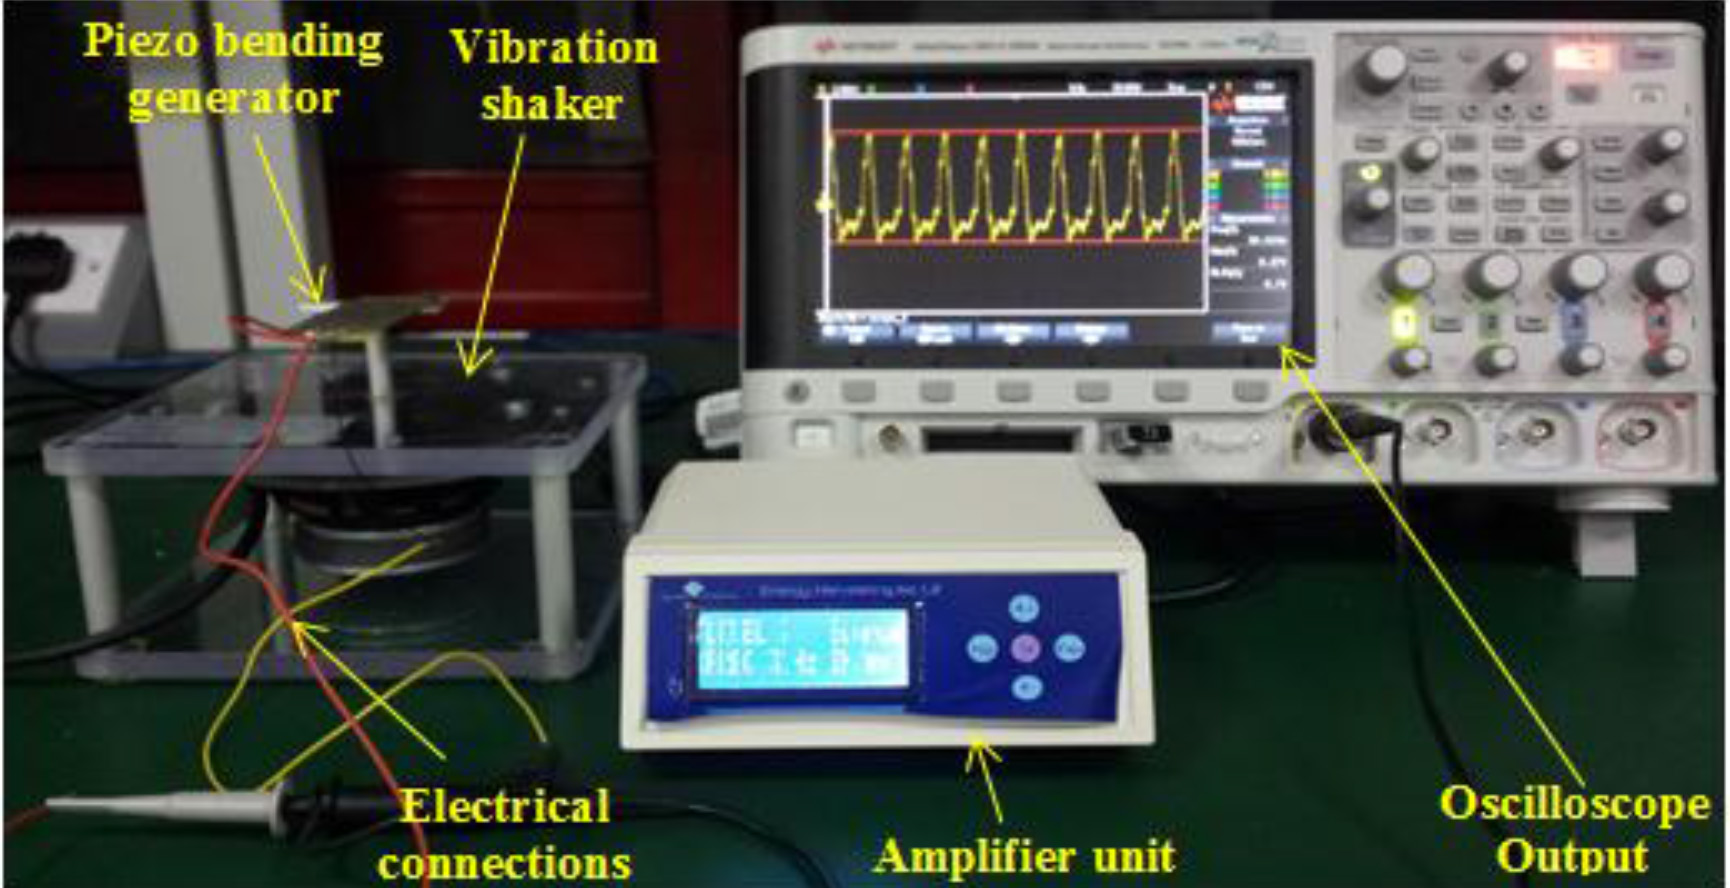
Simulation tools are representation of the functioning of a system or process. Through simulation, a model may be spread with infinite differences, creating complex situations. These capabilities allow analysis and understanding of how individual elements interact and affect the simulated environment. So simulation is one of the important techniques for any circuit analysis.
PBG circuit analysis
In this section, electrical equivalent circuit of piezoelectric crystal has simulated and analysed using Matlab Simulink software. Usually, a mechanical force is represents as an electrical voltage. The mechanical and electrical equivalent circuit of a piezoelectric system is shown in Fig. 6a and b.
(a) Spring-mass-damping model of piezoelectric crystal, (b) Equivalent circuit of electrical model.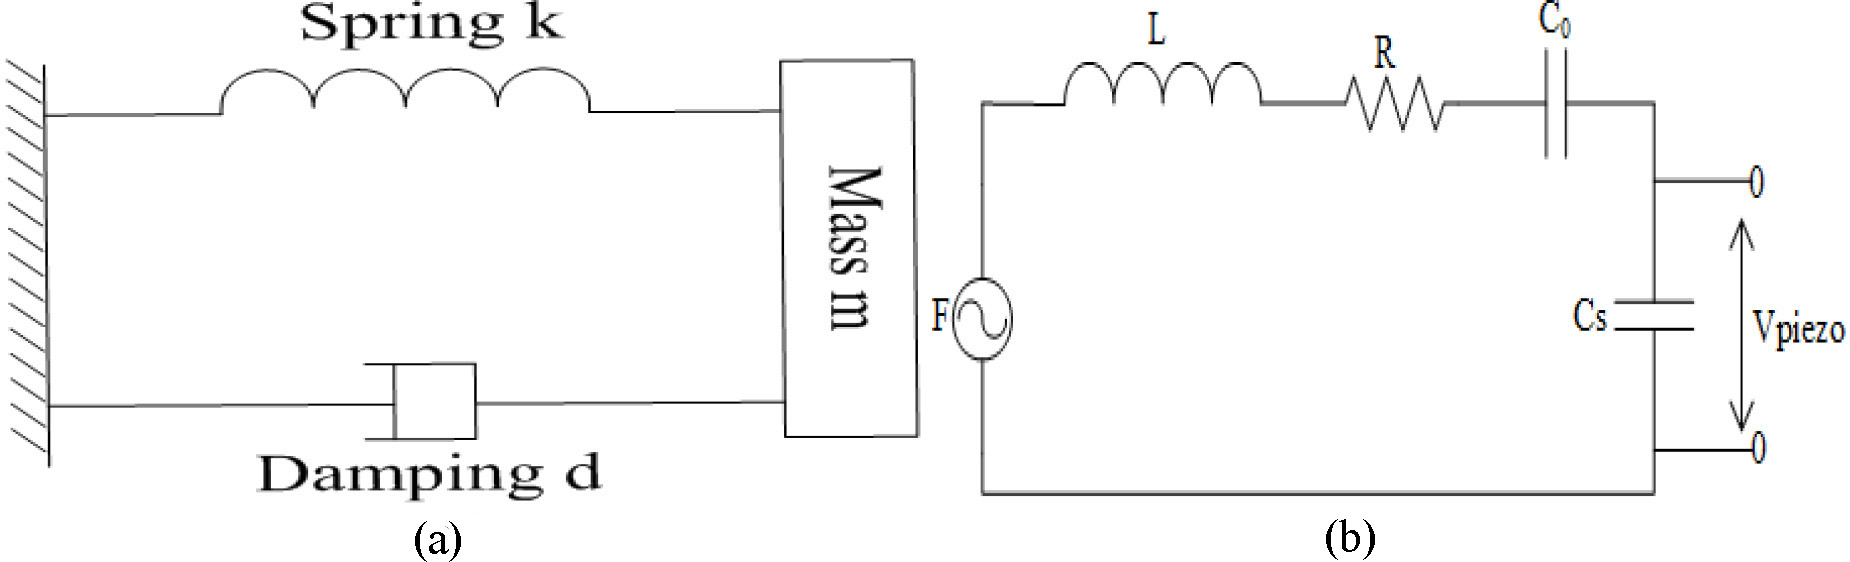
The mass
The operation of full-wave bridge rectifier is take four note connected with the bridge form
Operating modes of the proposed rectifier.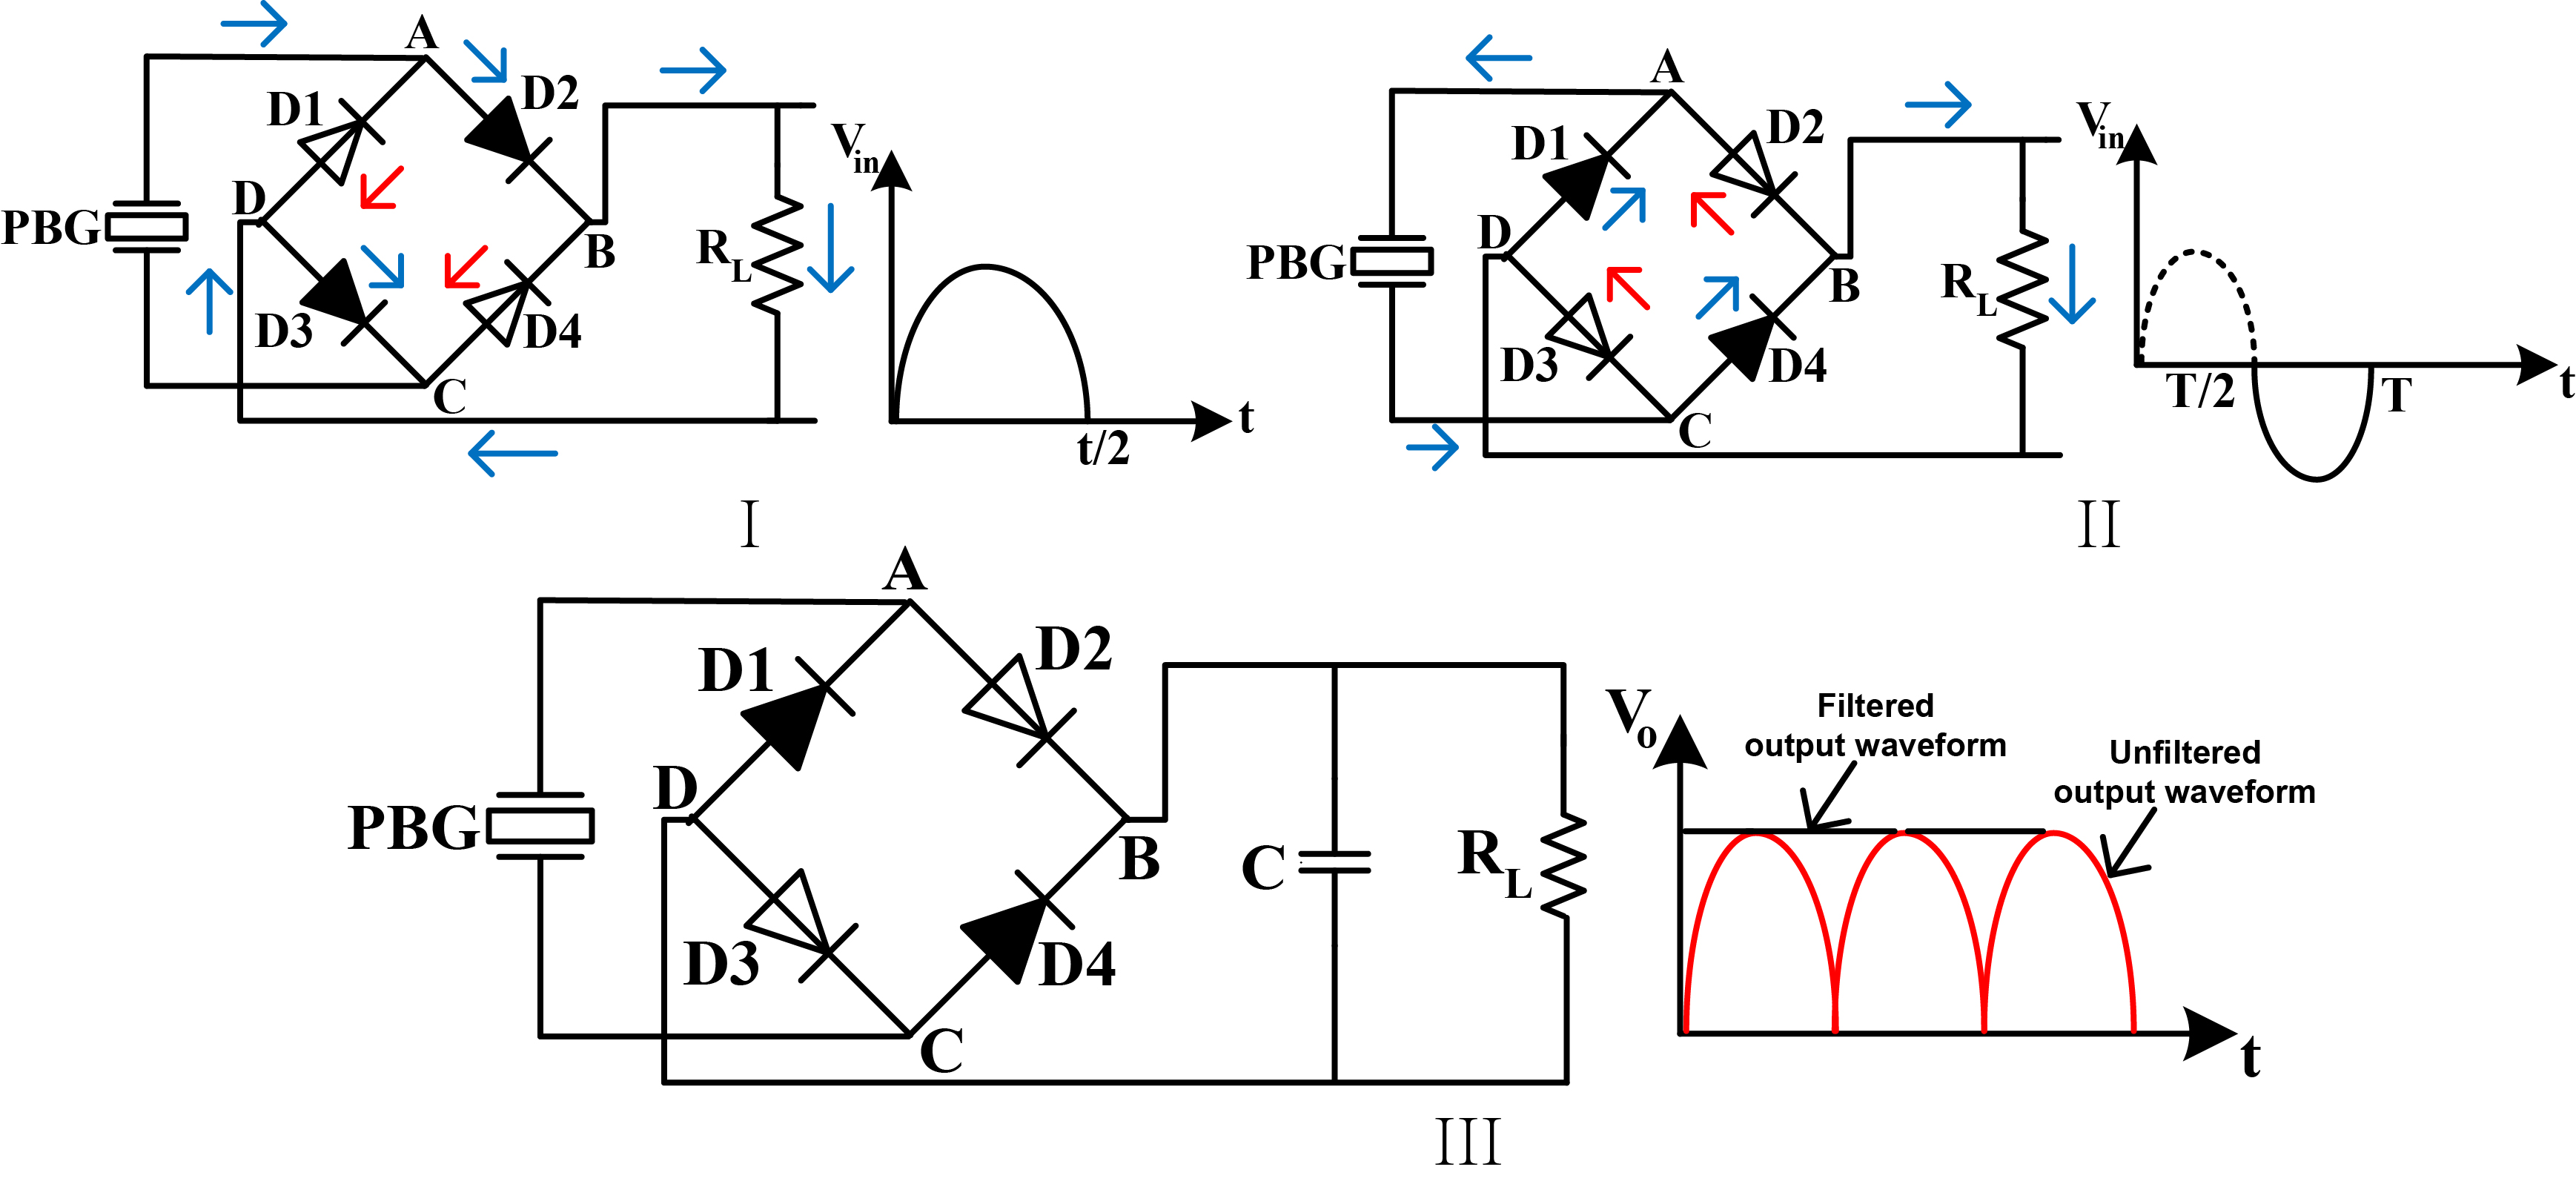
Similarly, the negative half cycle is applied to the circuit that is during the period
Filters are commonly employed in rectifier circuits for smoothing the DC output voltage of the load. The capacitor
Hence Eq. (7) can be re-written as
The PBG is produce sinusoidal signal. So in this study root-mean-square (rms) has been calculated of load power
First part from Eq. (14) integrated
Second part from Eq. (14) integrated
Third part from Eq. (14) integrated
The value from Eqs (20), (24), (28) put in the Eq. (14).
Here,
In real applications, the storage voltage is almost fixed, which may not satisfy the impedance matching condition. Therefore, an additional diode-bridge rectifier circuit and the storage capacitor are required to satisfy the impedance match condition and maximize the harvested energy. Finally, the instant power consumed by the load is directly proportional to the square of the voltage and inversely proportional to resistance it calculated by
Hardware architecture is the representation of an electronic system, process and control for implementing the design for such a prototype system. The hardware implementation is one of the important roles to test/verify the circuit functionality in proper operation. Prototype board, piezo systems energy harvesting bender (EH220-A4-503YB), model (DSO-X-2024A) oscilloscope, shaker, amplifier unit, schottky diode (1N5817), capacitor, and resistor were utilized to implement the EHC as shown in Table 2.
Equipment list for experimental setup
Equipment list for experimental setup
The experimental setup is the full-wave bridge rectifier hardware implementation circuit as described in this section. The PBG is attaching with the vibration shaker and measuring the output voltage of the PBG in oscilloscope. The frequency and amplitude is changing and selected through the amplifier unit. The full wave bridge rectifier take four diode connected with the bridge form
Implementation of rectifier circuit.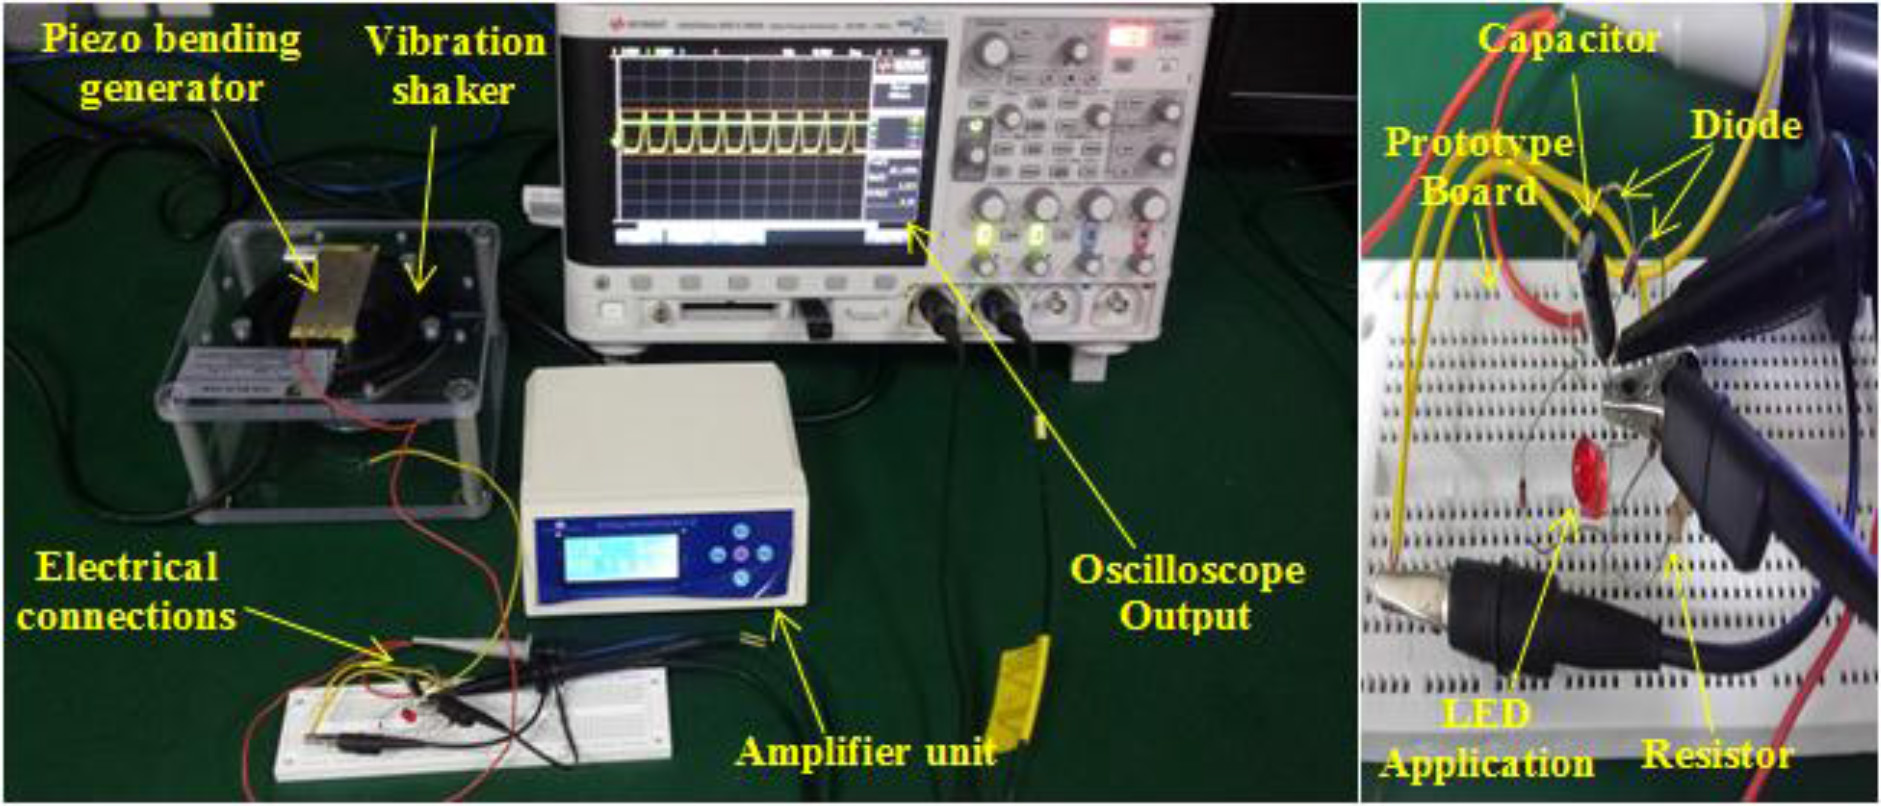
This section describes the behaviours of PBG and outcome of the improvement EHC results which was simulated through the Matlab software and hardware implementation to verify the developed EHC functionality. The low voltage EHC simulation results are compared with the hardware implementation results to verify the performance of the developed circuit. The following steps have been taken to implement the hardware for the EHC. For this purpose, the input voltage peak to peak Vpp (i.e., 7.7 V, 5.6 V, 6.5 V) has been selected and it generates by the PBG according to the frequency (30 Hz, 40 Hz, 60 Hz) for full-bridge rectifier circuit without load. In this study, the verification of the simulated results in Matlab software through hardware implementation for low power LED application.
Behaviours of the PBG
The analytical output of the PBG is shown in Table 4. The frequency spectrum graph is shown in Fig. 9. Figure 9 denotes the voltage amplitude of the PBG behaviours according to the frequency without load. The response of PBG has been analysed maximum peak upper than 70.7% and selected resonance frequency (i.e., 30 Hz, 40 Hz, 60 Hz) that generated maximum Vpp voltage. The resonance frequency has been selected 30 Hz from the PBG that generated maximum amplitude to develop simulation and experimental model for EHC.
| Frequency (Hz) | Vpp | Frequency (Hz) | Vpp |
|---|---|---|---|
| 12 | 1.7 | 40 | 5.6 |
| 16 | 3 | 44 | 4.2 |
| 20 | 4.3 | 48 | 3.9 |
| 22 | 5 | 52 | 5 |
| 24 | 5.7 | 56 | 5.3 |
| 28 | 7 | 60 | 6.5 |
| 30 | 7.7 | 62 | 4 |
| 32 | 1.7 | 64 | 2.5 |
| 34 | 2.5 | 66 | 2.75 |
| 38 | 3 | 68 | 1.2 |
Power assessment with different capacitor and load
Frequency spectrum of PBG.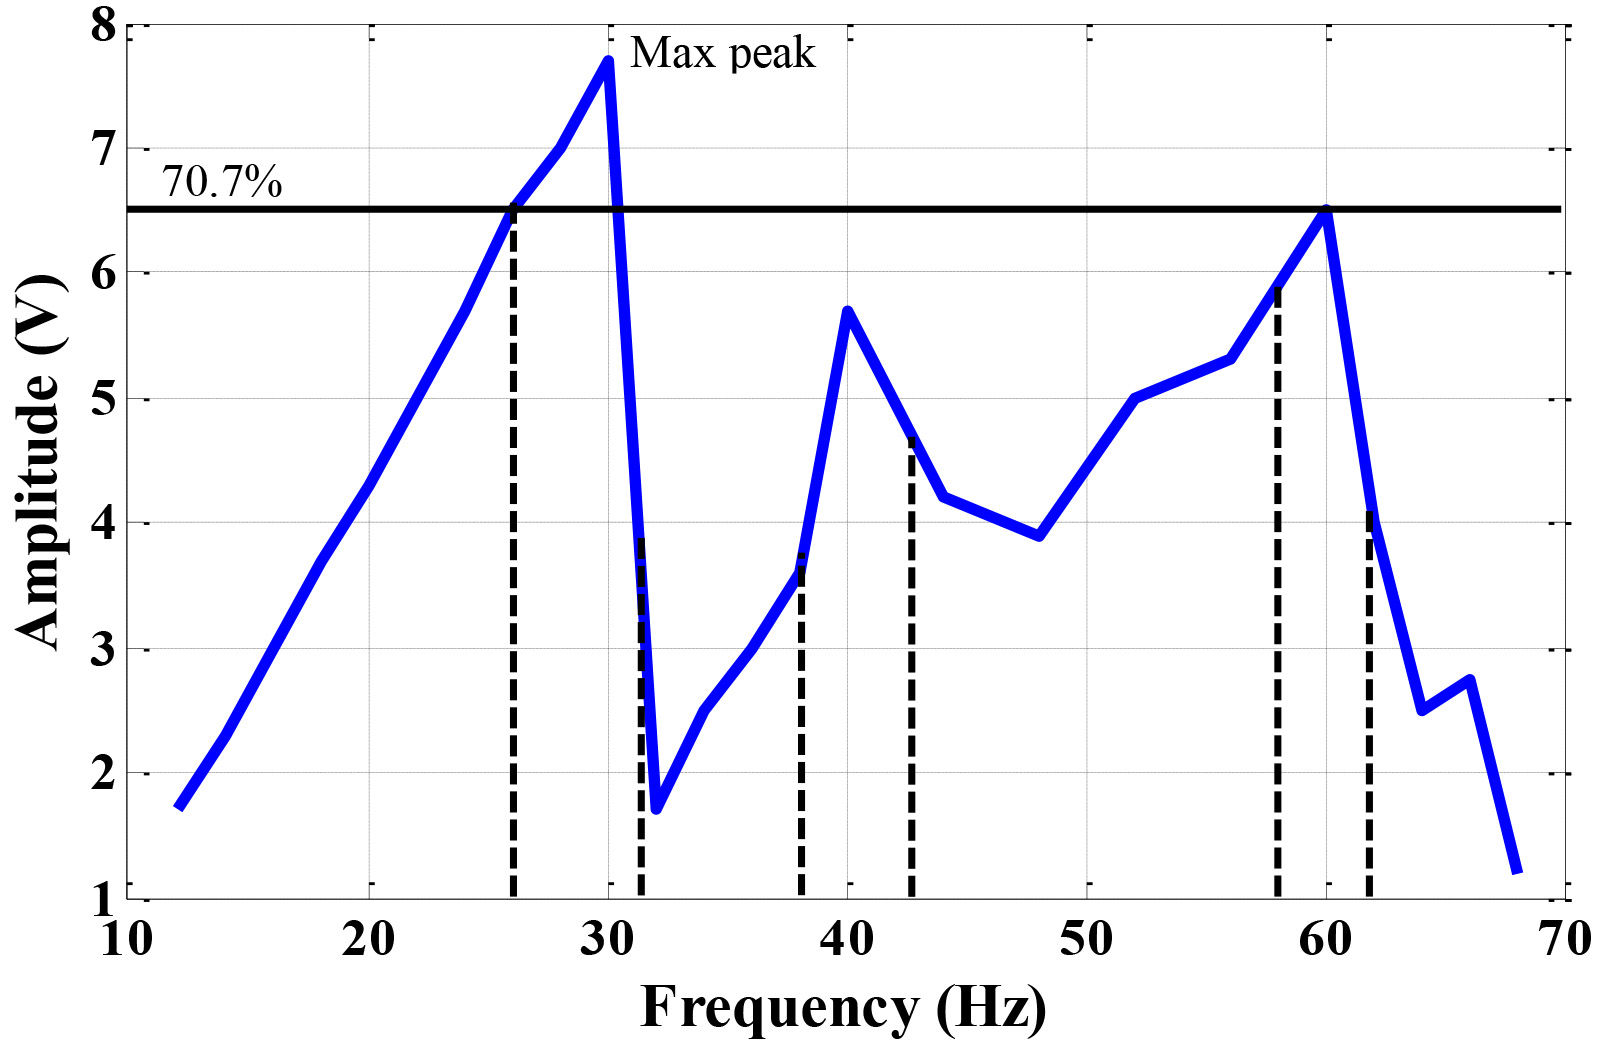
The simulation and experimental results of the rectifier circuit are presents in this section. In this study, different ranges value has been considered through simulation to choose the best value of capacitor with load.
From Fig. 10a–c denote simulation curve with smooth stable 6.1 V DC without ripple pulse, 6.1 V DC with ripple pulse and 6.1 V DC with more ripple pulse according Vpp 7 V AC with 30 Hz frequency, capacitor C
From Fig. 10g–i represents simulation curve with smooth stable 2.5 V DC without ripple pulse from Vpp 4.02 V AC, unstable 2.1 V DC with ripple pulse from Vpp 2.97 V AC and unstable 2.1 V DC with more ripple pulse from Vpp 3.5 V AC according 30 Hz frequency with capacitor C
(a), (b), (c), (g), (h), (i), (m), (n), (o) simulation and (d), (e), (f), (j), (k), (l), (p), (q), (r) experimental results with F 
continued.
10 pF and load R
From Fig. 10m–o represents simulation curve with smooth stable 0.6 V DC without ripple pulse from Vpp 1.7 V AC, unstable 1.7 V DC with ripple pulse from Vpp 2.7 V AC, unstable 1.1 V DC with more ripple pulse from Vpp 1.97 V AC corresponding 30 Hz frequency, with C
From Fig. 11a–c represents simulation curve with smooth stable 4 V DC without ripple pulse from Vpp 4.5 V AC, unstable 4.1 V DC with ripple pulse from Vpp 4.3 V AC, and unstable 4.01 V DC with more ripple pulse from Vpp 4.2 V AC according 40 Hz frequency, with C
From Fig. 11g–i represents simulation curve with pure stable 2.03 V DC without ripple pulse from Vpp 3.7 V AC, unstable 2.25 V DC with ripple pulse from Vpp 2.97 V AC, and unstable 2.51 V DC with more ripple pulse from Vpp 3.7 V AC according 40 Hz frequency, C
(a), (b), (c), (g), (h), (i), (m), (n), (o) simulation and (d), (e), (f), (j), (k), (l), (p), (q), (r) Experimental results with F 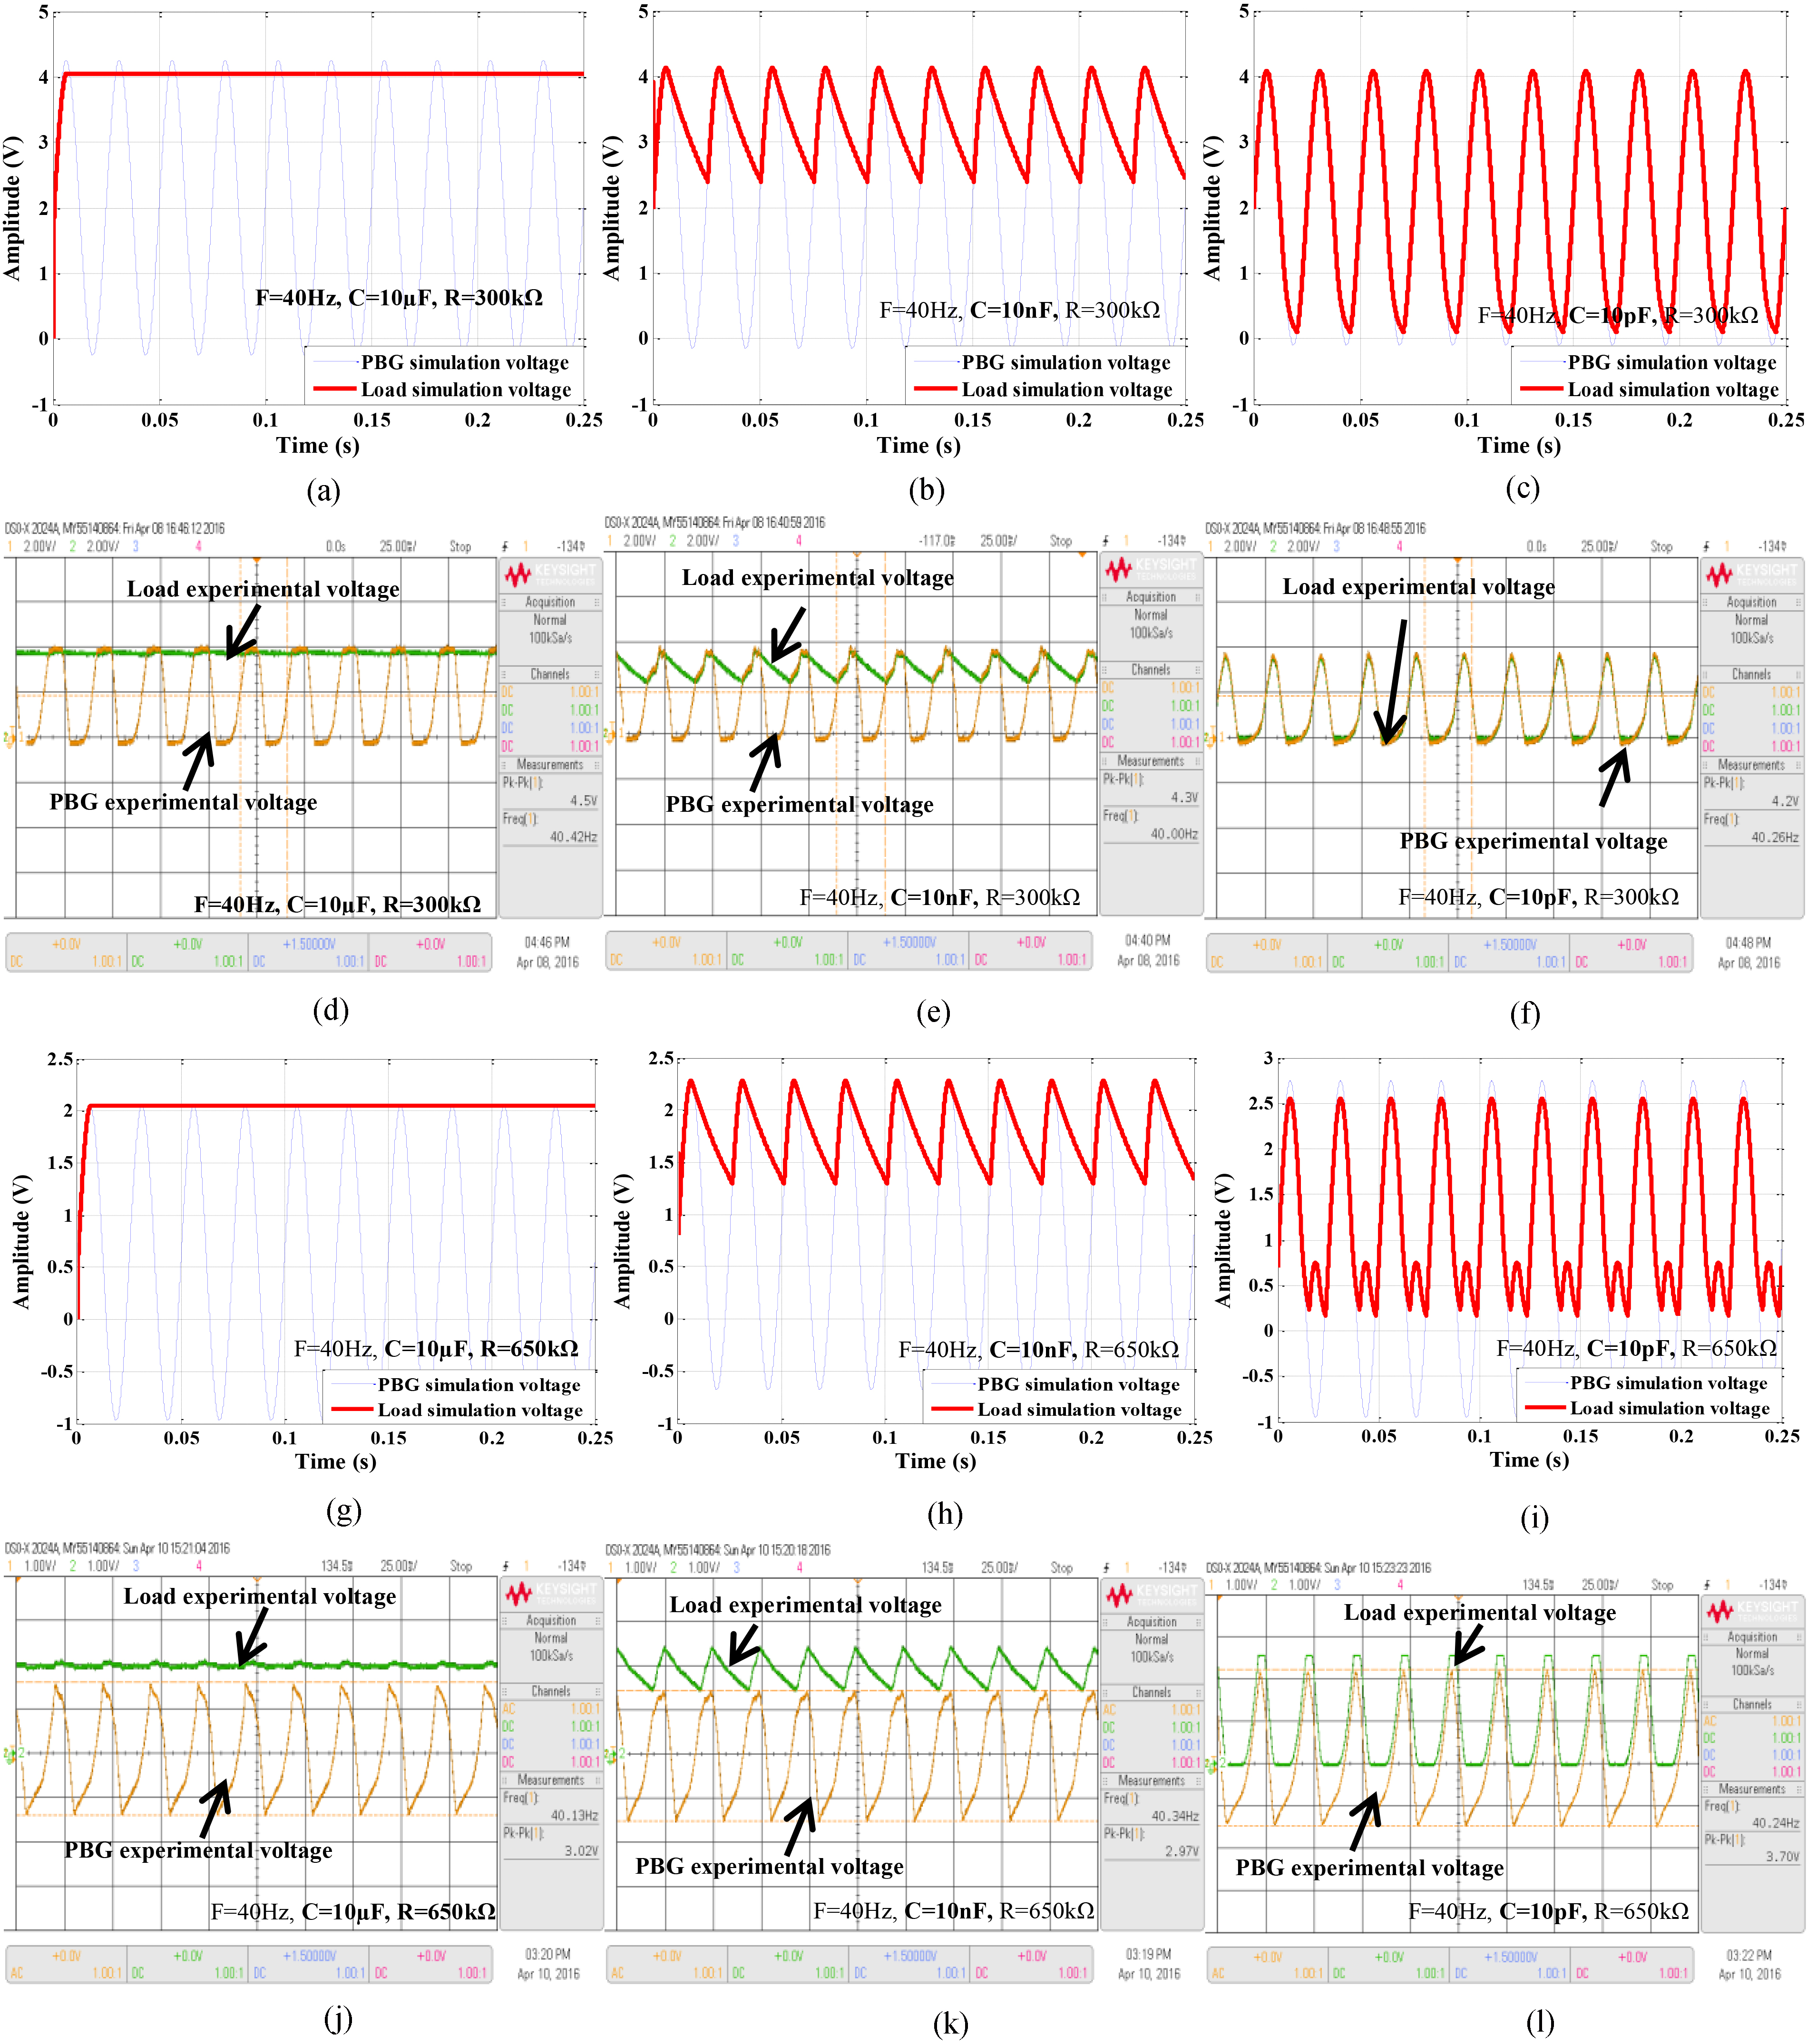
continued.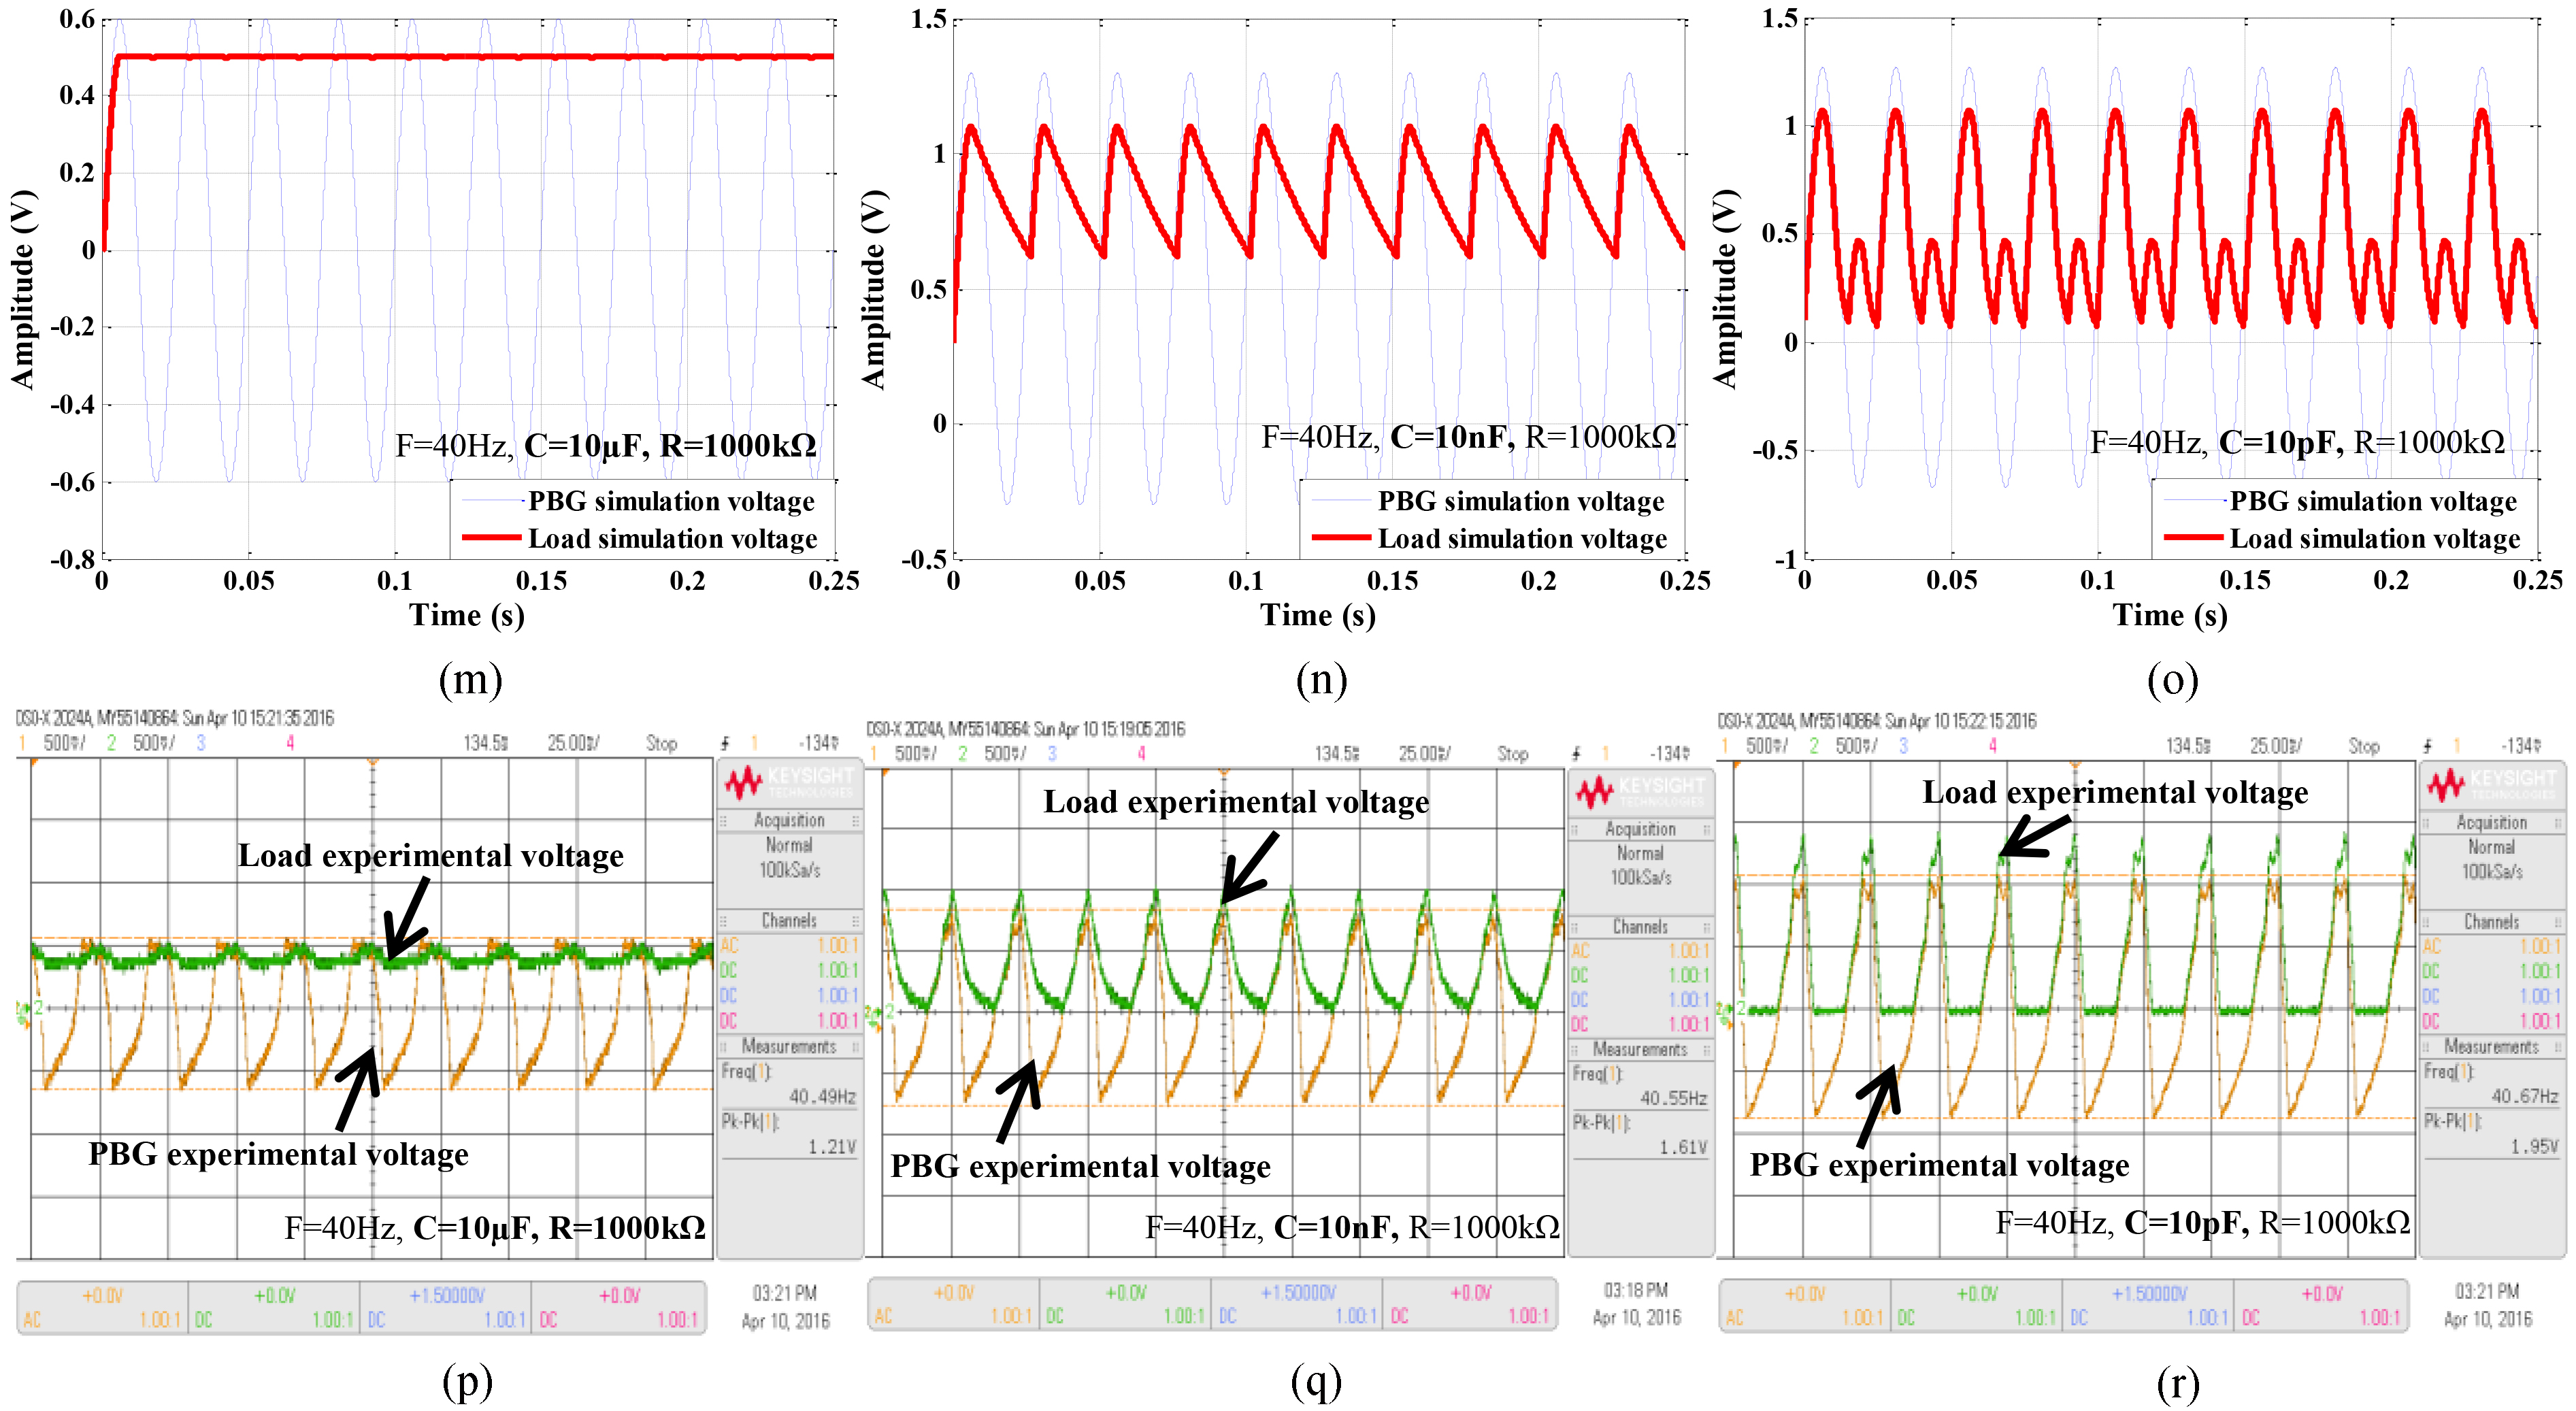
| Frequency | R |
Capacitor | V |
V |
Power |
|---|---|---|---|---|---|
| (Hz) | [ |
( |
|||
| 40 | 300 | 10 |
2.25 | 1.43 | 6.8 |
| 10 nF | 2.15 | 1.36 | 6.2 | ||
| 10 pF | 2.1 | 1.33 | 5.95 | ||
| 650 | 10 |
1.51 | 0.96 | 1.42 | |
| 10 nF | 1.49 | 0.94 | 1.38 | ||
| 10 pF | 1.85 | 1.17 | 2.13 | ||
| 1000 | 10 |
0.6 | 0.38 | 0.14 | |
| 10 nF | 0.8 | 0.50 | 0.25 | ||
| 10 pF | 0.97 | 0.61 | 0.38 |
Power assessment with different capacitor and load
From Fig. 11m–o represents simulation curve with pure stable 0.5 V DC without ripple pulse from Vpp 1.21 V AC, unstable 1.2 V DC with ripple pulse from Vpp 1.61 V AC, unstable 1.2 V DC with more ripple pulse from Vpp 1.95 V AC according 40 Hz frequency, capacitor C
From Fig. 12a–c represents simulation curve with smooth stable 5.8 V DC without ripple pulse from
(a), (b), (c), (g), (h), (i), (m), (n), (o) Simulation and (d), (e), (f), (j), (k), (l), (p), (q), (r) Experimental results with F 
continued.
Vpp 6 V AC, unstable 6.05 V DC with ripple pulse from Vpp 6.4 V AC, and unstable 4.3 V DC with more ripple pulse from Vpp 4.86 V AC according 60 Hz frequency, with C
From Fig. 12g–i represents simulation curve with pure stable 3.1 V DC without ripple pulse from Vpp 4.38 V AC, unstable 2.7 V DC with ripple pulse from Vpp 3.36 V AC, unstable 1.6 V DC with more ripple pulse from same Vpp 2.6 V AC with 60 Hz frequency, according C
From Fig. 12m–o represents simulation curve with pure stable 0.75 V DC without ripple pulse from Vpp 1.49 V AC, unstable 0.8 V DC with ripple pulse from Vpp 1.05 V AC, unstable 1 V DC with more ripple pulse from Vpp 1.02 V AC according 60 Hz frequency, capacitor C
This paper presented non-controlled rectifier circuit based on vibration using PBG to generate more power to run micro-devices. The proposed energy harvesting non-controlled rectifier circuit was simulated in Matlab software and then implemented in prototype board for its functionality verification. The simulation results were compared with the hardware results to verify and validated. The outcomes show that the output power obtained by the proposed non-controlled rectified circuit much more than that obtained by conventional rectifier. In hardware implementation, the maximum output power is 16
Footnotes
Acknowledgments
This work was carried out with the financial support from the Ministry of Higher Education of Malaysia under the research grant DIP-2014-028.