
Abstract
Transformers in the power systems are sometimes influenced by the DC bias and produce abnormal vibration or noise. This paper presents a method to simulate the transformer vibration increase due to the DC bias. A three-dimensional finite element model coupling the circuit – magnetic field – mechanical field is established for the simulating. Firstly, the 3D magnetic field in the iron core is calculated through combing the circuit equation and magnetic field equation. Secondly, the magnetostrictive force derived from the magnetic field is used to establish the transient structural force field model, so that the vibration displacement can be calculated. Based on the method, the vibration at different positions of the transformer iron core with different DC bias is investigated. The simulation shows that the vibration of the iron core is quite sensitive to the DC bias. The vibration amplitude significantly increases and the vibration waveform becomes asymmetrical and sharp with the increase of DC current. The odd frequency component, represented by 50 Hz and 150 Hz, appears and grows faster than the 100 Hz and 200 Hz component. The model and the simulation results can be used to guide the structural designing of transformers and promote the fault diagnosis method of transformers based on the vibration signal monitoring.
Introduction
Transformers in the power systems are sometimes disturbed by the DC bias, which lead to the half cycle saturation of the iron core, produce the excitation current distortion, and increase the harmonic content, etc. [1]. Additionally, the saturation of magnetic flux causes the enhancement of magnetic expansion in the iron core and the intensified vibration, which not only endangers the safe operation of transformers and affects power system security, but also makes noise pollution to the surrounding environment and influences the physical and mental health of the nearby population [2]. There are two main origins of transformer DC bias. One is geomagnetically induced currents (GIC) in the power networks generated by the magnetic storm. GIC can be up to 100 A in the high voltage power grid in China during strong magnetic storms. GIC can be regarded as the DC current in the AC system because its frequency is 0.0001
In recent years, it has been found many times that the DC bias causes abnormal vibration, transformer faults or even incidents threatening the safety of the power system. For example: in October 2002, the vibration of the transformer in Shanghai 500 kV substation suddenly increased and the noise became larger. The analysis shows that it is caused by GIC in the transmission system [4, 5]. In addition, in December 2002, the noises of two main transformers at Changzhou 500 kV substation reached 91.4 dB with the maximum neutral point DC current of 12.8 A during the commissioning period of a 500 kV HVDC transmission project [5].
At present, there have been several discussions concerning to the vibration of the transformers [6, 7, 8, 9, 10, 11, 12]. Reference [11, 12] offered simple and efficient spectral domain technique for DC bias measurement and compensation, based on detection of the even harmonics of the reactor/transformer magnetization current. However, the research of transformer vibration increase caused by the DC bias is mainly based on the monitoring of the displacement at the oil tank wall. The harm of DC bias to a transformer can be reflected through the monitoring data [13, 14, 15, 16]. Due to the complex structure of the transformers, the measurement of the vibration at the tank wall cannot fully present the vibration characteristics of the iron core. Additionally, the experimental study, in spite of consuming more time and cost, has less help for finding out the relationships between the vibration characteristics and the structure or operation condition of a transformer.
Some researchers tried to establish a model to simulate the vibration characteristics of the iron core under DC bias. For example, reference [17] analyzed the influence of the lamination structure on the resonance of the iron core based on the finite element method (FEM), and reference [18] measured the butterfly curve family of the magnetostrictive in the silicon steel sheet, and carried out the simulation analysis as well as experimental verification on the transformer vibration characteristics under DC bias.
However, in reference [18], the simulation model and the establishment procedure of the simulation model has not been fully discussed, and using the silicon steel magnetostrictive strain as the displacement of the iron core may bring significant error in the model. Reference [19] presented a model for simulating the vibration of the iron core and windings under the DC bias. In this model, it is necessary to know the permeability change of the medium with the volume density. But reference [20] has been proved that it is very difficult to obtain. Therefore, the simulation of the transformer vibration under the DC bias needs further research.
In this paper, we have established a three – dimensional circuit – magnetic field – mechanical field coupling model of the transformer by using the finite element method, and used it to analyze the vibration characteristics of the transformer core under different DC biases. Firstly, we combined the circuit equation and magnetic field equation, then discretized the weighted residual equations to the algebraic equations, so that we can compute the 3-D magnetic field in the transformer core. Secondly, we derived the equivalent magnetostrictive force of the iron core from the elastic theory and established the transient structural force field numerical model, which calculate the vibration displacement of the transformer core. Finally, we numerically simulated the iron core vibration with different DC bias. The model in this paper can be used to guide the structural designing of the transformer so that we can reduce the vibration and noise. Meanwhile, it can promote the development of the fault diagnosis method of transformers based on the vibration signal monitoring.
The circuit and magnetic field coupling model with DC bias.
The origin of DC bias is the potential difference between the neutral points of the transformers. When establishing the equivalent model, we use the normal AC voltage source and the offset DC voltage source on the neutral point as the excitation. The coupling model of circuit and magnetic field is shown in Fig. 1, where
Circuit equation
When both medium voltage and low voltage windings are open, in the circuit composed of the three-phase and the neutral point in the primary windings, the equation can be written as:
Where
According to the fundamental electro-magnetic theory, the nonlinear magnetic field within a transformer can be described as:
Where
A is the magnetic vector potential, which can be set to zero at the outside surface of the transformer tank;
J is the current density, which can be obtained from the coupling calculation of the circuit Eq. (1);
The 3D magnetic field within a transformer can be calculated by the edge finite element method. The edge element interpolation function is chosen as
Where
Thus the Galerkin weighted residual equation can be written as:
Where
We take the weight function Eq. (3) into the weighted residual Eq. (4). Then the weighted residual equation can be discretized into algebraic equations for all the weight function. Therefore, with any given value of J in Eq. (2), we can figure out the vector magnetic field A at all the nodes or edges, and then obtain the magnetic field B.
Assuming the original magnetic flux in the iron core is zero, we can calculate the exciting current
In the coupling model of circuit and magnetic field, the nonlinear of magnetic flux saturation is mainly derived from the B-H curve of the silicon steel sheet, which can be obtained from the data of the silicon steel sheet provided by the manufacturer.
Iron core vibration mechanism
The main sources of the iron core vibration are the magnetostrictive of the silicon steel sheet, and the electromagnetic force produced by the magnetic leakage at the joint of the silicon steel sheet and among the laminations. Moreover, the vibration caused by the magnetostrictive is more important [21].
It is assumed that the mass of a particle in the transformer core is
Where
mg is the gravity.
According to the investigations which have been made earlier [13, 14], the magnetostrictive force is much higher than the electromagnetic force. Therefore, we ignored the impact of the electromagnetic force when discussing the iron core vibration.
When the iron core is magnetized, the silicon steel sheet will have the magnetostriction. This phenomenon could be described through the following relation: magnetostrictive force caused by the internal magnetic field of the silicon steel sheet makes the deformation of the silicon steel sheet. The Magnetostrictive force can be obtained based on the elastic mechanics. In the numerical calculation of the three-dimensional mechanical vibration of the iron core, the discrete FEM model is used to replace the original continuous model. Therefore, each FEM unit in the iron core model is satisfied with the following assumptions in the elastic field:
The silicon steel sheet is homogeneous and isotropic elastoplastic, which means that the elastic constants of the objects do not change with the coordinate and direction of the grain. The iron core is completely elastic and obeys the Hooke’s law.
According to the basic principle of the elastic mechanics, we can obtain the force of the unit from the stiffness matrix and the displacement of the elements. Neglecting the shear strain of the silicon steel sheet, we can obtain the equivalent magnetostrictive force of the element by the generalized Hooke law.
Where
The magnetostrictive curve of the silicon steel sheet along the rolling direction (RD) and the perpendicular direction (TD) can be expressed as the following:
Where
For the example of the upper iron yoke, the lower left corner is supposed to be the origin, and the direction of the iron yoke is extended to the
Where
Taking Eqs (7) and (8) into Eq. (6), the equivalent unit magnetostrictive force is:
In the same way, we can obtain the distribution of the equivalent magnetostrictive force in any other structural parts. Taking them into Eq. (5), we can obtain the displacement, acceleration and other mechanical quantities at each position.
In this paper, we take the case of a three-phase five column transformer with the model of SFSZ10-180000/220. The nominal voltage of the transformer is 230 kV /121 kV /11 kV. The connection group is YNyn0d11. The type of silicon steel sheet of its iron core is 30ZH120 (Japan), and the core lamination coefficient is 0.97. The 3-D transformer model for the simulation is shown in Fig. 2, and the detailed assembly drawing of the iron core and windings is shown in Fig. 3.
Three-dimensional model of the transformer (A, B and C are three testing points selected on the iron core).
Assembly drawing of the iron core and the windings. (1 – left side column, 2 – A phase column, 3 – medium voltage winding, 4 – upper iron yoke, 5 – high voltage winding, 6 – the right side column, 7 – lower iron yoke). 
Distribution of the vibration displacement of the transformer.
The simulation steps are shown below: firstly, the magnetic flux density of each unit is obtained by the field-circuit coupling simulation with the help of ANSYS software, and then the equivalent magnetostrictive force of each unit is calculated by the field calculator. Secondly, we plugged the magnetostrictive force into the transient analysis field, imposing the constraint conditions on the iron core, and then computed the vibration of the iron core. In the external circuit of the model, the middle and low voltage windings are both set to open circuit to simulate the no-load operation. The DC voltage is adjustable for changing the DC bias current.
The distribution of the vibration displacement in the iron core is shown in Fig. 4 when the DC bias current in the high voltage winding is 0 A and 2 A. Figure 4a shows that the maximum value of the vibration displacement is 2.295
Relationship between the maximum amplitude of the vibration and the magnitude of the bias current.
In Fig. 5, the vibration amplitude increases of the iron core are shown with the increase of the DC current. The vibration amplitude is represented by the maximum displacement of testing point A, B and C. As shown in Fig. 2, A, B and C point are on the top of the left side column, A phase column and B phase column.
It can be seen that the vibration amplitude is approximately a linear relationship with the growth of DC bias before it reaches a turning point, and the growth rate of the vibration amplitude decreases thereafter because the iron core is deeply saturated.
Figure 5 also shows the vibration amplitude increase due to the DC bias at different position of the iron core. The DC bias has more influence on the vibration amplitude at the point A, and has less influence on the vibration amplitude at the point C. When the DC bias is exerted, the magnetic flux in flanked columns has maximum increments, so the enhanced vibration in the side columns causes the increasing of yoke lateral displacement. Therefore, the nearer the point closes to the side column, the faster the vibration amplitude grows.
Comparison of the vibration displacement waveform when the DC bias is 0 A and 2 A.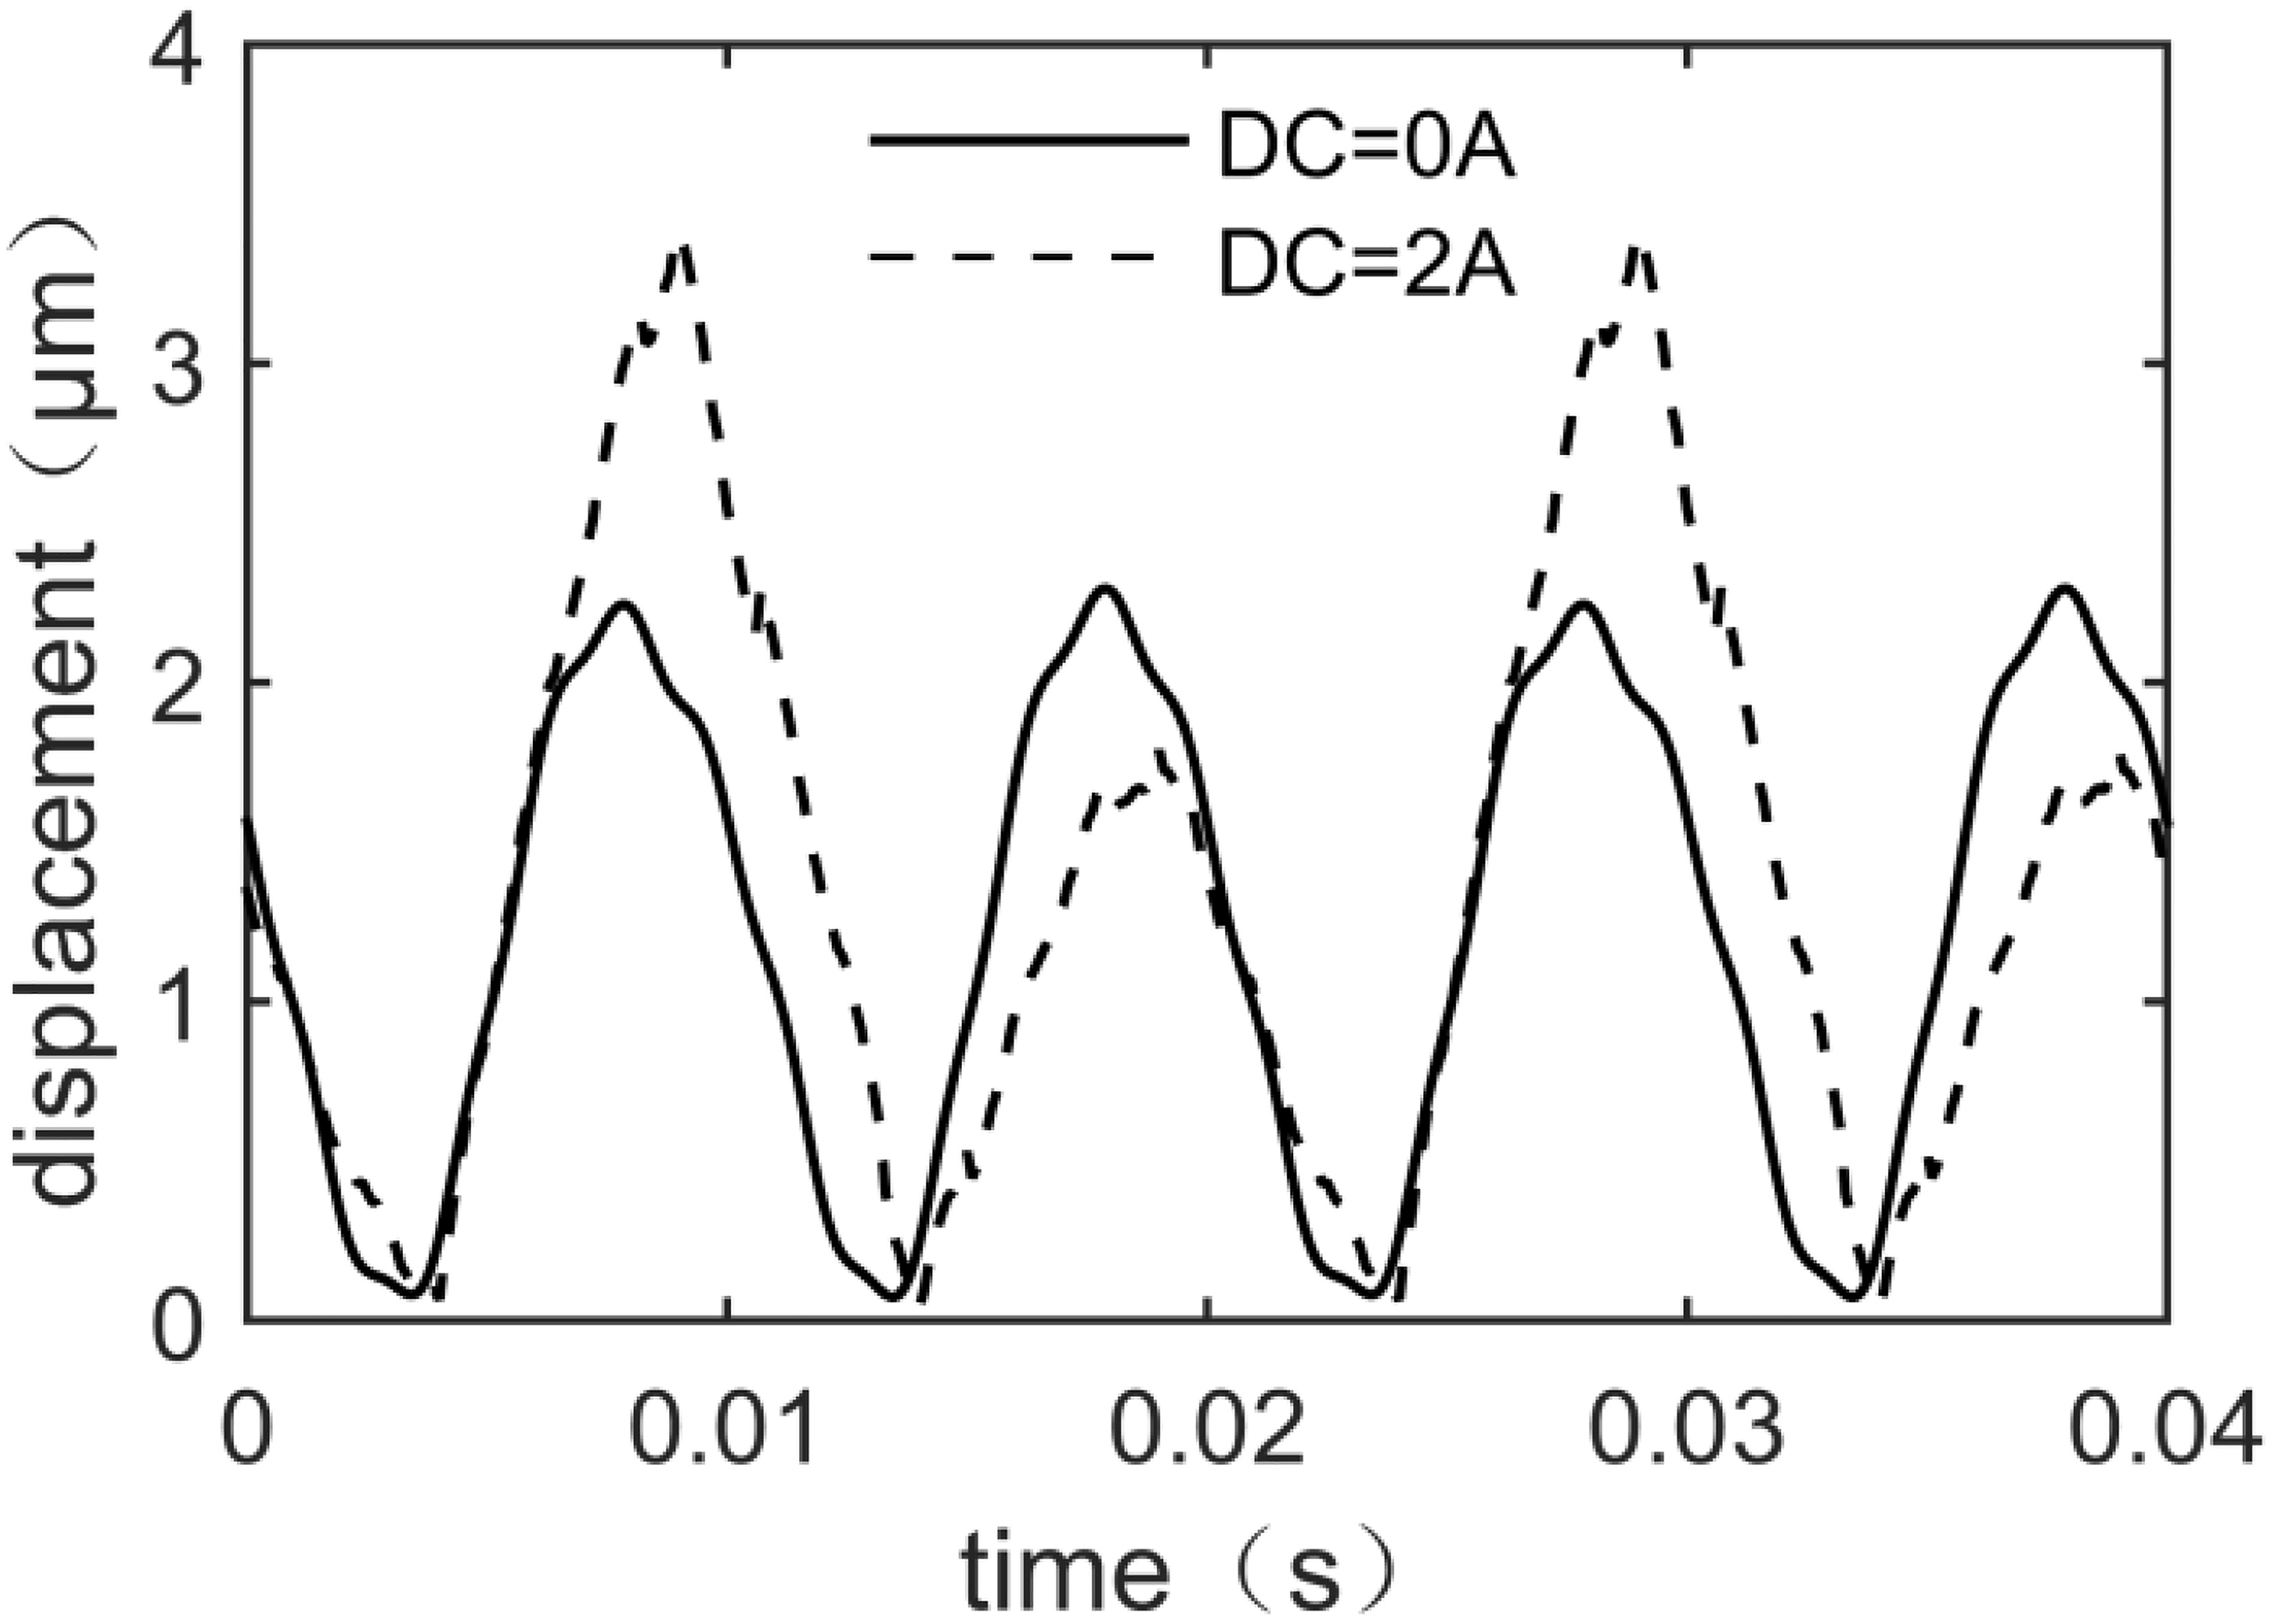
The comparison of the vibration waveform with or without DC bias in the time domain is shown in the Fig. 6. The waveform presents the vibration displacement of the point A in Fig. 2, which is on the top of the side column. It can be seen from the Fig. 6 that the vibration amplitude of the iron core is relatively smaller and the vibration waveform of the positive and negative half cycle in one excitation period is symmetrical when the DC current is zero. As a comparison, when the DC current is 2 A, the vibration amplitude is significantly increased, besides that the vibration waveform became asymmetrical and sharp, which implicate a change at the vibration spectrum.
Comparison of the vibration displacement frequency spectrum when the DC bias is 0 A and 2 A.
The comparison of the vibration displacement spectrum with or without the DC bias in the frequency domain is shown in the Fig. 7. The displacement comes from the point A in Fig. 2. It can be seen from Fig. 7a that the main vibration spectrum component without the DC bias is 100 Hz, and a little of even harmonics, and the odd harmonics are almost negligible. When the DC current is 2 A, the spectral components, which are shown in Fig. 7b, appear obvious 50 Hz and 150 Hz components, and the energy of higher frequency component is obviously increased so that the frequency spectrum is getting more complicated.
Relationship between the spectrum distribution of the vibration displacement and the DC bias.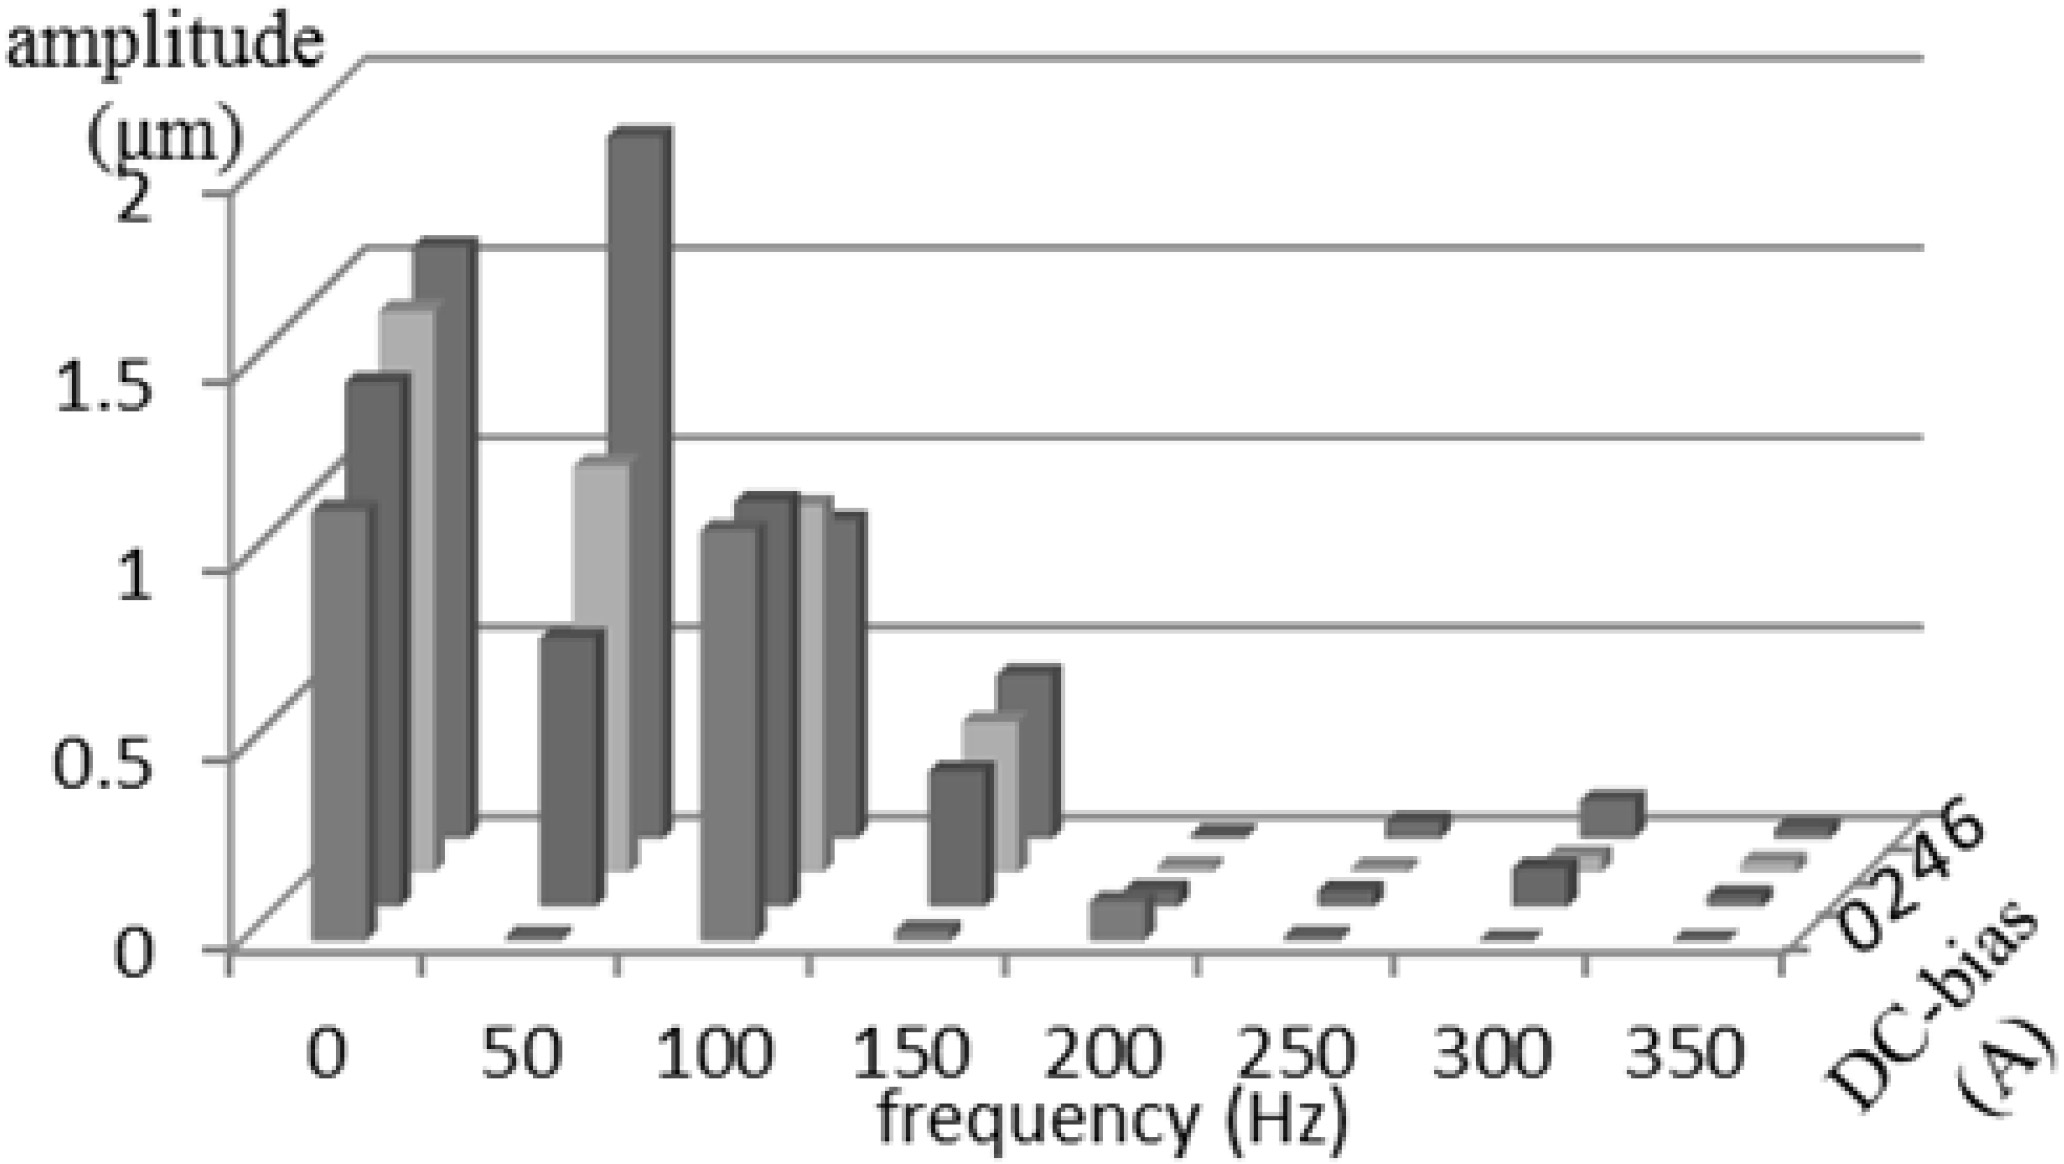
The relationship between the spectrum distribution of the vibration displacement and DC current is shown in Fig. 8. With the intrusion of DC current, the vibration frequency component is no longer concentrated on the 100 Hz. The odd times frequency component, represented by the 50 Hz and 150 Hz, appear and increase faster with the enlargement of DC current than the component of 100 Hz and 200 Hz. This simulation result is accord with the theoretical analysis, and it provide a criterion to judge if there is a core flux saturation due to the DC bias from the abnormal noise of a transformer.
Conclusions
This paper establishes a three-dimensional FEM coupling model of the circuit – magnetic field – mechanical field to simulate the transformer vibration increase due to the DC bias. Based on the method, we investigated the transformer core vibration under different DC current, which shows the significant influence of the DC bias on the vibration of a transformer.
The vibration of the iron core is quite sensitive to the DC current. Even small DC current is enough to cause obvious increase of the vibration and noise. The vibration amplitude appears approximately a linear increase with the growth of DC bias before the iron core is deeply saturated.
Because the cross section of the side column is only half of the phase column, the position near the side column has more vibration increment than that of the core column under the influence of DC bias. Therefore, we need to design the side column more carefully.
The 100 Hz component is the main component of the vibration spectrum without the DC bias. With the increase of DC current, the vibration amplitude significantly increases and the vibration waveform becomes asymmetrical and sharp. The odd frequency component, represented by 50 Hz and 150 Hz, appears and grow faster than the 100 Hz and 200 Hz component. This provide a criterion to judge if there is a core flux saturation due to the DC bias from the abnormal noise of a transformer and may be helpful for fault diagnosis and condition maintenance of power transformers.
Footnotes
Acknowledgments
This work was supported by National Key R&D Program of China (2016YFC0800103) and National Natural Science Foundation of China (51677068).