
Abstract
In order to predict multi-points frequency domain vibration response in the situation of unknown uncorrelated multi-source loads, a new multi-points vibration response prediction method in frequency domain is proposed. This new method is based on transfer functions and uncorrelated multi-source loads identification. After getting the system’s transfer functions from all uncorrelated multi-source loads to all the measurement points and vibration response of the known measurement points, the unknown uncorrelated multi-source loads in frequency domain can be identified by least square generalized inverse. Then, the vibration response of the unknown measurement points can be predicted through multiplying the identification uncorrelated multi-source loads and the system’s transfer functions from all uncorrelated multi-source loads to all the unknown measurement points. Experiment verification results of acoustic and vibration sources on cylindrical shell showed that the proposed approach could predict multi-points frequency domain vibration response in situation of unknown uncorrelated multi-source loads effectively.
Keywords
Introduction of multi-points vibration response prediction
Too large structural vibration response is one of the main reasons for mechanical damage. So it is necessary to predict the vibration response exactly, especially in the area of machinery, building, bridge and aerospace structure. The vibration response prediction can be divided into frequency and time domain method. The frequency domain method is the earliest and more mature. In frequency domain, there are two common methods to predict response: one is finite element method and another is transfer function based method. And the use of transfer function and load to predict response is widely used [1,2]. The use of finite element method is widely used either, Hughes K. [3] used the method to predict crashworthy response and Humphrey L. et al. [4] used finite element method to predict the dynamic response of a mini-cantilever beam. And with the rapid development of machine learning, Lian J. et al. [5] used LS-SVM method and optimized by PSO intelligent optimization algorithm to predict powerhouse structures’ vibration response. In order to overcome the exist defects of PSO, that is easy to fall into local extreme point and premature convergence. Guo-Bin et al. [6] proposed SSPSO-GRNN algorithm to do response prediction of powerhouse structure. Somashekar V. N. et al. [7] combined finite element method and experimental method to do response prediction of the printed circuit boards. The using fields of this method is very wide because of the application scope is very brand. Based on the proposed method. The bridge’s responses [8] can also be predicted once put up by Makris N. And the problem of wind response predictions of tall buildings [9] put up by Yip D. Y. N. can also be applied by the proposed algorithm. Including, the problem of vibration response prediction of a high speed flight vehicle considering acoustic and rocket motor excitation [10] put up by Kim J. H. is also applicable in the proposed method.
However, both of these methods can predict response only when the multi-source loads are known. In order to predict the unknown response in the situation of unknown uncorrelated multi-source loads, uncorrelated multi-source loads should be identified firstly. Mao W. et al. [11] used multiple-input multiple-output SVM model to do load identification. Wang et al. [12] used least square generalized inverse to estimate uncorrelated multi-source loads in frequency domain. Based on these, this paper discusses how to use transfer functions and loads identification to predict the unknown multi-points frequency domain vibration response in situation of unknown uncorrelated multi-source Load. The main innovations and contributions of this paper are as follows:
This paper proposed multi-points frequency domain vibration response prediction in situation of unknown uncorrelated multi-source Load, and the proposed formal description of the problem, form the input and output level compared the difference multi-points frequency domain vibration response prediction in situation of known uncorrelated multi-source Load. This paper proposed the method of transfer functions and loads identification based multi-points frequency domain vibration response prediction in situation of unknown uncorrelated multi-source Load and it’s applicable scopes. Using experiment verification results of acoustic and vibration sources on cylindrical shell verified the method’s precision of transfer functions and loads identification based multi-points frequency domain vibration response prediction in situation of unknown uncorrelated multi-source Load, and the reason of errors are analyzed.
Transfer functions and loads identification based multi-points frequency domain vibration response prediction in situation of unknown uncorrelated multi-source load
Problem description and model formalization
In traditional, response prediction model is shown in Fig. 1. Based on transfer functions, the input of the linear time invariant (LTI) structure is stationary random uncorrelated multi-source loads and the output is multi-points vibration responses in frequency domain. This model is called multi-points frequency domain vibration response prediction in situation of known loads.

Multi-points frequency domain vibration response prediction in situation of known loads.
The proposed problem is different from the traditional multi-points frequency domain vibration response prediction in situation of known loads problem. Figure 2 shows the response prediction model under unknown loads. The question is that now only part of vibration response of measurement points is known. The responses can be classified into the known response and the unknown responses. Then n responses can be classified into n 1 known response points and n 2 unknown response points (n 1 + n 2 = n). The vibration response of the n 2 unknown measurement points should be predicted by vibration response of the n 1 known measurement points without knowledge of uncorrelated multi-source loads.

Multi-points frequency domain vibration response prediction in situation of unknown loads.
Multi-points frequency domain vibration response prediction in situation of unknown loads is very different from Multi-points frequency domain vibration response prediction in situation of known loads. The biggest difference lies in that in traditional responses prediction problem, the loads must measurable and must be known. Table 1 compares the two different models in input and output.
Comparison of responses prediction in situation of known loads and unknown loads
Linear relationship between vibration response and uncorrelated multiple loads
In frequency domain, vibration responses of LTI system from uncorrelated multi-source loads and multiple measurement points meet the following equation [9]:
Step (1): The obtainment of the system’s transfer functions
The obtainment of transfer functions can be classified in two ways. One is theoretical analysis method, which is based on Finite Element Method (FEM) [10]. Another is based on experimental methods, such as use liner regression modal to analyze experimental data [11].
Step (2): Uncorrelated multi-source loads identification
When the number of known responses no smaller than the number of load sources, that is n
1 ≥ m, the uncorrelated multi-source loads can be identified through the system’s transfer functions of all uncorrelated multi-source loads to all the known measurement points and the vibration response of the n
1 known measurement point [9].
After plugging the identified uncorrelated multi-source loads into Eq. (1), the vibration response of the unknown measurement points can be predicted.
The method of transfer functions and loads identification based responses prediction can be split in the following steps, shown in Fig. 3. Firstly, use the known points’ responses data

The procedure of transfer functions and loads identification based responses prediction algorithm.
By this algorithm, the unknown responses can be predict without knowledge of loads and the algorithm can predict more than one responses in the same time. The system must be linear and time invariant, so the transfer functions exist and can’t change. The load sources must be uncorrelated and stationary random, while positions are known. The number of known response points must no smaller than the number of uncorrelated load sources. Because this method is based on least squares method, there may exist ill-condition of matrix inverse problem [13]. The algorithm is applicable in frequency domain and the phase is unrecognizable. In all, the method can be used to predict the vibration response especially in the area of machinery, building, ships, rockets, bridge and aerospace structure where the loads is hard to measured.
Experimental verification
Cylinder structure under the excitation of uncorrelated acoustic and vibration
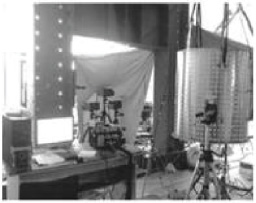
The experiment device is a cylinder structure fixed in the vibration table by the fixture, and hung through the elastic rubber ropes. In the internal of cylindrical shell, there was an acoustic reverberation acoustic excitation as shown in Fig. 4 below. And in the external, there was a vibration excitation of vibration excitation of vibration table which included a sensor recording the vibration excitation, as show in Fig. 5, the external acoustic excitation and the vibration response of surface and inner device as shown in Fig. 6 below. The arrangement of measuring points as shown in Fig. 7 below. And the vibration excitation source as shown in Fig. 8 below. The details of the experiment can be found in reference [14].
Data acquire and experiment design
In the experiments, it could be thought that there were only two independent excitation sources and 18 sensors to measure the vibration responses data in which some data is known and the rest is unknown, using the known vibration data to predict the unknown responses data is what should be done. There were three magnitudes acoustic-only excitation, five magnitudes vibration-only excitations, and 15 acoustic and vibration union excitation magnitude gradually increased. In all the 15 pair experiment, 14 pair is chosen for training and leave one pair for testing. In the experiment, each pair of the 15 pairs is chosen for test and the statistical result is acquired.

Acoustic excitation.

Cylindrical shell measuring points.
Structure surface.

Arrangement of measuring points.

Vibration excitation source.
To validate the correctness and precision of this method, the predict response must compare with the measured response and 3dB relative error is widely used in engineering practice. Given prediction response
To validate the correctness and precision of this method, the chosen unknown responses should compare with the measured responses. Because there are total 15 pair experiment and 18 response points, for predicting one point, there are 15 × 18 = 270 conditions to compare the measured responses to the predict response. In order to make it short, we only express one pair’s result for comparing. Table 2 shows when one point response is unknown, the result of the predict response comparing with the measured response. t stands for the unknown point’s number.
The energy of error over 3 dB of predicted response and measured response%
The energy of error over 3 dB of predicted response and measured response%
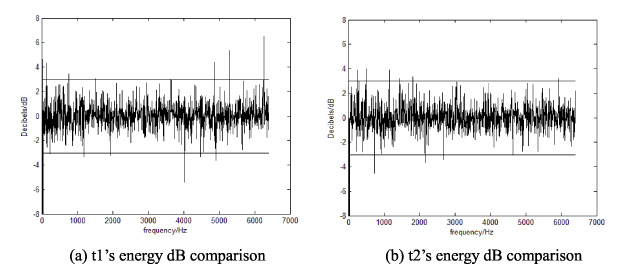
When more than one response points predicted, the conditions will be much more than just one unknown point response. For convenience, just 2 point at random in a pair to compare the predict response with the measured response are chose. Table 3 shows the result of the comparison, each t1 and t2 combined to a group. To make it more clear, Fig. 9 is given to compare the predict response and the measured response and Fig. 10 shows the energy dB of the predict response and the measured response.
The energy of error over 3 dB of predicted response and measured response%
As it shows clearly in Tables 2, 3 and Figs 9, 10, the predict response is very close to the measured response and the average of over 3 dB is about 1%–2%. The over 3 dB data’s frequency mainly lies in the around of resonance frequencies. And the resonance frequencies are show in Table 4.

The predicted response compare with the measured response.
The energy dB of the predict response compare with the measured response.
Condition number of the system’s frequency around natural resonance frequencies
The compute of condition number of a matrix as follows:
However, there existed difference of error, the cause of which lies in:
In the real experiment there exist noises and other aspects of data error. This method has a very strong theoretical basis, both theoretical and experimental results show that the prediction response is very close to the measured response. But the ill-condition of matrix inverse problem is another reason of the error between prediction response and the measured response [13]. Due to measurement noise in loads and responses, transfer function identification error is another reason of the difference of error. The weak nonlinearity of the system also causes the difference between the predicted response and the measured response.
Transfer functions and loads estimation based algorithm is introduced to response prediction algorithm in frequency domain when uncorrelated multi-source loads are unknown. Response prediction experiment verification results of acoustic and vibration sources on cylindrical shell showed effective and higher accuracy of the proposed approach. But this method can only solve the response prediction of linear system, how to predict nonlinear system’s response is future research direction. How to prediction responses in the situation of unknown transfer functions and unknown loads is also the future research direction.
If the load sources are correlated to each other in frequency domain, the phase of loads and responses will be very important. How to characterize the phase of load and correlated load sources which are also further research direction based multi-source dynamic random response prediction algorithm in frequency domain.
Footnotes
Acknowledgements
This research was supported by National Natural Science Foundation of China (Grant No. 51305142, 51305143, 61502181), the science and technology planning project of Quanzhou (Grant No. 2017G019 and 2018C110R), the General Financial Grant from the China Postdoctoral Science Foundation (Grant No. 2014M552429), Natural Science Foundation of Fujian Province (No. 2017J01111), Postgraduate Scientific Research Innovation Ability Training Plan Funding Projects of Huaqiao University (No. 1400214012).