
Abstract
This paper describes eddy current magnetic signature (EC-MS) method that can evaluate small plastic deformation in carbon steels with high accuracy. In EC-MS method, an incremental magnetic field is superimposed on a magnetization field, and the directions of the incremental field to the magnetization field changes, depending on experimental setups. The objective of this study is to investigate the influence of the measurement conditions on experimental results of EC-MS method. Tensile test specimens are measured by EC-MS method with different directions of the incremental field parallel and perpendicular to the magnetization one. Furthermore, the dependence on the static/quasi-static magnetization field is discussed comparing a continuous waveform of the magnetization field with a stepwise one.
Keywords
Introduction
Nondestructive evaluation of plastic deformation is important for the maintenance of structural components of ageing plants and infrastructures. Magnetic techniques are practically used for evaluation of plastic deformation and residual stress in steel components. To evaluate the lower range of plastic deformation around several % in carbon steels, magnetic incremental permeability (MIP) [1] is the best sensitive and stable technique among other electromagnetic techniques such as eddy current testing, non-linear eddy current testing, pulsed eddy current testing, Barkhausen noise method and MIP method [2]. Improving the signal processing of MIP method, the authors proposed eddy current magnetic signature (EC-MS) method to evaluate lower range of plastic deformation [3]. In EC-MS method and the MIP method, an incremental field is superimposed on a magnetization field to measure MIP. However, the directions of the incremental field to the magnetization field change depending on experimental setups. Moreover, it has not revealed yet whether the signals of EC-MS and MIP change depending on the static or quasi-static magnetization field. Therefore, it is necessary to clarify the influence of the measurement conditions on experimental results of EC-MS and MIP method.
This study aims to investigate the influence of the measurement conditions of EC-MS method and MIP method on experimental results such as superposition of incremental magnetic field and the rate of magnetization field. For the purpose, tensile test specimens of carbon steels are measured by EC-MS method with different directions of the incremental magnetic field; the direction of the incremental magnetic field is parallel or perpendicular to the direction of the magnetization field Moreover, by measuring EC-MS at different eddy current testing (ECT) frequency, the influence of the superposition of incremental magnetic field and the frequency dependency of EC-MS is investigated systematically.
Some institute of physics, for instance the German-one, have the measurement rule, to measure the MIP, point-wise, for individual static magnetic field-points, then superimposing the inner loop and measure the induced voltage. Therefore, this procedure is investigated using a stepwise waveform of the magnetization field, and the results are compared with those of using a continuous triangular waveform.
Tensile test specimens
In this study, tensile test specimens are prepared using commercial steel plates of carbon steel for boilers and pressure vessels, JIS SB410. The chemical composition of SB410 steel plate is shown in Table 1. Figure 1 shows the dimensions of tensile test specimen with thickness of 8.0 mm, and the rolling direction is the same as tensile direction. Tensile test is performed by INSTRON5582 at room temperature. Displacement is controlled, and crosshead speed is 1 mm/1 min. The targeted residual strain of the specimen is 5%. After tensile test, the center part of the reduced section were cut out by 50 mm. The as-received specimen and the 5% strain specimen are used for comparison.
Chemical composition of carbon steel JIS SB410 (mass %)
Chemical composition of carbon steel JIS SB410 (mass %)
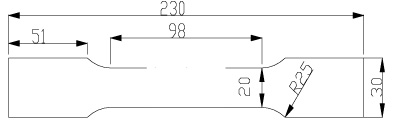
Dimension of tensile test specimen (unit: mm).
Magnetic incremental permeability 𝜇Δ is defined as 𝜇Δ = ΔB∕𝜇0ΔH, where 𝜇0 is the permeability of free space, ΔB is the incremental magnetic flux density, and ΔH is the incremental magnetic field [1]. In MIP method and EC-MS method, ECT coil impedance during magnetization is measured instead of the inclination ΔB∕ΔH for each minor loop since the ECT coil impedance is proportional to MIP. Figure 2 shows the schematic drawing of EC-MS and correspondence among hysteresis curve, MIP curve and EC-MS. The coil impedance as function of applied magnetic field is plotted like Fig. 2(b). Here, focusing on the ECT signal in an impedance plane, the ECT signal draws a unique trajectory like Fig. 2(c), and this trajectory is called EC-MS [3]. The loop of EC-MS is corresponding to the time moment when the magnetic induction B meets the coercivity point.

Schematic drawing and correspondence among hysteresis curve, MIP curve and EC-MS.
The experimental setup for measurement of the EC-MS method is shown in Fig. 3. The magnetization field is applied to the specimen by an electromagnet. The tangential magnetic field of the specimen is measured by a Hall element. Test 1 is to investigate the influence of the direction of the incremental magnetic field and the magnetization field. Two type of experimental setups are used. In the first-one, the incremental magnetic field is perpendicular to the magnetization field shown in upper right side of Fig. 3. A pancake type coil of ECT for the perpendicular incremental magnetic field is put on the surface of the specimen in perpendicular type. The dimensions of the pancake coil are as follows: inner diameter 3.3 mm, outer diameter 3.95 mm, height 3.0 mm, the number of turns 275, and thickness of wire 0.05 mm. In the second-one, the incremental magnetic field is parallel to the magnetization field shown in lower right side of Fig. 3. A rectangular encircling coil is used for the parallel incremental magnetic field. The dimensions of rectangular coil are as follows; outer cross section 22 mm × 11 mm, height 20 mm, the number of turns 133, and thickness of wire 0.1 mm. The coil impedance is measured using an LCR meter using current controlled mode with the effective value of current amplitude of 5 mA. The experimental conditions are shown in Table 2.
Test 2 is to investigate the influence of the static/quasi-static field of the magnetization, and the perpendicular type is used for excitation of incremental magnetic field. For the static magnetization field, the output current of the bipolar power supply is defined as a stepwise function. Each step is hold over 20 s, and the step width is 0.05 A up to 0.2 A. Over 0.2 A, the step width is 0.1 A. The experimental condition is shown in Table 2.
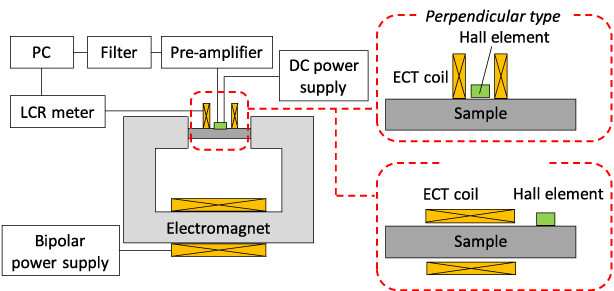
Experimental setup of eddy current magnetic signature method.
Experimental conditions
Test 1: Influence of the direction of incremental magnetic field and magnetization field
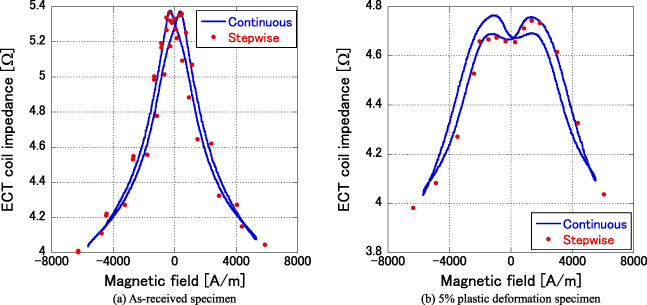
The ECT coil impedance is measured with reference to the impedance in air. Figures 4(a) and (b) show the amplitude of the ECT coil impedance as function of the applied magnetic field at the ECT frequency of 50 kHz. In the case of perpendicular incremental magnetic field, the amplitude of coil impedance decreases and peak-to-peak distance increases because of plastic deformation as shown in Fig. 4(a). The same tendency can be seen in the parallel incremental magnetic field as shown in Fig. 4(b).
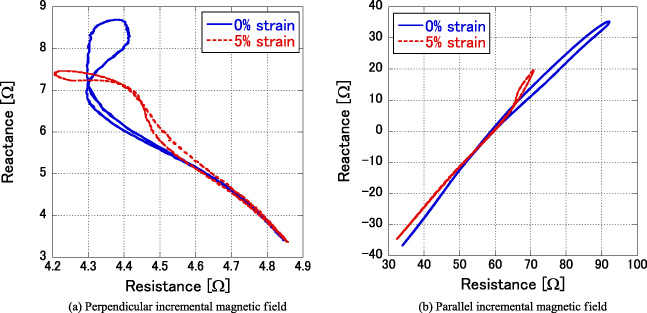
Figures 5(a) and (b) show the eddy current magnetic signature of as-received and 5% plastic deformation specimens at the ECT frequency of 50 kHz in perpendicular and parallel incremental magnetic field, respectively. Horizontal and vertical axes are resistance and reactance of ECT coil impedance, respectively. The loops of EC-MS in Fig. 5(a) correspond to coercivity points and the shape of the loop change because of plastic deformation. In parallel incremental magnetic field, both loops of 0% and 5% are more narrow than perpendicular one.
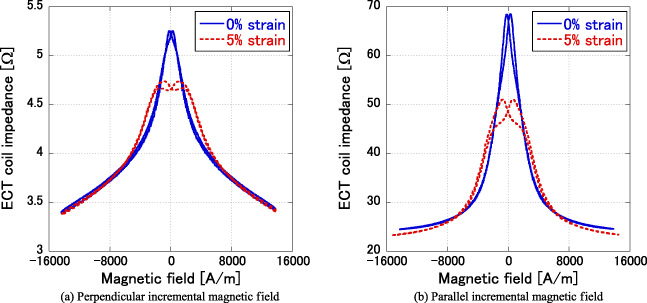
Amplitude of the ECT coil impedance as function of the applied magnetic field at the ECT frequency of 50 kHz.
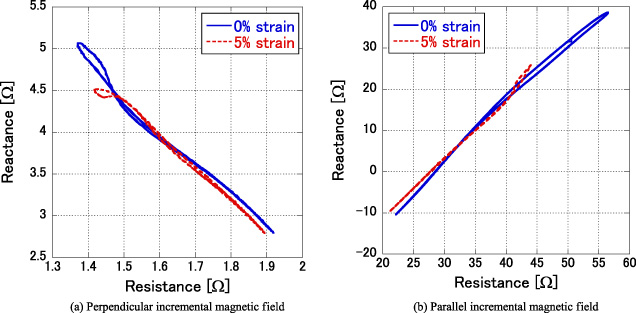
Eddy current magnetic signature of as-received and 5% plastic deformation specimens at the ECT frequency of 50 kHz.
The ECT frequency dependency of EC-MS is investigated. The EC-MS of as-received and 5% plastic deformation specimens at the ECT frequency of 10 kHz are shown in Figs 6(a) and (b). The results of 100 kHz are shown in Figs 7(a) and (b). In perpendicular field, the loops of EC-MS cannot be seen at lower frequency in Fig. 6 (a). On the other hand, the shape of the loops changes drastically at higher frequency in Fig. 7(a). In parallel one, both lower and higher frequency EC-MS does not change. Therefore, the perpendicular incremental magnetic field is more suitable for visualization of plastic deformation.

Eddy current magnetic signature of as-received and 5% plastic deformation specimens at the ECT frequency of 10 kHz.
Eddy current magnetic signature of as-received and 5% plastic deformation specimens at the ECT frequency of 100 kHz.
Figure 8(a) shows the comparison between stepwise and continuous waveform in MIP curves of as-received specimen and (b) shows that of 5% plastic deformation specimen. Those of EC-MS are shown in Figs 9(a) and (b). In 5% plastic deformation specimen, the data of the stepwise waveform are measured only during one half of the hysteresis cycle, because the results of stepwise waveform are expected in symmetry. All results of stepwise waveform well agree with the continuous-one in MIP and EC-MS. These results indicate that the magnetization field change, applying a quasi-static field is not resulting a measurement error of the LCR meter and the EC-MS, reflecting plastic deformation, can be measured accurately.
Comparison between stepwise and continuous waveform in MIP curves of as-received and 5% plastic deformation specimens.

Comparison between stepwise and continuous waveform in EC-MS of as-received and 5% plastic deformation specimens.
The influence of the measurement conditions of EC-MS method on the experimental results was investigated in this study. From the results of MIP and EC-MS with the incremental magnetic field perpendicular and parallel to the magnetization field, clear difference due to perpendicular or parallel superposition of the incremental magnetic field cannot be observed in MIP measurement. In EC-MS measurement, the perpendicular incremental magnetic field is more suitable than the parallel-one to evaluate plastic deformation . MIP curves and EC-MS of stepwise waveform magnetization field well agree with those obtained when a continuous triangular waveform at lower magnetization frequency such as 0.05 Hz is applied. Those results indicate that the change of EC-MS due to plastic deformation is independent on the low frequency magnetization field and can accurately be measured by the LCR meter.
Footnotes
Acknowledgements
This work was partly supported by the JSPS Core-to-Core Program, A. Advanced Research Networks, “International research core on smart layered materials and structures for energy saving”, the FY 2016-2017 JSPS-HAS Bilateral Joint Research Project, JSPS KAKENHI Grant Number 18H01448, Grant-in-Aid for JSPS Fellow (16J04522), and 2016FY Collaborative Research into Nuclear Power by Chubu Electric Power Co., Inc.