
Abstract
There are many nondestructive methods of coatings evaluation. Only a few of them can be utilized in case of coatings deposited on nonconductive elements. This paper presents application of a terahertz time domain spectroscopy for measuring thickness of thin nonconductive coatings. In order to develop a robust algorithm for thickness identification various experiments were carried out. A metal vessel filled with a small amount of oil was used as the test specimen. Such specimen allows us to easily achieve sample with a variable coating thickness.
Introduction
Coatings and paints are widely used in almost all branches of modern industry. They are used in automotive industry, civil engineering, ship building and other industrial applications. The main goal of using them is a protection of substrate against electrochemical corrosion, weathering or other aggressive agents. Therefore, modern paints and coatings are very complex chemical mixtures. They content organic film formers, pigments, additives, solvents, thinners and diluents.
It is very difficult or even impossible to meet the requirements of all industrial branches with a single coat of paint. It is clear if one lists typical requirements of the industry: adhesion to substrate, chemical resistance, corrosion protection, mechanical properties, physical properties, color, opacity, gloss, texture, durability. Every branch of industry demands his own paints with specific properties and moreover only the coat with number of different layers (a paint system) can fulfill all the requirements of a given industry branch.
A typical automotive paint system might consist of up to five different coats. Main coats are primer, topcoat (color base) and clearcoat. Each of this coat can consists of more than one layer. Because purposes of these coats are different hence their composition and thickness has to be very different too. The primer coat should ensure a good adhesion of all paint system to substrate and seal the substrate surface. The color base will give obliteration of the substrate and provide an esthetic effect. The clearcoat is used for two purposes – to contribute significantly to protection of substrate (and color base) and to intensify the esthetic effect i.e. give a required gloss.
The primer layer should have thickness about 60 μm, the topcoat thickness should be about 30–40 μm and the clearcoat thickness is about 50–60 μm. Because of distinct roles of every coat layer the test methods for every coating material are different. But one property is always tested independently from type of layer, industry branch, stage of technology etc. - engineers, technologist, scientists always measure thickness of the layers.
In many applications thicknesses of the coating is a critical parameter affecting ability and time of protection. Usually coatings systems are applied as thin layers of 50–200 micrometers in thickness. There are many factors that can cause coating failures. One of them is incorrect or not uniform thickness.
Therefore, precise evaluation of thickness is an important task. And last but not least factor is the film thickness impact on a cost.
There are several methods of thickness measuring. The main factors to determine what method is the best are the substrate material, the type of coating, the thickness range of the coating, the size and shape of the part, and the cost of the equipment. Generally, one measured the thickness of cured coatings (mostly organic). Methods includes nondestructive measurement like magnetic, eddy current, ultrasonic, or micrometer measurement. There are also destructive methods for cured coatings like cross-sectioning or mass measurement. More complicated is to exactly measure the coat thickness before it is dried or cured.
Magnetic methods are used to nondestructively measure the thickness of a nonmagnetic coatings on ferrous substrates. These methods use simple principles of operation: magnetic pull-off or magnetic/electromagnetic induction. Eddy current method is also nondestructive method and can be used to measure the thickness of nonconductive coatings on conductive substrates. Eddy currents in the conductive the substrate is induced by a magnetic field produced in excitation element. The coating thickness i.e. distance to substrate, influence strength of the eddy current effect.
The thickness of coatings on nonmetal substrates is measured by ultrasonic method. This well-known method is also one of the popular NDT methods. On the other hand, one example of the destructive methods is Paint Inspection Gauge (PIG). In this method cutting tool make a precise V-groove through the coating into the substrate. The film thickness is measured by viewing the cut microscopically. This method requires experience and accuracy. The thickness of wet-film is measured with a very simple wet film comb or a wheel. This gage is a flat plate (for example aluminum) with calibrated notches on each side. Immediately after coat application the plate is perpendicularly put on the coated surface. The film thickness is between the highest coated and the next uncoated notch. In this way one can also measure the thickness of uncured powder paints. As one can see there are many methods of examination of coating thickness. They can be used on site or only in laboratories. These methods can be divided into simple methods (not demanding a complicated equipment) and methods using a sophisticated equipment. Only a few methods, mostly very simply and unfortunately inaccurate, can be utilized to measure nontransparent coats in the wet stage, without damaging the structure. One of such method is the terahertz time domain spectroscopy.
Measuring method
In the last years, methods utilizing terahertz (THz) electromagnetic waves becomes more and more popular in many applications including inspection of nonconductive coatings. The terahertz radiation lies above the frequency range of traditional radio and microwaves but below the range of infrared waves [1]. The THz radiation allows achieving a relatively good spatial resolution and penetration depth. Many dry, non-metallic materials like polymers, ceramics, etc. show little THz absorption, which allows one to use it as inspection tool [2,3]. The THz method has a higher spatial resolution than ultrasound due to its shorter wavelength. The THz radiation is also nonionizing, which makes it completely safe for servicing staff. The measurements were done a THz time domain spectroscope, model Tray 4000 (Fig. 1) produced by the Picometrix (Luna Inc.). The terahertz systems working in a time domain provides detailed information about the internal structure of the tested materials. The TDS-THz system consists of a control unit with a femtosecond laser, which generates extremely short current pulses in a photoconductive antenna. Such excited antenna emits THz rays, which can be focused on the tested material using lenses or the mirrors. The reflected waves are acquired by a receiver antenna. The measured signals are presented in the form of: A-scan, B-scan, C-scan or D-scan. The A-scan is a time domain signal measured at a single position of the transducer S (x = const, y = const, t d). The B-scan is a set of A-scans collected during 1-D scan of the sample S (x, y = const, t d). Signals collected during a 2-D scan of the samples allow to create images (C-scans) S (x , y, t d = const) or a 3-D presentations (D-scans) S (x , y, t d). The TDS-THz systems in a reflection mode can work in two basic configurations. The first type of configuration (Fig. 2) with a receiver and transmitter mounted separately (v-type) at a right angle (140 deg.) and a second configuration (collinear), which includes an additional THz beam splitter (Fig. 3). These arrangements have some advantages and disadvantages and therefore, all experiments were carried out using both configurations.
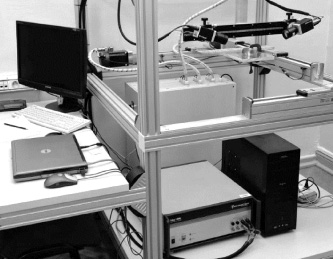
Photo of the terahertz time domain spectroscopy system.
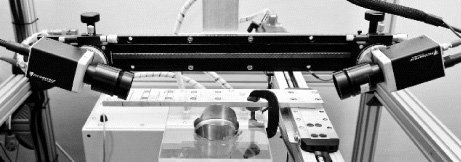
Transmitting and receiving heads over the sample located in the center.

Measurement setups of the THz-TDS system used in the experiments: left – colinear arrangement of the measuring heads; right – separate heads with aligned with proper angle.
Sample in the form of metal cylindrical vessel filled with oil were utilized in the experiments. The sample is shown in Fig. 4. The layer of oil was utilized instead of other type of coatings due to simplicity of the thickness changes. The transformer oil was utilized for this purpose due to well-known electrical parameters, high purity and stability. The thickness of the oil layer was changed by adding a constant volume (0.25 ml) of the oil. Adding this amount of oil caused an increase in the liquid column by over 60 μm. The only problem was observed in the case of the thinnest oil film due to the necrosis of the bottom of the vessel. This disadvantage is reduced by adding some oil at the beginning of the filling process.
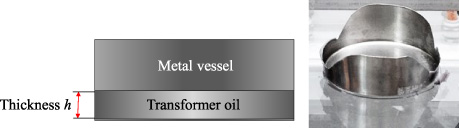
View and photo of the sample used for the experiments. Thickness of the “oil coating” h was equal to: 0, 30 μm, 60 μm, 120 μm, 200 μm, … 2 mm.
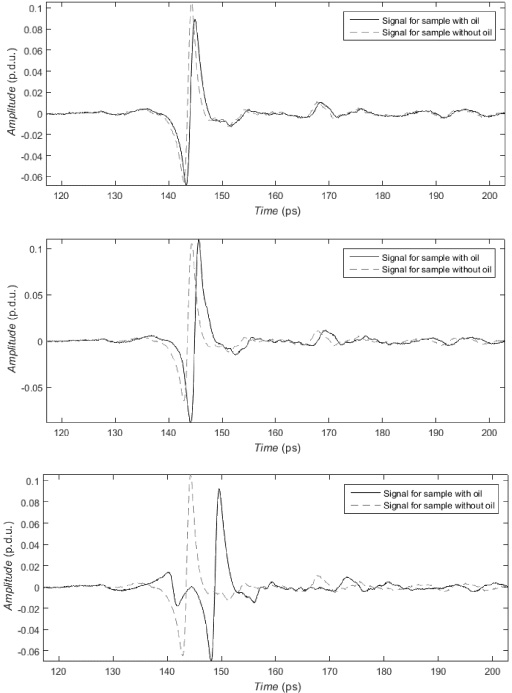
Plots of the raw signals measured in case of the v-type configuration. Thickness of the “oil coating” h was respectively equal to: 60 μm, 120 μm and 1000 μm.
Figure 5 shows selected results of measurements achieved using the transmitter and receiver positioned at the angle equal to 160 deg. Only a few cases were chosen due to similarity between the signals. One can observe that the THz method has limited resolution and the signal component corresponding to the reflection from the thin coating is nearly invisible. Therefore, a method for estimation of coating’s respond was proposed. A signal corresponding to the reflection from the clean metal surface was utilized as an input signal. The reference signal was achieved by processing the input signal by an adaptive LMS IIR [4] filter supplemented by an additional delay element (Fig. 6).
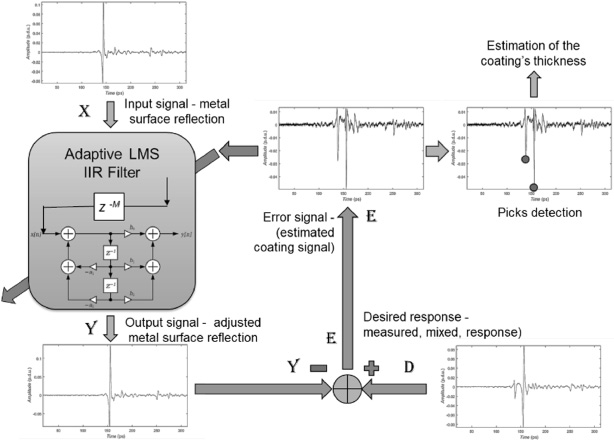
Block scheme of the coating thickness estimation algorithm.

Plots of the signals representing estimated response from the “oil coating” in case of the v-type configuration. Thickness of the “coating” h was respectively equal to: 60 μm (2), 120 μm (3) and 1000 μm (18).
The order of delay and IIR filter coefficients were calculated by finding the values that relate to producing the least mean square of the error signal (difference between the desired and the actual signal). In this case the desired signal is a signal corresponding to the reflection from the metal surface under the coating, while the error signal corresponds to reflection from the coating. The process of iteration was very quick and the resulting signals are shown in Fig. 7. The thickness of the coating was estimated by locating the picks of the signals. This procedure was applied to all measured signals for different thickness of the coating and both configurations of the measuring heads (colinear and v-type). Finally, as a result of all calculations, two calibration curves were achieved (Figs 8 and 9).
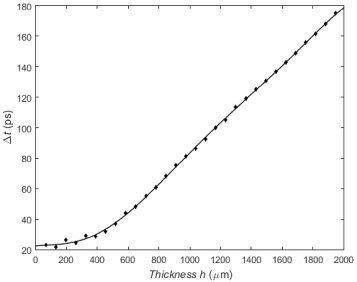
Calibration curve obtained for the system in v-type configuration.

Calibration curve obtained for the system in the colinear configuration.
The achieved calibration curves can be utilized to estimate thickness of the oil layer or the coatings. The achieved characteristics are not completely linear for the entire range of thicknesses (from 30 μm up to 2 mm) but for limited changes they can be linearized.
This work shows that, the terahertz method can be used for the assessment of non-conductive coatings. The testing method is still under research but already has some advantages over other NDT methods. The THz imaging technology seems to be very promising for identifying and evaluating various non-conductive structures, however additional progress in scanning speed as well as additional data processing is necessary to implement the THz as the reliable and effective tool. The system, which was used in the measurements enables to measure thickness of the layer in an individual location within time less than 100 ms. In case of 2D scans the time of measurements can be shortened by using a line scanner.