
Abstract
The purpose of this study is to characterize the features of magnetic flux density perturbation as a result of the variation of conductivity in an equivalent model of the stress-corrosion crack (SCC). By using numerical computation of A-𝜙 method, the magnetic field nearby the inspection target was simulated for an eddy current probe of large rectangular excitation coil and a conductor plate with a modeled SCC. A conductive notch was set in the center of the conductor plate as an equivalent crack model of a real SCC. Different conductivities and crack depths were varied into the equivalent SCC model for analyzing their influences to the distribution of magnetic flux density perturbation above the model plate. Numerical results showed that the distributions of magnetic flux density were suitable to distinguish the difference of the conductivities of the SCC between 0% and 20% of the base material for normal testing frequencies. In addition, it was also found that the profile of distributed conductivity along the crack length can be better represented with the field induced by the excitation current laterally to the crack length.
Introduction
Modeling of the stress corrosion crack (SCC) is important to obtain reliable reconstruction and evaluation results from eddy current testing (ECT) signals. SCC has been identified that it behaves like a conductive slit in perspective of the ECT [1]. Therefore, precise reconstruction of crack profile depends on a suitable equivalent conductivity in the model. There are numbers of researches explored the uniform and local equivalent conductivities in different SCC regions by numerical simulations [2,3]. In addition, local conductivity in SCC region was more clearly determined as the linear distribution through the crack length and depth by using direct current potential drop techniques [4]. Those results were used to develop forward and inversion numerical models for ECT [5–7]. Most of the studies, however, gave details only the amplitude and phase of the ECT pickup signals from the utilized probes. At the present, several NDT researches conduct measurement of magnetic flux density, for profiling surface and subsurface flaws based on the ECT, pulse eddy current testing (PECT), magnetic flux leakage (MFL) and alternating current field measurement (ACFM) methods etc. [8,9]. However, characteristics of the magnetic flux density perturbation due to a conductive crack comparable to SCC has not been clarified.
In order to enhance SCC assessment with ECT technique, this work presents numerical results of the magnetic flux perturbation due to a modeled SCC induced by an ECT probe of uniform current excitation. Distribution profiles of magnetic flux density over the region of SCC of different conductivity were simulated and characterized. From the numerical results, it was found that the features of the magnetic flux perturbation are able to represent the variation of local conductivity in the SCC model. The results of this work give a good possibility to improve evaluation accuracy of SCC by using magnetic flux density in both the forward and inverse analyses.
Numerical modeling and simulation method
Modeling of SCC with equivalent conductivity
A 3D numerical model was developed based on a conductor plate of SUS316L stainless steel with the conductivity of 1.35 MS/m. Plate dimensions were set as 200 × 200 × 5 mm3 in width (W), length (L) and depth (D) respectively as shown in Fig. 1(a).
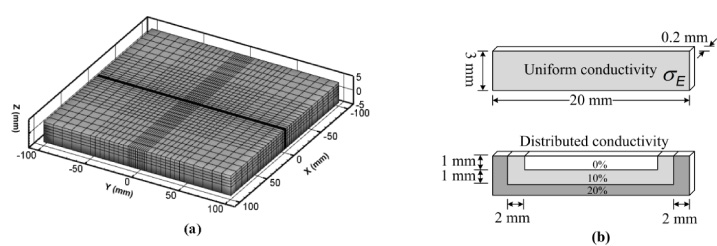
A 3D Model for numerical simulations. (a) Conductor plate with meshing, (b) equivalent SCC models.
The SCC is approximated as an equivalent crack model in shape of notch and of uniform conductivity, and was set symmetrically in the center of the conductor plate along the Y direction as illustrated in Fig. 1(a) with its dimensions of width, length, and depth being 0.2 mm, 20 mm and 3 mm respectively. The equivalent conductivity (σ E ) was varied into the equivalent crack model from 0% to 20% of the base material conductivity as shown in Fig. 1(b).
The numerical code of FEM-BEM method based on
A rectangular excitation coil with dimensions as illustrated in Fig. 2 was utilized to induce the near uniform eddy current into the conductor plate for analysis of magnetic flux perturbation nearby the plate. The number of turns of the coil was set to 1,000 with the total excitation current of 0.5 A. The excitation coil was discretized into 10 × 10 current filaments of rectangular shape to calculate the source magnetic field. The coil was placed symmetrically at the center of the plate with 4 mm of liftoff distance. The testing frequencies were selected as 50 kHz, 100 kHz, and 300 kHz for studying the skin effect for different equivalent conductivities.
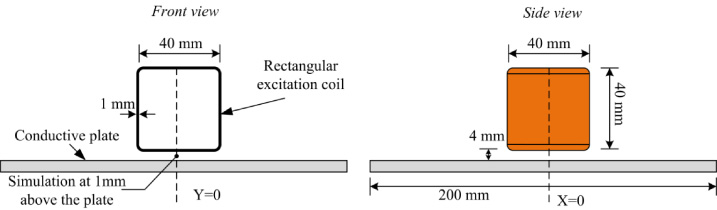
Rectangle coil with its dimensions and location for inducing uniform current.
Validation of the numerical code
The validity of the conventional FEM-BEM hybrid code for ECT simulation has been demonstrated by a long term of application and comparison with the measured signals. To verify our updated FEM-BEM code for magnetic flux density simulation, commercial FEM software, Ansys R14.5, was also utilized for comparison. The magnetic flux density distributions at scanning lines 1 mm above the conductor upper surface were calculated by using the both codes for unflawed conductor plate, and excitation coil inducing eddy current normal to and parallel to the flaw direction respectively.
Numerical results of magnetic flux density components (B X , B Y and B Z ) were calculated and shown in Fig. 3 for three scanning lines along the Y direction (referred to Fig. 1(a)) i.e. at the center X = 0, the left side, and the right side where the peaks of the B X component occurs. Good agreements between the results of the updated FEM-BEM code and Ansys for all of the 3 components can be found. The profiles of simulated magnetic field by using both methods show similar patterns in all cases. In addition, the maximum relative differences obtained the two results were less than 3.19%, 3.13% and 9.77% for B X , B Y and B Z components respectively, which proved the validity of our updated FEM-BEM numerical code.
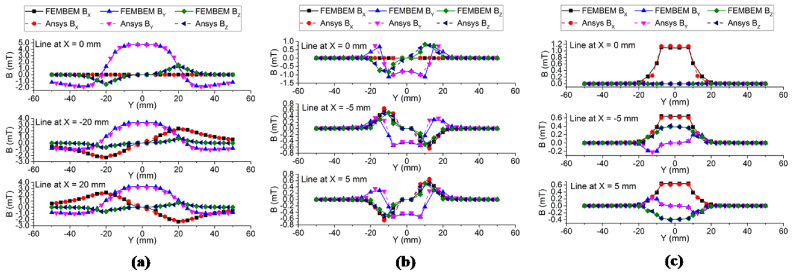
Comparison of B X , B Y and B Z distributions between FEM-BEM and Ansys (a) unflawed condition, (b) inducing excitation current normal to the flaw, (c) inducing excitation current parallel to the flaw.
As a key to distinguish the variation of conductivity in the equivalent SCC model by using the distribution of magnetic flux density perturbation, the uniformity of magnetic field induced by the eddy current is of great importance. For this purpose, profiles of magnetic flux densities (B X , B Y and B Z ) at a plane 4 mm over the top surface of the unflawed conductor plate were computed as shown in Fig. 4(a), (b) and (c). The numerical results show that B Y component, which is normal to the direction of the major excitation current, gives larger amplitude than the B X and B Z component. Moreover, the B Y mainly concentrates in the central region (20 × 20 mm2) of the plate. On the other hand, B X and B Z are relatively small compared to the B Y component in the center region of the conductor plate.
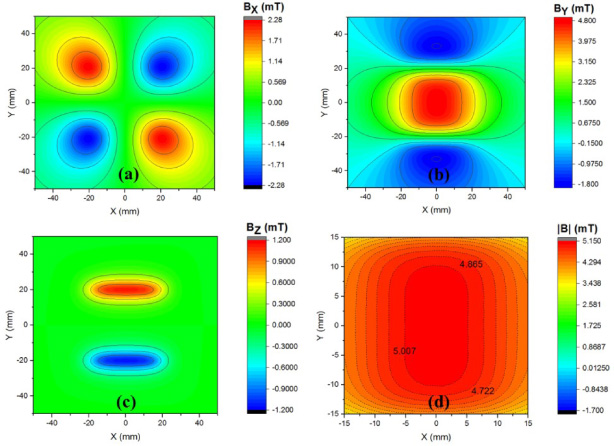
Distribution of (a) B X , (b) B Y , (c) B Z , and (d) uniform area of the absolute total B.
The uniformity of total magnetic flux density |B| was particularly analyzed in the central zone of the plate. The results are illustrated in Fig. 4(d). The relative uniform region of the absolute total magnetic flux density covers the area of 20 × 10 mm2 with a variation of 1.1% compared with the absolute value of the magnetic flux density at the center (0, 0) point of the plate.
Therefore, the magnetic flux density in this region is highly sensitive in view to distinguish the conductivity changing of the equivalent SCC model, which will be located at the center of the plate.
Magnetic flux distribution due to SCC model perpendicular to the excitation current
By setting the equivalent SCC models at the center of the plate with its length perpendicular to the excitation current, the numerical results of magnetic flux perturbation due to crack at a plane 1 mm above the conductor plate surface were calculated. Components of B X , B Y and B Z above the SCC regions have the distributions as shown in Fig. 5. The B Z has the highest amplitude at 1.035 mT and concentrates around the edges of SCC. The B X and B Z components can be used to indicate the length of SCC clearly. On the other hand, the profile of B Y distributes through the length of the SCC region.
The results in Fig. 6 reveal the normalized amplitudes of B X , B Y and B Z with the values of zero conductivity in order to characterize the effect of the uniform conductivity changing in the SCC region. Amplitude decreases for all of 3 components in the exponential pattern were indicated when increasing the conductivity for all of the testing frequencies. The B Y component tend to rise amplitude higher than the B X , and B Z when the test frequency is increased.
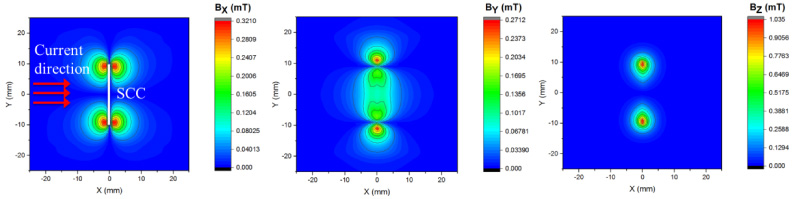
Distribution of B X , B Y and B Z due to SCC perpendicular to the excitation current.
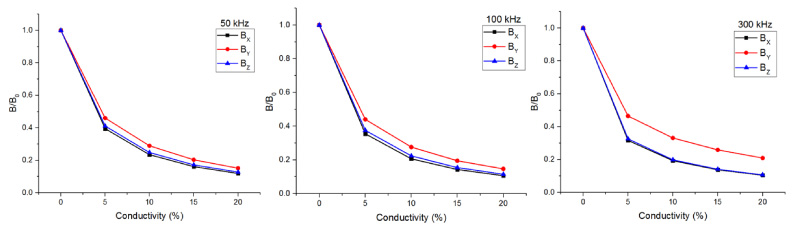
Normalized amplitude (B∕B 0) of B X , B Y and B Z as a result of changing conductivity and test frequency.
As presented in Fig. 7, the numerical results of B X , B Y and B Z distributions were obtained from the equivalent SCC model setting laterally to the excitation current. Especially, the profile of the B X component seems to fit with the equivalent SCC dimensions. It also provides the highest amplitude at 0.11 mT compared to the B Y and B Z components. However, the amplitudes of these results are lower than the amplitude of excitation current perpendicular to the SCC direction, i.e., the uniformly induced eddy current is of less perturbation in the parallel case. Focusing on the effect of the conductivity changing, results of the normalized amplitudes of magnetic flux density are shown in Fig. 8.
All of B X , B Y and B Z components gave a similar decreasing trend for testing frequency of 50 kHz, 100 kHz, and 300 kHz respectively. Linearity achieved by R-square are also higher than 0.99.

Distribution of B X , B Y and B Z due to SCC parallel to the excitation current.
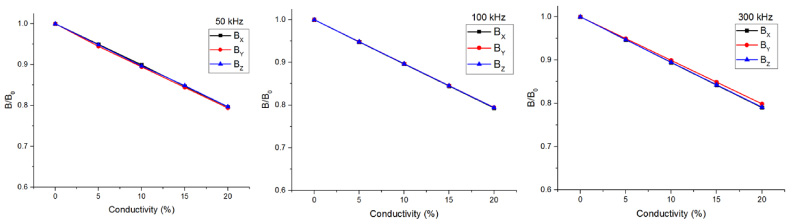
Normalized amplitude (B∕B 0) of B X , B Y and B Z in linear tendency due to changing conductivity and test frequency.
From previous results, it is known that the amplitude of magnetic flux density is an important feature parameter to characterize the equivalent conductivity in SCC models. In order to distinguish the influences of crack depth and the conductivity variation, Fig. 9 shows the amplitude comparison of magnetic flux density against the different SCC depths and conductivities. The results of B Y component obtained from the excitation current perpendicular to the SCC was chosen to be an example as represented in Fig. 9(a). The B Y amplitudes tend to rise up related to the SCC depths. Therefore, this component has a beneficial for sizing SCC depth. Unfortunately, the SCC exhibits as a conductive crack. At the same SCC depth, increasing equivalent conductivity in the SCC region reduces the amplitude of the B Y . This characteristic is difficult to evaluate the changing conductivity in SCC of different depths. On the other hand, as seen in Fig. 9(b), the results of B X component, which is obtained from the excitation current parallel to the SCC direction, significantly respond to the variation of conductivity. It is also barely affected by the SCC depths. Therefore, the B X component is more suitable to quantify the equivalent conductivity in SCC region through inverse analysis.
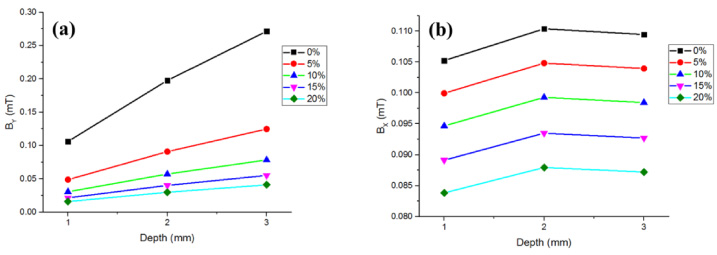
Magnetic flux density due to the different depths and conductivities (a) B Y component obtained from the excitation current perpendicular to the SCC, (b) B X component, obtained from the excitation current parallel to the SCC.
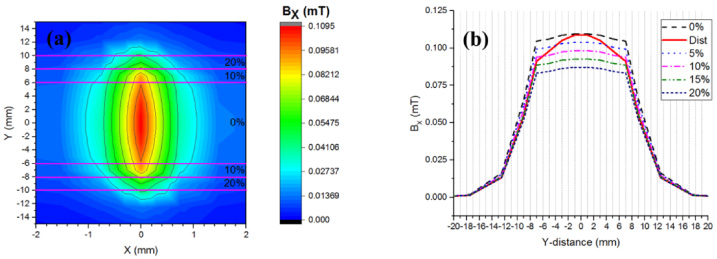
Representation of distributed conductivity in the SCC model (a) profile of the B X , (b) distribute conductivity compared to the uniform conductivity.
Distributed conductivity model referred from Fig. 1(b) was used to compute the B X distribution by exciting current parallel to the SCC orientation. The results in Fig. 10(a) reveal that the B X profile gives details of the distributed conductivity for a given model. The magnetic field profiles of higher conductivities locate around the edge of SCC, while those of the lower conductivity gradually decreases to the center of the SCC region. The distributions of B X over the length of the SCC are compared in Fig. 10(b) for various uniform conductivities. The results of B X provide a good agreement with the distributed conductivity model, which can be contributed to characterize the conductivity in the SCC region by measuring the magnetic flux density distribution above the conductor plate.
Conclusion
This work was done to analyze the characteristics of magnetic flux density perturbation due to an equivalent SCC model of different conductivities by using the FEM-BEM hybrid numerical code of
Footnotes
Acknowledgements
The authors would like to thank the National Key Research and Development Program of China (No. 2017YFF0209703), National Science Foundation of China (No. 51577139, 51407132, and 51807145) and China Postdoctoral Science Foundation No. 2018M631156 for funding this study.