
Abstract
Stainless steels are an important class of alloys, and are already used in a broad range of applications, especially used as electronic information materials. To take advantage of their magnetic characteristics, many fundamental magnetic problems involving stainless steels must be further studied. In this paper, magnetic measuring of ferrite stainless steels are conducted using the ring samples and bar samples in different magnetic fields, which are both frequently used in industry for quality control. From the magnetic parameters obtained from the major loops of both samples, such as Br, Hc, μ r , Js and H μmax , large differences were found, revealing that, in ferrite stainless steel two kinds of samples can get quite a different result. The reasons are discussed. Furthermore, the benefits of both kinds of samples are discussed in terms of sample dimensions, anisotropy, demagnetization field, and inclusions. Moreover, the typical magnetic data obtained from the major and minor hysteresis loops are also discussed.
Keywords
Introduction
It is beyond question that stainless steels are an important class of alloys due to their excellent corrosion resistance and combined properties, which can be revealed in the plentiful applications that rely on their unique properties. Stainless steels can be used both as structural and functional materials, and can also offer a combination of these two properties in the forms of coils, sheets, plates, bars and wire, etc. The mechanical property of stainless steel has been extensively studied for many years, and stainless steel has been widely used in many fields, from low-end applications like household cooking utensils, furniture and industrial applications, to very sophisticated fields such as space vehicles [1]. Furthermore, ferritic and martensitic stainless steels can be good soft magnetic materials with high relative permeability μ r , low coercivity Hc, and high saturation magnetization Ms [2], and in many applications their magnetic properties must be controlled for certain applications. These steels also have high electrical resistivity, typically 70 μΩ⋅ cm at room temperature, which is essential to minimize eddy current losses in AC applications [2]. Furthermore, a rapid response can be obtained from the AC application. The combination of these properties has meant that ferritic and martensitic stainless steels can be used as electronic information materials in a broad range of magnetic applications [2–5].
The most widely recognized soft magnetic materials are materials with very high μ r values, even as high as 106. Thus, commonly, ferritic stainless steel is not regarded as soft magnetic materials, as their μ r is only in the order of 103. But once they are used in corrosive conditions, stainless steel may have irreplaceable function when used as soft magnetic materials. Relays and actuators play an increasingly important role in automotive and aerospace technology [6], suggesting that magnetic properties of stainless steel will become even more important than ever.
Soft magnetic ferritic stainless steels must function perfectly in a wide variety of corrosive environments, in which traditional soft magnetic materials cannot be used. They also play an important role to the performance of many electromechanical devices, for which they must provide optimized magnetic properties together with good mechanical property to enable proper output and response time, such as those devices in the automobiles including fuel injectors, fuel pumps, and solenoids for antilock braking systems. They are also critical for industrial solenoids and pumps that control the flow of corrosive fluids, and for many types of cores, armatures, relays, motors, generators; and valves that regulate the flow of corrosive chemicals. So, they must retain the right balance between the essential properties such as Js, μ r , Hc, mechanical property, corrosion resistance, and electrical resistivity, etc. Furthermore, for proper application and to realize the control function precisely, in addition to an accurate measurement of their magnetic property, the meaning of the magnetic terminologies must be well understood.
Furthermore, there are many fundamental problems involving magnetic measurements of stainless steels, which need to be further studied, including sample geometry, measuring methods, etc. To our knowledge, no direct studies of the differences in magnetic properties between ring sample and round rod have been made.
Despite the usefulness of ferritic and martensitic stainless steels in magnetic applications, there have been only limited studies of the magnetic property of these steels [2]. Moreover, the problem of correlation between magnetic properties with composition, heat treatment and microstructure still remain, even though there has been considerable progress in understanding some of the mechanisms involved [7]. Most studies have used stainless steels heat-treated after purchased from the manufacturers [2,4,8–10]. Measurements of Hc and maximum permeability μmax of selected fully annealed stainless steels at room temperature are also reported in the ASM Handbook published nearly 25 years ago [11], but there are still many problems left.
Magnetic measuring is very important both to quality control and to the development of new materials. In addition, nowadays quality management systems increasingly require measurements to be traceable to both written and physical standards [12]. It is well-known that the hysteresis measurements have been used to investigate the ferromagnetic materials for more than 150 years, during which several international standard techniques (IEC, ASTM) were introduced in practice. The great advantage of the hysteresis measurement is that the measured signal is simply proportional to the change rate of the magnetic induction [13–15]. This signal is also much higher, less noisy, and therefore easier for further interpretation than the other methods such as Barkhausen noise method [16].
The purpose of the presented work is intended to compare the magnetic properties of ferritic stainless steels measured using bar and ring samples. The big differences obtained will draw people’s attention to the magnetic property of stainless steel. Traditionally, the magnetic property of stainless steels is not introduced in textbooks, so many people are not familiar with their magnetic properties. As far as we know, though the magnetic property of stainless steels has been studied for many years, the knowledge is all scattered among literature. As the magnetic property of stainless steel is becoming more and more important both in research and application point of view, we hope that it could be of interest not only for researchers actively working with stainless steel, but also for those peripheral to magnetism. The aim of this paper is also to draw attention to the problem of hysteresis loops and to present some objective criteria to determine whether a hysteresis loop is actually a major one.
We first measured the magnetic property of magnetic ferrite stainless steels with bar and toroidal samples in the annealed condition. The magnetic properties deduced are the maximum permeability (μmax), the coercive force (Hc), the saturation polarization (Js), and the residual magnetic flux density (Br) at different magnetic fields in round rod form and ring shape specimen. Finally, the differences of the magnetic properties between two kinds of samples are compared and discussed in detail.
Experimental
Sample preparation
The material for the present study is Fe-17Cr ferrite stainless steel. The chemical composition of the steel in our experiments is summarized in Table 1.
Chemical composition (wt%) of the studied Fe-17Cr ferrite stainless steel
Chemical composition (wt%) of the studied Fe-17Cr ferrite stainless steel
The steel had been industrially produced at KangJian Precision Stainless Steel Co. Ltd. The steel was processed by vacuum melting, followed by casting. After the steel ingot was forged and rolled, it was cold-drawn and straightened. Then it was fully annealed at high temperatures for corresponding duration followed by cooling in air, aiming at sufficient re-crystallization to form fine annealing microstructure. Finally, it was polished to form a round bar with a final diameter of 10 mm.
For magnetic measuring, the samples are carefully prepared according to IEC and ASTM standards (IEC 60404-4, ASTM A341/A341M). To obtain the magnetic properties, the magnetization curve and hysteresis loops are determined both by the so-called ring core method and the permeameter method according to IEC 60404-4, thus two series of ferritic stainless steel specimens for magnetic measuring are made all from the product in the fully annealed condition. Bar specimens of 100 mm length were directly cut from the product. Toroidal samples were made in the following procedures: after an 8 mm long bar was cut from the rods perpendicularly to bar-shaped samples, the hole in the sample was machined by an electric discharge machine to form a toroidal shape, which has a considerably smaller influence on the magnetic properties of the samples than mechanical cutting.
The ring-shaped sample was 8 mm long with an outside diameter of 10 mm and an inside diameter of 8 mm for an outside-to-inside diameter ratio of 1.25. Then first a 24-turn detecting (pick-up) coil, and then a 120-turn magnetizing (exciting) coil were each wound directly around their bodies, uniformly along the whole circumference. Double-insulated 18 AWG magnet wire was used for the primary winding; double insulated 28 AWG magnet wire was used for the secondary winding.
The measurements of the DC magnetic properties of the rings and of the bar-shaped samples were performed with the measuring system Permagraph–Remagraph Combination C-750 made by Magnet-Physik Dr. Steingroever GmbH of Germany. The whole system is fully automated. This is a magnetically closed circuit measuring system free from the demagnetization effect, so all information needed to conduct the measurements is determined by the program except the dimension of the sample and the number of primary and secondary turns of the coils. The measurements were all fulfilled in the quasi-static conditions. The quasi-static measurement allows obtaining the magnetic material properties independent from measuring speed. In this paper, the peak value of the DC magnetic field H can be as high as 56 kA/m in the permeameter method, and 20 kA/m in ring core method. The details about the set-up of the measuring systems used in this study can be found in [17].
It is well-known that the accuracy of the results greatly relies on the accurate setting of magnetic flux in the samples. This, in turn, requires an accurate measurement of cross-sectional areas or thicknesses of the samples if their diameter can be accurately obtained. Diameters of the round samples and heights of ring samples are measured precisely using a spiral micrometer with a resolution of 0.01 mm, outer and inner diameters of the ring samples were precisely measured using a vernier micrometer of 0.02 mm in resolution, and the lengths of bar samples are measured using a ruler with a resolution of 0.5 mm.
Though the magnetic property of ferrite stainless steel is not very sensitive to the temperature due to its high Curie temperature, to avoid the influence of temperature change, experiments were done at room temperature of about 23 °C, and the sample temperature is maintained at 23 ± 1 °C. Prior to taking each measurement each ring sample and bar sample together with the permeameter were demagnetized by slowly reducing the magnetizing field to zero.
For the ring sample method, the dimensions of the ring are determined first. Then, and a secondary winding of enough turns are applied, and connected to a flux sensing devices. Finally, a magnetizing winding (the primary coil) with enough turns and current carrying capacity is wound on the sample. The flux sensing device can produce an output voltage to calculate B. Also, a voltage developed across a calibrated low-value resistor in the magnetizing circuit can be used to measure the magnetic field H produced. For the bar sample method, the bar specimen was conducted in a closed magnetic configuration, and H is measured by a C-shaped Rogowski-Chattock potentiometer. The bar sample is clamped in the yoke with a J-coil and a potential coil to measure J and H signals. For automated measuring systems, these two signals can be sampled by computer to give the desired result.
The DC magnetic measuring procedure for the soft magnetic property was to determine both the initial magnetization curve and hysteresis loop (in the four-quadrant) to saturation or to a specified maximum magnetic field strength H max. Then, μ r –H curve can also be obtained. In the automatic, computer-controlled measuring system we used, the field strength for the ring sample was calculated from the measured DC magnetizing current flowing through the magnetizing winding and the effective magnetic path length; and for bar sample, H is measured by a c-shaped magnetic potential coil. J of the bar sample was measured by a J-coil, and for the ring sample, J was calculated from the electromagnetic induction law together with the cross-sectional area and turns of the secondary winding coil.
The ring and the bar samples were measured with a near quasi-static speed (controlled dB/dt or dH/dt) to ensure the data obtained are DC properties. In a quasi-static measuring, it is often thought that only the level of the magnetic field or magnetization should be controlled, instead of the sweeping speed, but in most of the computer-controlled automatic measuring systems, the measuring speed needs to be controlled to get DC properties of the material. Also, for various materials, different measuring time should be chosen. In addition, the specimen is demagnetized prior to each measurement. Periodically the specimens were re-measured several times to ensure that no damage or time-dependent magnetic property changes had occurred. After each measurement, the specific data required for the material were: μ i , μmax, Br, Hc, J max and also the very important value for application H μmax : field where μ r got its maximum μmax.
Result and discussion
J-H curve, B-H curve and μ r -H curve
As we have known, although M and J are constant after saturation is achieved, B will continues to increase with H, because H forms part of B [18,19], as:
Thus, we can get Js or Ms value (J or M is almost constant after saturation is achieved) from J-H and M-H curves, but Bs is not a typical value in magnetization curve, and cannot be obtained directly.
Figure 1 is J-H, B-H and μ r -H curve of ferrite stainless steel measured in a bar sample, including both the magnetization curves and hysteresis loops. Inset is the enlarged figure. From Fig. 1, we can clearly see that B is not saturated (B is still increasing) even in the field up to 50 kA/m. In lower H, B and J have little difference, but when H is as high as 10 kA/m, the difference between B and J can be clearly seen. As μ0 = 4π ×10−7 H/m, when H is 10 kA/m, the difference between B and J will be μ0 H = 0.01257 T. For permanent magnetic material, the difference will become even higher as H will become bigger [19]. Also can be seen from Fig. 1 that, μ r -H curve has a maximum, called μmax, the field where μ r gets its maximum value μmax is called H μmax , these two parameters are very important for soft magnetic material applications.

J-H, B-H and μ r -H curve of ferrite stainless steel measured in a bar sample.
For soft magnetic material, as the difference between B-H and J-H curves (including magnetization curve and hysteresis loop) is small, the difference between H cJ and H cB is usually negligible, as can be seen in the inset in Fig. 1, they are usually called Hc instead, regardless of H cJ and H cB . So in this paper, they are all called Hc. But the difference may be substantial for permanent magnet materials [18].
A set of minor loops with various field H amplitudes up to 56 kA/m were measured by the permeameter method using a bar sample, as can be seen from Fig. 2. The curves show only some of the field levels to avoid too crowded graphs. They are all tested in a demagnetized state. The speed of measuring is controlled by dB/dt. In order to show the details of the loops, the same figure was also shown on different scales. In the case of a demagnetized initial state, J-H loop starts to develop from around the origin and each J-H loop with a different H max shows a symmetrical loop, which is centered at the origin as shown in Fig. 2a to Fig. 2d. Furthermore, as can be seen from Fig. 2a to Fig. 2d, when Hmax is small, the different loop will have different J m , Hc and Br value.
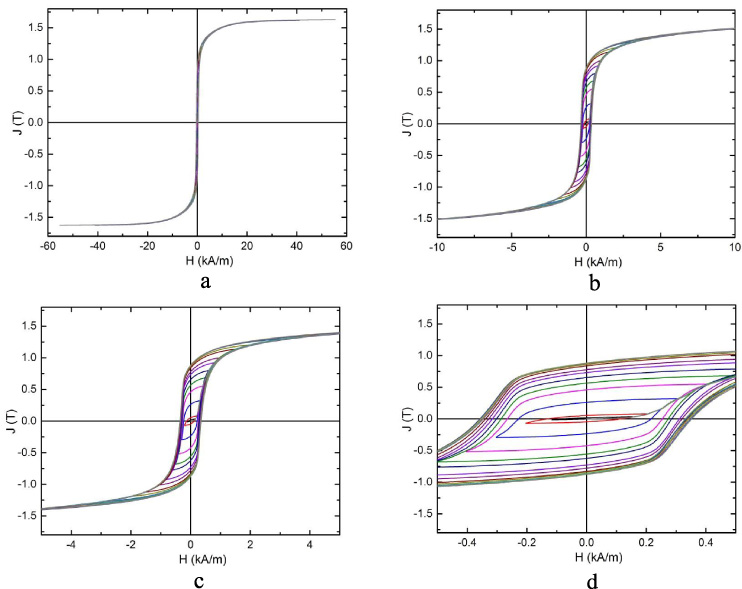
Magnetization and hysteresis loops at different Hmax for bar sample.
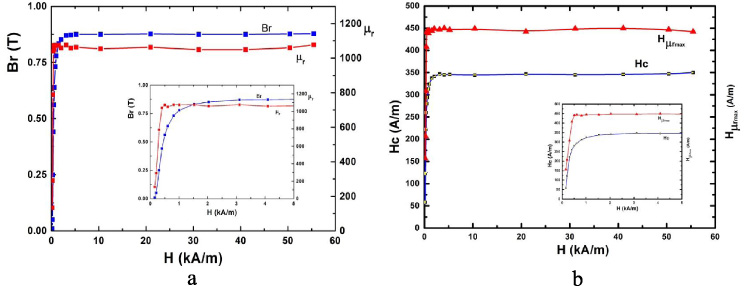
A graphical resume of the evolution of the magnetic properties extracted from these hysteresis loops (Br, Hc, μ r , and H μmax ) with H were shown in Fig. 3. The details of each figure in the lower magnetic field area were also shown in the inset figures. From these figures we can see that these values will increase with H value, and will get a maximum, and then will keep unchanged when H is further increased, showing saturation characteristic. To get μ r and H μmax values, field of 2Hc will high enough; but for Br and Hc values, especially for Js value, H needed is more higher to get a stable value. Overall, if H is higher than approximately 8--10 Hc, these values will keep unchanged.
Changes of Br, Hc,
Moreover, if we draw the normal magnetization curve with the data Jm-H, where Jm values are the maximum J value obtained in each H max , we can see that it is just the initial magnetization curve. As shown in Fig. 4, the initial magnetization curve and normal magnetization curve are practically the same curves, though they have different physical meanings. Moreover, Barkhausen Jumps will only exist in initial magnetization curves and do not exist in normal magnetization curves, because normal curves are connections of the tips of each hysteresis loops, and initial magnetization curves are continuous magnetized curves. In addition, the superposition of the two curves also indicates that the effect of demagnetization before each measurement is quite effective.

Difference between normal and initial magnetization curve for bar sample.
A series of loops were also measured using a ring sample, as can be seen from Fig. 5, the details of the loops were also shown with magnifying the coercive force region in different scales. Minor hysteresis loops with various magnetic field amplitude Hmax up to 20 kA/m were measured by changing Hmax step by step. Before measuring each minor loop, the samples were also demagnetized. As can be seen from Fig. 5, when Hmax is small, the different loop will also have different Jm, Hc, and Br value, the situation is just the same as the bar sample. Furthermore, the magnetization curve, the major hysteresis loop and μ r –H curve were also shown, as can be seen in Fig. 6. It is clearly shown the features of these curves of the ring sample are just the same as those that can be found in the figures of the bar sample (from Fig. 1 to Fig. 4).

Magnetization and hysteresis loops at different Hmax for ring sample.

J-H and μ r -H curve of the ring sample.
From these measurements, we found that though the curves of the bar sample and the ring sample are the same in shape, we can get totally different values in the major loops. For comparison, the major loops of both samples are put together, as shown in Fig. 7. The difference between the two kinds of samples can be clearly seen in Fig. 7. Also, from relations between minor-loop parameters, magnetic properties being independent of magnetic field amplitude were obtained and compared (that is from the major loops of the bar sample and the ring sample), the obtained parameters are listed in Table 2.

Difference between bar and ring samples.
Comparison of ring and bar samples
From Fig. 7 and Table 2, we can see that, though bar and ring samples are all cut from the same materials, different shaped samples can obtain quite different results. In addition, Br, μ r and Js values obtained from the ring sample are smaller than that of the bar sample, whereas Hc and H μmax values are larger than that of the bar sample. Of course, H max for the two samples are different. As mentioned above, for the ring sample, due to limited space for the magnetizing coil, in our experiments Hmax can only reach 20 kA/m, whereas for the bar sample H max is as high as 56 kA/m. Because for the ring samples, the saturation can be achieved at magnetic fields larger than ∼10 kA/m, so loop obtained with H max = 20 kA/m is the major loop, and thus the parameters listed in Table 2 for both samples are all saturation values. Thus the differences that can be seen in Fig. 7 and listed in Table 2 are attractive. For the same product, using bar samples and ring samples, different values of Br, Hc, H μmax and μ r are obtained. Furthermore, Js values are also different. Ring sample has larger Hc value, thus lower μ r value, but smaller Js value.
Bar and ring samples can all be used to evaluate the magnetic property of soft ferritic stainless steel. Furthermore, these two methods are also widely used in applications. In practice, for the same material, there exist noticeable differences between measured magnetic properties of ring samples and bar samples, making the problem obviously more complicated. For bar and ring samples, their minor and major loops and also magnetization curves are all different. Thus, different Br, Hc, Js, μ max values can be obtained.
The magnetic measurements were all performed at room temperature. Moreover, the influence of temperature on the magnetic property of ferrite stainless steels can be negligible. Furthermore, compared with other soft magnetic alloys, stainless steels have higher resistivity, thus measuring speed will have little influence on measuring results. As a result, these differences should be aroused by other reasons.
In addition, the measurements of the minor and major loops and magnetization curves of bar and ring samples show that the details of sets of loops can be clearly seen, showing that the measuring error is very small, and the repeatability and accuracy of measuring are high enough.
In order to reduce the effect of self-demagnetization, international standards require bars for coercivity measurement to have a length-to-diameter ratio L/D of at least 10:1 [6], also the length needed in IEC 60404-4 for permeameter methods is 100 mm or longer [15].
The influences of the samples (such as length to diameter ratio L/D) on the measured magnetic properties of permanent magnetic materials have been studied in recent years [20,21], but few works has been found on soft magnetic materials. A recent study found that further study is necessary for the permeameter methods, since the performance of permeameter is the sample size and property dependent, at least in the high-H region [22].
In fact, as mentioned above, on account of non-uniformity of the magnetic field H in the sample itself, when the recommended sample is a toroidal sample, just as described in the IEC Standard 60404-4 [15], the ratio of external to internal radius r
o
∕r
i
should not exceeding 1.4, but the suggested value is smaller than 1.25. If the ratio approaches the value 1.4, there will be a greater radial variation in the magnetic field strength. Only when the condition r
o
∕r
i
<1.4 [15] or even preferably <1.1 has been fulfilled [23], the mean length of the magnetic path is determined as
If this ratio is between 1.1 < r
o
∕r
i
<1.6 [23], the mean length of magnetic path can be determined as
The ratio r o ∕r i higher than 1.6 is not recommended due to significant magnetic field non-uniformity occurred in the sample. Thus it is clear that the ring sample should have a large inner diameter and large strip width (ring height). In our measuring, l is calculated by Eq. (3), and we have found that using Eq. (2) and Eq. (3), there is little influence on the result of our samples.
For bar and ring samples, the only difference in microstructure may be internal stress aroused by sample preparation, as the ring sample is made from the bar. As far as we know that, ferrite stainless steel is not easy to work harden, so mechanical machining can have little influence on the performance of the material, including magnetic properties. Furthermore, in the preparation of ring samples, the material is handled very carefully, and great care is taken to prevent internal stress, heat affected zone and work harden. In addition, circumferential direction wire electrical discharge machining was used to prepare the ring samples to avoid internal stress. Even if the magnetic property of ring samples is changed, Js value will not change because of its structural insensitivity nature.
As we have known, basically, the magnetic property of stainless steel is determined more by their crystal structures than by their compositions. Furthermore, grain orientation is also very crucial to magnetic anisotropy, because this can lead to anisotropy in properties. There are several kinds of anisotropy [7,18,24,25], such as crystal anisotropy (formally called magnetocrystalline anisotropy), shape anisotropy, stress anisotropy, induced Anisotropy, and exchange anisotropy. Texture (preferred grain orientation) can also influence the magnetic properties. It has also been found that texture control will make a significant contribution to improve power density and reduce copper losses in induction motors (Fe-Si) due to the improvement of μ r together with reducing iron loss [26]. In the materials studied in this paper, perhaps the results can partly be explained in terms of the combined influences of two main anisotropies, namely shape anisotropy and the anisotropy determined by the texture.
It is found that if a suitable metallic alloy is undergone cold rolling, the internal stress produced within the material will align the individual crystal, i.e. by a so-called texture effect [27]. Because many of its preparations require the process of drawing, forging, pulling, rolling after wrought, and because ferrite stainless steel is a composite material, then, this can lead to the development of texture, elongated grains, and directional order. Thus, the material will have strong anisotropic features in the mechanical, magnetic, and other properties. As the anisotropic effect has been found in the mechanical property, the magnetic anisotropic effect must exist in stainless steel straight bars. The detailed analysis will be published later.
The distinguishing feature of the columnar crystal is internal shape anisotropy, which will also influence the magnetic property in different directions. In ring and bar samples, the magnetic field is in different directions: for bar samples, the magnetic field is in the longitudinal (or axial) direction, whereas for ring samples, H is applied around the axial direction. So H direction in ring samples is in the perpendicular direction to the radial direction, or more accurately, in the tangential directions. The methods of fabrication bars of ferrite stainless steel can cause a kind of microstructure that many crystals have a non-random distribution of orientations, they are mostly aligned along the rolling direction, this is often referred to as preferred or special orientations, or textures. Also, the grains are isolated from each other by another small grain of carbide, just like magnetic powder cores [19]. Furthermore, each grain also has shape anisotropy, arising different demagnetizing forces in different directions. If the elongated 𝛼-grains are aligned in axial direction, then H direction is parallel to axial direction in bar samples and is perpendicular to axial direction in ring samples. Thus the magnetic differences in bar and ring samples can be regarded as the effect influenced by internal shape anisotropy of 𝛼-grains. Because in these two directions, the inner demagnetization field is different, the effective field the 𝛼-grains experienced in two samples are also different. When H
app
is applied, magnetic field the materials undergoes is H
in
, which can be calculated by the following equation [13,18,19,23–25]:
Though the measured difference between the ring samples and bar samples is bigger compared with the similar study in magnetic Barkhausen noise using both kinds of samples [28], the samples are all satisfied with IEC standard. That is to say, according to IEC, the samples all have reasonable sizes. In addition, this phenomenon has been found many times. Thus, the results are surely not the effect of the size deviation of both samples. Furthermore, all samples are carefully prepared, and the dimension of the samples has been measured every time before measuring.
As we have known, Br, Hc, H μmax and μ r are all structure-sensitive properties (extrinsic properties), which depend on the anisotropy and the nonlinearity, flux density, frequency, heat treatment, deformation, etc. [18,25]. In addition to shape anisotropy and texture, even that something may be changed during the sample preparation, Js will not change because Js is structure-insensitive property (intrinsic property), just like unique properties as magnetic moment per atom, saturation magnetization Ms, saturation magnetostriction 𝜆 s , Curie point Tc and to a certain extent anisotropy K1. For the same material, Js should be the same value, regardless of these changes.
Overall, for both kinds of samples, the demagnetizing field is zero, thus there is no need to compensate for the demagnetization field, as all of the magnetic flux is running through the specimen, in a closed-loop. From the above result, we can see that the sampling process is also very important because transverse, longitudinal (or axial), tangential and radial samples or measuring in different directions can achieve different results for the same material in the same measuring accuracy.
Perhaps the difference is due to the improvement of the production process these years, resulting in even bigger anisotropy effect, such as internal shape anisotropy. So, further studies are needed to explain this phenomenon. Further researches are on progress, e.g., the influence of r o ∕r i ratio on the magnetic property of ring samples, the direct observation of the microstructure features of the material, etc. Moreover, if the difference between two kinds of samples will become less when the r o ∕r i ratio of ring samples is less than 0.1, or something else, perhaps these standards should be revised for these materials.
In order to take advantage of magnetic characteristics, also to make full use of stainless steels, many fundamental magnetic problems involving stainless steels must be further studied, such as the measuring method of magnetic property. In this paper, magnetic measuring methods of stainless steel using the permeameter method and ring sample method are studied. The benefits of both kinds of samples and differences between J-H and B-H curves are also discussed. Moreover, magnetic measuring of ferrite stainless steels are conducted using the ring samples and bar samples in different magnetic fields, which are frequently used in industry for quality control. The data obtained from minor and major loops, such as Br, Hc, μ r , Js and Hμ max are compared and discussed. From the magnetic parameters obtained from the major loops of both samples, large differences were found, revealing two kinds of samples can get quite different results. For the same product, different values of Br, Hc, Hμ max and μ r are obtained. Furthermore, Js values are also different. Ring sample has larger Hc value, thus lower μ r value, but smaller Js value. Possible reasons are discussed in detail. Moreover, further study is needed.
Footnotes
Acknowledgements
The authors are very much thankful to Liping Wang of Lao Zi Academy of U.S.A. This work is supported by 151 Fund (07-2-075), Analysis and Test Fund A (no. 04089) of Zhejiang province of P.R. of China.