
Abstract
The special working condition of shore power cable is more likely to form a crack air gap in insulating medium, which will cause gap discharge. The continuous gap discharge will cause local temperature rising and stress concentrating, which will lead to cable insulation deterioration. The electro-thermal-stress coupling method, in this paper, is used to establish the finite element model of the shore power cable. The electric, temperature and stress field distribution for the shore power cable with a crack air gap in the insulating medium is also studied, and the correctness of temperature and stress field distribution is verified by experiments. In addition, this paper investigated the variation law of the ampacity for shore power cable under different discharge energy. The results show that the maximum electric field is equal to the electric field intensity (36.1 kV/cm) at the inner edge of the insulating medium when the gap length d = 2 mm and that the temperature and stress of the cable are quadratic with load current, linear with the gap discharge energy. The research results of this paper have an engineering significance for monitoring shore power cables.
Introduction
With the shipping industry grows, more and more pollutants are released into atmosphere. Replacing the oil-fed generator in ships with shore power can reduce emissions [1]. High-voltage shore power transmission system plays a very important role in shore-to-ship power transmission [2]. However, the shore power cable is one of the weakest parts in the high-voltage shore power transmission system [3]. When high-voltage cable works, it runs under the multi-physics field include electromagnetic, temperature and stress field. In addition, the special use condition of shore power cable increases the probability of crack air gap inside the insulation, such as bending, winding, dragging, stretching, direct sunlight and moisture aging, etc. The gap will cause distortion of the electric field, then cause gap discharge. Local high temperature and stress concentration caused by discharge energy will accelerate the aging of insulation. Gap discharge mainly include five stages that is corona discharge, glow discharge, spark discharge and arc discharge [4–7]. Under different discharge stages, the electrical and thermal-stress characteristics are different.
Many scholars have done a lot researches in the field of gap discharge. H. Okubo investigated the relationship between partial discharge (PD) current pulse waveforms and physical mechanisms of gas breakdown for different kinds of gases or mixtures [8]. R. Bartnikas Comparatively analyzed the PD pulse form through two methods — short gap discharge theory and experimental measurement [9]. Y. Fan established a gap discharge plasma-chemical model to study the phase frequency and amplitude-frequency characteristics at different air gap lengths to assess the levels of gap discharge degradation in cable joint [10]. X. Xiangdong proposed a method for measuring the loss current of PD, and studied the variation law of loss current for needle-plate discharge under different voltages in one cycle, and the results shown that the loss current can reach micro-ampere level [11]. L. Qingming studied the volt-ampere characteristics of spark discharge under different discharge conditions, and calculated the spark discharge energy quantitatively with integral method [12]. H.Z. Alisoy investigated the volt-ampere and v-q characteristics of dielectric barrier discharges [13]. For cable joint, Y. Fan proposed a thermal equivalent model of cable joint contact resistance [14] and another thermal equivalent model of arc discharge [15,16], and calculated the thermal and stress distribution for cable joint and dielectric fitting by finite element simulation. Those articles mainly studied the characteristics of the discharge itself for typical models and cable joints, but does not study the thermal-stress distribution low under different discharge energy for shore power cables.
This paper, firstly, established an electro-thermal-stress coupling model for shore power cable, and proposes an equivalent heat source to be equivalent to the heat effect of gap discharge. Furthermore, the distribution of electric field under different air gap lengths was calculated and the influence of gap discharge energy on the thermal-stress of shore power cable was investigated, and the correctness of field distribution is verified by theory and experiment. Finally, the effect of gap discharge energy on ampacity is studied. The research results have a reference value for shore power cables in temperature and stress monitoring.
Multi-physical model of shore power cable
Physical model
The research object in this paper is a three-core shore power cable with a conductor area of 120 mm2 and ampacity of 350 A. As shown in Fig. 1, the conductor and metal shield is copper, insulating medium is ethylene propylene rubber (EPR), and warping tape is polyvinyl chloride (PVC), filling is polypropylene (PP), outer sheath is thermoplastic polyurethane (TPU). Physical parameters of the cable are shown in Table 1. Moreover, the relative permittivity of inner and out semi-conductor is 100 [17].
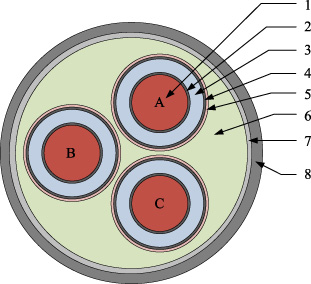
The structure diagram of 10 kV shore power cable. 1 Conductor (CO); 2 Conductor shield (CS); 3 Insulator (IN); 4 Insulator shield (IS); 5 Mental shied (MS); 6 Fill (FI); 7 Warping tape (WT); 8 Outer sheath (OS).
Material parameters of shore power cable

Single-phase cable structure and air gap model. R 1 = 6.5, R 2 = 7, R 3 = 11.5, R 4 = 12, R 5 = 12.5 mm.
In order to investigate the influence of gap discharge energy on shore power cable, the gap model for the shore power cable is established is as shown in Fig. 2. Gap is set in the insulating medium of phase B near the insulating shield. The range of the gap length (parameter d) is from 1 to 4 mm [18], the width and thickness (parameter b) both is 0.5 mm, and the relative dielectric of the gap is constant 1 [19], specific heat capacity is 1007 J/(kg ⋅ K), thermal conductivity is 0.026 W/(m ⋅ K).
Since the wavelength of the power frequency electromagnetic field much larger than the transmission distance of the shore power cable, the quasi-static field analysis theory is used to calculate the electric field distribution for shore power cable. Then the potential governing equations can be obtained as follow
According to the Fourier heat transfer law and energy conservation law, the temperature field governing equation is shown as follow
The discharge energy of shore power cable can be calculated according to the similarity between cable insulation gap discharge and dielectric barrier discharge (DBD). The power frequency DBD model and the equivalent circuit are shown in Fig. 3. 1 and 2 are the positive and negative electrodes, 3 and 5 are the insulating medium, 4 is the gap. C d1 and C d2 are the equivalent capacitance of the insulating medium, and C g is the equivalent capacitance of the gap. Because the voltage of the gap remains stable when the gap is broken down, the gap can be equivalent to a Zener diode.
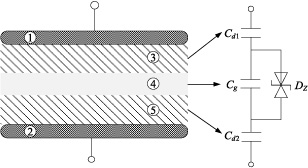
DBD model and equivalent circuit.
Discharge energy of DBD gap can be calculated as follow equation [22].
If there is a gap in the insulating medium of the shore power cable (Fig. 2), since the resistivity of the insulating medium is far larger than the gap resistivity when the gap is discharging, the current density is mainly concentrated in the gap. It can be assumed that the discharge energy of the gap is
The heat source of the gap discharge can be equivalent to an ellipsoid [15,23], the equivalent heat source (EHS) model is shown in Fig. 2. In this paper, two-dimensional simulation method is used to simulate the gap heat source. The heat source can be calculated by the following formula
The displacement equation is usually used to solve the thermal stress, is given by
The thermal stress of the shore power cable can be solved by the following formula
Voltage and current sources of sine power frequency are respectively exerted to A, B and C phases. In order to prevent the floating voltage in the metal shield, both metal shield and outer sheath should be grounded.
The magnetic vector potential outside the cable boundary is attenuated faster, and the boundary condition is
The temperature boundary conditions of the cable surface include convection boundary condition
This paper does not consider other external forces, only consider the thermal stress. Stress boundary condition is as follow
Simulation results of multi-physical field
When voltage excitations are applied to the shore power cable, the electric field, potential and magnetic field at each point are alternating with time. When the applied voltage reaches the peak voltage, the potential distribution and electric field distribution is shown in Fig. 4 and Fig. 5 respectively. The electric field intensity is concentrated in the insulating medium and inversely proportional to the radius. The maximum electric field intensity is 36.1 kV/cm. The simulation results of electric field can be validated by analytical algorithm
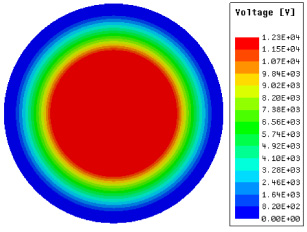
Potential distribution.
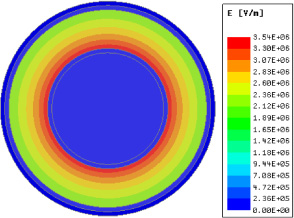
Electric field distribution.
Applying sine current excitation I
d
at rang of 205 to 385 A for the shore power cable. By the iterative solution of equations (3)–(5), the ohmic loss per unit length of the cable is as shown in Fig. 6. Whether the effect of temperature is considered or not, ohmic losses of conductor and metal shield increase with the increase of current. In addition, comparing without considering the effect of temperature, the ohmic loss of the conductor is larger when feedback of temperature considered. However, the ohmic loss of the metal shield is decreased with the effect of temperature considered. The reason why ohmic loss of the metal shield is reduced is that eddy current loss is proportional to conductivity [24], frequency and conductor volume
As the load current increases, the maximum temperature of the cable will rise. However, the conductivity of conductor and metal shield decreases, which means less loss of the conductor and more loss of the metal shield.
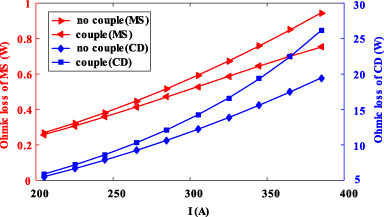
Ohmic loss with and without of the temperature feedback for conductor and mental shield.
Figure 7 is the temperature distribution with load current 325 A. The temperature of the conductor is 65.88 °C and the surface temperature of the cable is 33.54 °C. This paper only concern about the stress distribution in the insulator, which is as shown in Fig. 8. The maximum stress of the insulation is 1.75 MPa and the minimum stress of the insulation is 0.15 MPa.

Temperature distribution of shore power cable.

Stress distribution of insulation.
Figure 9 is the variation law of the conductor temperature and thermal stress of the insulation with load current increasing.
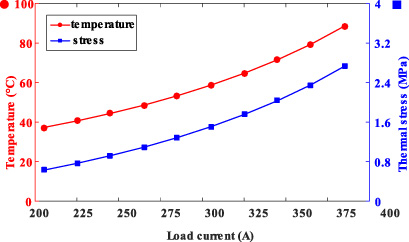
Curve of temperature and thermal stress as load current increases.
In order to verify the accuracy of the simulation results, six array sensors are installed as Fig. 10 to measure the temperature and stress of the cable surface. The Numbers are 1 ∼ 6 respectively, and the positions of each measuring point are 60 degrees apart. Feed 325 A load current into the cable and keep the room temperature at 22 °C. After the surface temperature of the cable reaches a stable level, the temperature and strain value of each point are recorded. On the other hand, the temperature and strain distribution on the surface of a cross section obtained by simulation under the same conditions. The curve is shown in Fig. 11, the surface temperature and strain of the cable varies sinusoidal periodically along the circumference direction. The values at each Numbers in the curve correspond to the data measured by each sensor. The comparison between simulation data and measurement data is shown in Table 2. The error of temperature and strain is 4.7% and 7.2% respectively.
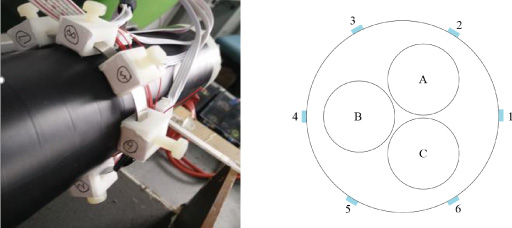
Physical picture and schematic diagram of six sensors installation.
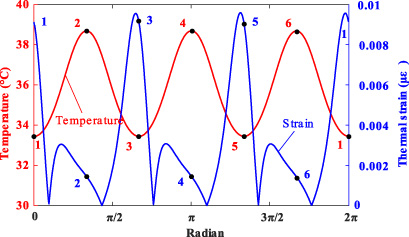
Temperature and stress curve on the cable surface.
The comparison between simulation data and measurement data
Due to its special working conditions (coiling, suspending and stretching), shore power cable is prone to deformed. If the deformation stress exceeds the yield strength of the insulating medium, there will be cracked in the insulating medium. Figure 12 is a partial electric field distribution diagram when the length of the gap is 3 mm. The electric field intensity in the gap reaches 48.9 kV/cm at the tip of the gap, far beyond breakdown electric field intensity of air (30 kV/mm).

Electric field distribution with air gap.
In order to analyze the variation law of electric field intensity along the tangential and radial directions, the electric field distribution along the circular curve — l: x 2 + y 2 = (R 2 + 0.25)2 is investigated, as shown in Fig. 13. And the radial electric field distribution through the gap is shown in Fig. 14. As the length of the gap increases, the electric field intensity at θ = π (the insulation between the gap and the core) on the circular curve l is decreases exponentially. As the length of gap increases, the maximum electric field intensity in the gap increases, but still lower than the electric field intensity of the inner edge of the insulation (E = 35.4 kV∕cm). The maximum electric field continues to increase. When d = 2 mm, the maximum electric field is exactly equal to the breakdown electric field intensity of the inner edge of the insulation. It can be inferred that when the length is greater than 2 mm, gap discharge is more likely to occur.
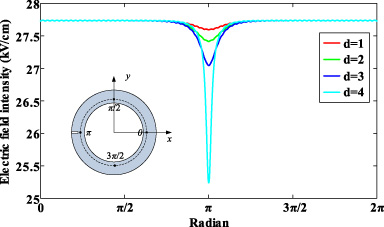
Electric field distribution on the circular curve l.
In order to quantitatively analyze the electric field distribution with and without the gap, we suppose that point P
1 (−(R
3 − d − 0.25), 0) and P
2 (−(R
3 − d + 0.25), 0) represent no gap,

Electric field distribution in the radial direction.

The comparing of electric field intensity at point P 1 and point P 2 with and without air gap.
One of the main characteristics of gap discharge is discharge energy. Continuous discharge will increase the ohmic loss of the gap, and then cause the temperature and thermal stress rising in shore power cable. Figure 16 and Fig. 17 show the temperature and stress distribution of shore when the load current is 325 A and the gap discharge energy is 12 W. The maximum temperature of the conductor is 80.45 °C, which is 14.57 °C higher than the normal cable. The maximum thermal stress of the insulating medium is 5.69 MPa, which is 3.94 MPa greater than normal. By comparing with the data in reference [25], the correctness of simulation is verified.
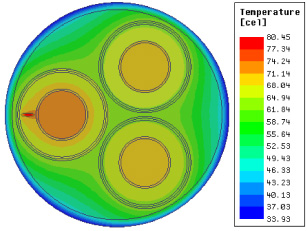
Temperature distribution with gap discharge.
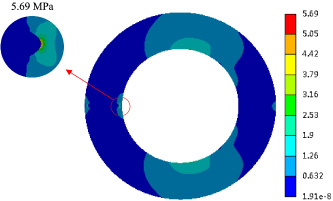
Stress distribution with gap discharge.
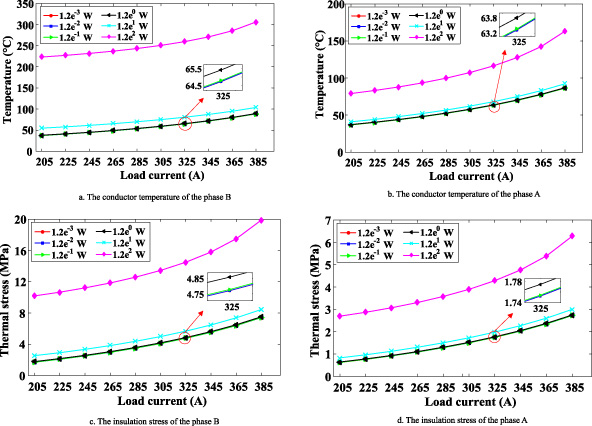
Temperature and stress curve under different load currents and discharge energy.
Figure 18 shows the thermal-stress characteristic curve with different gap discharge energy. Since ohmic loss, load current and temperature satisfy the following relationship, quadratic function and linear function are used to fit the current and discharge power.
The fitting functions are respectively given by
For the EPR, the load current is considered to be the ampacity if the conductor temperature reaches 95 °C. By iteratively calculating quadratic equations (21) and linear equation (22), the cable rate current curves under different discharge energy are plotted in Fig. 19. The greater the discharge energy, the greater the drop in cable ampacity. Assuming the other conditions are unchanged, the ambient temperature is still 22 °C. When the discharge energy of the gap is equal to 13.14 W/m, the ampacity is 325 A. At this time, the maximum insulating thermal stress of phase B is 5.79 MPa.
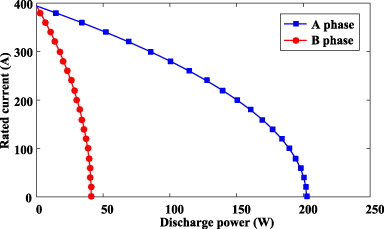
Ampacity at different discharge energy.
In order to analyze the electric, thermal and mechanical characteristics of shore power cable, the Electromagnetic-thermal-stress multi-physical coupling model and the equivalent model of the gap discharge energy are established. The following conclusions are obtained.
(1) The Ohmic losses of the conductor and aluminum sheath with and without consideration for temperature feedback are analyzed. Because the eddy current loss is proportional to the conductivity, the temperature rise will decrease the Ohmic loss of mental shield.
(2) The variation law of the electric field in insulating medium with gap length is analyzed from different perspectives, and compared with the insulated electric field without gap. With the gap length increases, the electric field intensity at the insulation between the gap and the core is index decreases, the electric field intensity in the gap is index increases. The increment of the electric field intensity in gap gradually decreases, the decrement of the electric field intensity in insulating medium between gap and conductor shield gradually increases.
(3) The effect of gap discharge energy on the thermal-stress characteristics and ampacity of the shore power cable is studied. We find that the temperature and stress are quadratic with the load current and linear with the gap discharge energy. Gap discharge has a great influence on the ampacity of the defect phase, and has less influence on the non-defective phase.
Footnotes
Acknowledgements
The authors acknowledge the support of Technological Projects (Research and application of key technologies for shore power cables for ships, 52110118000U) of State Grid Zhejiang Electric Power Company, Ltd and the support of graduate research and innovation foundation of Chongqing, China (Grant No. CYS18008).