
Abstract
Wound-core transformers are characterized by their economical and efficient design and are therefore widely used in power distribution systems; for this reason it is of paramount importance to determine their electrical characteristics. One of the most important parameters in these transformers is leakage reactance, since this is what largely determines short-circuit currents and voltage regulation. And yet the authors have found a conspicuous gap in the scientific literature concerning analytical formulations for the calculation of leakage reactance in wound-core transformers. In order to fill this gap, the authors propose a formula in terms of leakage areas and the Rogowski’s height of the windings. A geometric model of the active part of the transformer is proposed which allows for the exact calculation of the leakage areas. The results of the proposed formula are compared with simulations with the finite element method in 3D (FEM3D) and with measurements in eight real case studies. It is concluded that although the FEM3D calculates the closest results to measurements, the proposed formula reported sufficiently accurate results for transformer design purposes.
Introduction
Leakage impedance is undoubtedly one of the most important parameters in the design of a transformer and it is of vital importance to manufacturers that its final value be as close as possible to the value guaranteed to the customer. Due to production constraints at the manufacturing stage, it is difficult to ensure that the measured impedance value exactly matches the guaranteed value. This is why international standardization organizations such as ANSI have defined the maximum permissible deviations of the measured impedance value from the guaranteed value. According to ANSI IEEE C57.12.00 the tolerance for transformers with impedances greater than 2.5% is ±7.5%, and in the case of transformers with impedances equal to or less than 2.5%, it is ±10% [1]. In the event that a transformer falls outside the tolerance specified by the standard, the purchaser may reject the unit or apply fines to the manufacturer, generating negative economic impacts for both parties.
Short-circuit impedance has two components, the real and the imaginary. The imaginary is known in the literature as leakage reactance and makes up the predominant part of the impedance; hence, this work will focus only on the calculation of leakage reactance.
While transformer manufacturers have relied for decades on analytical formulas to calculate the different parameters of transformers, it is indisputable that numerical methods such as the finite element method have the ability to model much more complicated geometries [2–4]. Despite this, analytical methods are still valuable for their speed, and because they allow for the interrelation of variables to be visualized more clearly [5–7].
As far as the construction of transformers is concerned, the two most common models for the active part, and specifically the core, are the stacked core and the wound core. Wound-core transformers are typically used for power ratings below 800 kVA and play a fundamental role in linking the distribution network with end users [8]. Figure 1 shows a 3D model of the active part of a single-phase, shell-type wound-core transformer. As can be seen, although the core has a rectangular cross section the geometry of the coils is not completely rectangular for reasons that will be expanded on in Section 3.2.
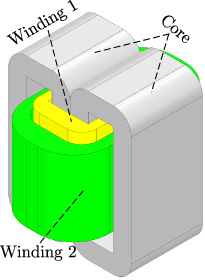
Isometric view of a single-phase wound-core transformer.

Front and top views of the active part of a wound-core transformer.
Dozens of works can be found in the literature where leakage reactance is calculated both analytically and numerically in transformers with a stacked core and circular windings [3,4,9–12]. However, the authors of this work identified a notable lack of scientific literature dedicated to analytical formulations for the calculation of leakage reactance in wound-core transformers. Several empirical formulas presented in the literature have the drawback that they use unknown constants. Furthermore, these empirical formulations typically do not indicate the extent to which they can reliably be used for the calculation of the leakage reactance.
The formulation developed by Georgilakis in [13] is among the most important works presenting analytical procedures for the calculation of leakage reactance in wound-core transformers. In this work the author propose a highly detailed model of the active part, considering the effect of the cooling ducts and the geometric particularities of the coils. Unfortunately the formulation remains in terms of factors that depend on the number of cooling ducts, which is not disclosed in the work for reasons of confidentiality with the manufacturer.
The fundamental purpose of this paper is to fill the gap identified in the scientific literature by proposing a reliable formulation that does not depend on empirical factors and that clearly indicates its scope of application.
The most important contributions of this work are the following: (a) To fill a gap in the scientific literature by proposing an analytical formula for the calculation of leakage reactance of wound-core transformers. (b) To propose a formula whose results are suitable for the design of distribution transformers, validated by comparison with measurements and FEM3D simulations for eight real case studies. (c) To propose a geometric model of the coils of the wound-core transformer that is consistent with its construction characteristics; this geometrical model facilitates, on the one hand, the exact calculation of the leakage areas and, on the other, the precise definition of the geometrical scope of the formulation.
Figure 1 shows an isometric view of the active part of a wound-core distribution transformer.
As can be seen, the windings have two different shapes depending on the region. In the region under the core window the coils are flat, while outside the core window the coils are quasi-circular. An issue that will be explained in detail in Section 3.2 is the fact that the thickness of the quasi-circular region is greater than the thickness of the flat portion. This situation further complicates the direct application of traditional formulas.
These particularities in the geometry of the active part of the transformer mean that the direct application of methods or analytic formulations designed for 2D planar or axisymmetric configurations might cause significant deviations between calculations and measurements. While the scientific literature has devoted great efforts to the analytical calculation of leakage reactance in transformers with circular coils, little attention has been paid to the calculation of leakage reactance in wound-core transformers.
Likewise, although the geometric description of a transformer with circular windings is almost trivial, to the authors’ knowledge there is no rigorous and satisfactory geometric definition of the coils for wound-core transformers in the literature. The purpose of this work is to address these deficiencies.
Leakage reactance in transformers with quasi-rectangular coils
Modified leakage reactance formula
A modification of Del Vecchio’s formula in terms of leakage areas is proposed in [14] for the calculation of leakage reactance in transformers with partially circular windings. The modified formula is presented in (1)
Figure 2 shows the front and top view of the active part of a wound-core transformer. The internal winding is depicted in yellow and the external winding is depicted in green.
It is important to mention that although in this work conventional core transformers were considered, in the last decades there has been a trend in using octagonal cores as described in [15]. Since the core is manufactured with a highly permeable steel and the main difference between an octagonal and a conventional core is mainly in its external periphery, it can be safely stated that the formulations presented in this work are valid for both types of cores. A new trend in the recent years has been also the use of 3D wound cores, however due to the great differences in construction those transformers are beyond of the scope of this work [16,17].
The most relevant aspect of the coils in Fig. 2 is that they are not circular, but not completely rectangular either. Because of this, these coils will hereafter be referred to as quasi-rectangular coils. The detailed geometric description of the windings will be provided in this section while the geometric details of the of the conventional wound core can be found in [18].
Another relevant difference to circular coils is that each of the coils has two different thicknesses. For example, in the case of the internal winding we have the thicknesses w
1 and
(a) In the curved part, a certain number of cooling ducts are located between one layer and another which increases the thickness of the winding.
(b) The output leads of the coils and high voltage taps are located in the curved part of the coils which increases its thickness. Figure 3 shows the HV output leads in detail.
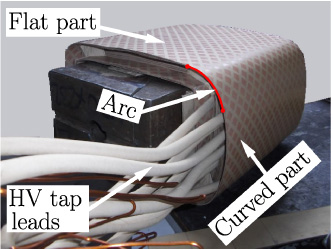
High voltage coil of a wound-core transformer.
(c) In order to improve the mechanical stability of the coils, they are subjected to a pressing process. This pressing is done to the flat part of the coils. After the pressing process, it can be shown that the dimension of the flat part is reduced, while the dimension of the curved part is increased.
Figure 2 also shows the internal dimensions of winding 1, which are w
0 and
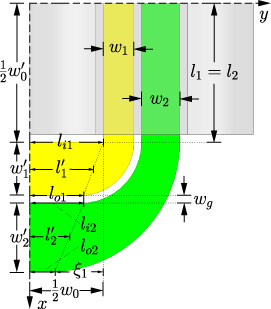
Up to this point the overall dimensions of the coils have been presented generally; nonetheless, it is essential to provide a geometric description of the curvature of the coils, which will be done using the diagram in Fig. 4.

Geometric model of the coils of a wound-core transformer.
The curvature of the coils has been modelled using the circumference arcs Arc1, Arc2 and Arc3. Although other types of curves such as ellipses can be used [13], the reasons for using circumference arcs are as follows:
(a) The exact calculation of area and perimeter is considerably simpler for circumference arcs.
(b) Circumference arcs ensure compliance with the principle of conservation of mass. It is easy to show that at no point will the thickness of the coil exceed its maximum thickness (
(c) A qualitative study was carried out showing that the curvature of the corners of the coils can be adequately represented by means of circumference arcs. See Fig. 3.
(d) Circumference arcs guarantee that the thickness is exactly w g at any point of the main leakage duct, which is of great importance since this thickness directly affects the calculation of leakage reactance. In the case of ellipses, it is more difficult to guarantee this condition.
The geometrical description of the arcs that make up the geometry of the coils is presented below:
Arc1:  and center at O
12 where:
and center at O
12 where:  and center at O
12 where:
and center at O
12 where:  and center at O
3 where:
and center at O
3 where:
As can be seen in (1), leakage reactance is expressed as a function of the coils’ thicknesses w 1 and w 2. Since the thickness of the coils in wound-core transformers is not constant, it is necessary to define a weighted thickness so that the thickness of the coil is not overestimated or underestimated. We will denote the weighted thicknesses of windings 1 and 2 as w w1 and w w2 respectively. Since the thickness of the leakage duct is constant, it is not necessary to define a weighted thickness in this case. The dimensions of Fig. 5 will be used for the definition of the weighted thicknesses.
Schematic diagram showing additional dimensions for the definition of weighted thicknesses.
We define the weighted thickness of winding 1 as follows
As can be seen in (1), Del Vecchio includes the empirical factor s which modifies the average height of the windings h m . The Del Vecchio’s formula for reactance is derived from an idealized situation where the field has only an axial component, so the purpose of the empirical factor s is to include the effect of the field’s radial component [9].
To the authors’ knowledge, the empirical factor s can be reliably applied to stacked-core transformers and circular coils. There is no evidence however that this factor is applicable to wound-core transformers with quasi-rectangular coils. Consequently, the need arises to include the effect of the radial component of the field adequately. For this sake, the traditional Rogowski factor will be used, which is defined as follows [19]:
The strategy to be followed in proposing the new formulation for the calculation of the leakage reactance in wound-core transformers is as follows:
(a) The modified Del Vecchio formula (1) is taken as a basis. (b) The empirical factor s will be removed and the height h m will be replaced by the Rogowski height as presented in Section 3.4. (c) The thicknesses w 1 and w 2 will be replaced by the weighted thicknesses w w1 and w w2 calculated as stated in Section 3.3.
Applying these modifications to formula (1) gives
In order to make the calculations easier, the leakage areas have been divided as shown in Fig. 6.

Schematic diagram showing transformer leakage areas.
The leakage areas of windings 1 and 2 and the main duct are defined as follows:
Due to the particular geometry of the coils of the wound-core transformer, it is not feasible to determine leakage reactance by 2D simulations in either planar or rotational symmetry. In order to make the representation as accurate as possible, the authors constructed a parametric 3D model of the active part of the transformer using the finite element method program ANSYS Maxwell.
For the solution of the field problem, the distribution of
The most relevant aspects of the model are listed below:
(a) The model has nine input parameters that determine the geometry, which are defined as shown in Fig. 2. The input parameters are:
(b) The curvature at the corners of the coils was modeled exactly with the same criteria presented in Section 3.2
(c) Due to the fact that the cooling ducts are located only in the curved part of the coil and that each has a different length according to the layer in which it is located, it was decided not to explicitly model the cooling ducts either in the FEM3D model or in the mathematical formulations. This considerably simplifies the formulations and the FEM3D model. Comparison of the simulated results and the measurements indicates that the effect of these ducts may not be determinant for the calculation of the leakage reactance for this particular type of transformers.
(d) A magnetostatic simulation was performed and the per-unit leakage reactance was calculated from the total energy W
T
stored in the magnetic field using the following expression
(e) The amperes turns are exactly the same in both windings NI = N ⋅ I b but opposite in direction.
(f) Copper windings were used in all case studies with electric conductivity of 58 MS/s and a relative permeability of μ r = 0.999991.
(g) The constant core relative permeability used was μ r = 10000.
(h) A maximum error of 0.5% was established for adaptive meshing and a balloon 1 boundary condition was used for the outer boundary of the model. Figure 7 presents the geometric model and the final mesh that met the error criterion for case study 7.
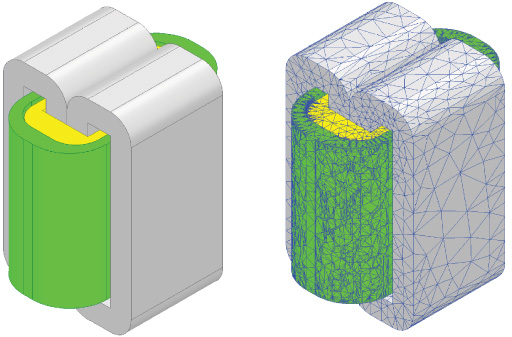
Geometry and final mesh for case study 7.
(i) Mesh operations: During the first performance tests of the model, it was identified that when calculating the areas by means of surface integrals 2 there were discrepancies with respect to the areas calculated by means of the expressions in (11). This discrepancy is due to the fact that when discretizing with tetrahedral elements the curved regions are represented in a polygonal fashion. If the length of the edges of the elements is large compared to the radius of curvature, considerable deviations from the ideal surface may occur. To avoid this inconvenience, a mesh operation was applied to the external curved faces of winding 1 and to the internal curved faces of winding 2. The imposed mesh operation guarantees a maximum mesh deviation of 0.01 mm from the ideal surface. Figure 8 shows the effect of the mesh operation on the curved faces of the model for both windings.

Meshes of windings 1 and 2 for case study 7.
The simulations were performed on a desktop computer of 2.00 GHz Intel Core i7 and 16.0 GB of RAM memory using ANSYS Maxwell which is part of the suite ANSYS Electromagnetics 2019 R1.
In order to give a general idea of the computational performance of the FEM3D, a table with the most important characteristics of the simulation of case study 7 is presented below.
It is important to note that the calculation time presented in Table 1 should not be taken as a reference for comparison with other methods because the simulation was specified to obtain the highest possible accuracy in the calculation of reactance. Taking advantage of the symmetry of the problem, the model could be reduced to its eighth part, theoretically reducing the memory and the calculation time by a factor of eight.
Simulation summary for case study 7
This section presents the results obtained when applying the different calculation methods described in the previous sections. The results of each of the methods will be compared with the values measured in real transformers by means of relative error. Tables 2 and 3 present constructive information and rated data (S b and V b ) for the eight case studies analyzed in this work. The measured reactance X m , the reactance calculated with the proposed formula X p and the reactance calculated with FEM3D X 3D are given at the end of the table.
Constructive data and results for the first four case studies
Constructive data and results for the first four case studies
Constructive data and results for the last four case studies
The relative errors of the proposed formula ϵ
m. p
and FEM3D ϵ
m⋅3D
with respect to the measurements are also reported. The relative error is calculated using the following formula
Figure 9 graphically shows the leakage reactance values calculated with each method. As can be seen, FEM3D practically overlaps the measurements, while the proposed method tends to overestimate the reactance.

Leakage reactance calculated using each of the methods.
In order to visualize the performance of each methodology with respect to the measurements, relative error graphs of each of the methods are presented in Fig. 10.

Relative errors for all case studies.
It can be seen that the relative errors of the proposed formula and FEM3D have similar trends with the exception of case study 5, where the proposed formula reports the highest relative error of all cases (4.7%), while for this case FEM3D reports the most accurate result of all. The particularity of this transformer is that it is precisely the shortest, that is, the transformer with the lowest average height h
m
. On the other hand, the transformer that reports the smallest relative error with the proposed formula is that of case study 7, which is precisely the tallest of all case studies. Another interesting situation can be observed in case studies 5 and 7. Analyzing the behavior of the variable k
r
defined in (9), it is found that case 5 reports the largest value
Figure 11 shows the magnetic field distribution of case study 7. Is interesting to note that the flux pattern is different in flat and curved zones of the windings. This is due to flat part is surrounded by the core while curved zone is outside of the core window.
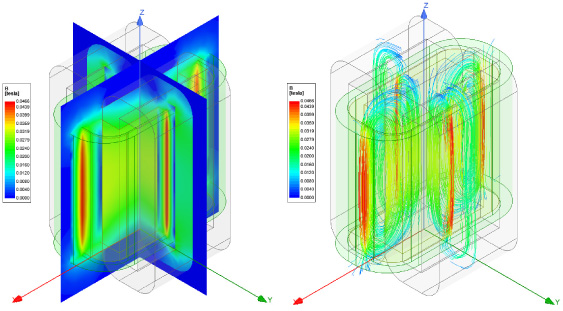
Magnetic flux density distribution of case study 7.
This paper fills a gap in the scientific literature by proposing a specific formulation for the calculation of leakage reactance in wound-core transformers.
The proposed formulation is compared with measurements for eight case studies with different geometries and reactances, finding that the relative error never exceeded 5%, which is satisfactory for distribution transformer design purposes.
An important contribution of this work is that (2) and (9) clearly specify the scope of the proposed formulations, which is essential for the implementation of the formulas.
The FEM3D method was the best method for calculating leakage reactance, giving relative errors of less than 2% for all case studies. Even higher precision could be obtained by including the cooling ducts in the model, as shown by Georgilakis in chapter 6.4 of [13].
The authors recommend evaluating the leakage reactance of transformers with considerably low heights (in the order of 10 cm or less) with caution, since case study 5 revealed that the analytical formula, which is based on the Rogowski factor, may present some limitations. For these cases it is also suggested to check the solution with FEM3D.
Footnotes
Acknowledgements
The authors would like to offer special thanks to test field engineers Gustavo Romero and Luis Fernando Espinosa of Siemens Andina Transformers for their assistance in measuring case study parameters, and also to Richard Tellez, Samuel Carvajal and David Pinzon of Siemens for their interest and support in the research project. We would also like to thank Prof. Pavlos Georgilakis of the National Technical University of Athens for kindly answering questions about the formulations available in his book Spotlight on Modern Transformer Design for the calculation of leakage reactance. Special thanks to the Research and Transfer Vice-Rectory of the La Salle University - Bogota Colombia, who supported the publication of this work within the framework of the call for international visibility.
Appendix
The experimental setup for the short circuit test is shown in Fig. 12. All tested units were fed from high-voltage (HV) with a variable voltage source and were short-circuited by low-voltage (LV).
Table 4 presents the test data for each of the case studies. All case studies are single-phase step-down distribution transformers. The variable S n represents the rated power of the transformer, V n is the rated high voltage, V scm is the short-circuit voltage measured on the high-voltage side, P scm is the short-circuit power measured on the high-voltage side, R m is the resistance in percent, Z m is the short-circuit impedance and finally X m is the measured leakage reactance.
It is important to note that the variables V
scm
and P
scm
are obtained from direct measurements, while R
m
, Z
m
and X
m
are obtained indirectly from the following expressions [10].
The general test conditions for all case studies were as follows: (a) The tests were performed by short circuiting the low-voltage terminals and feeding from the high-voltage side. (b) All test data refer to a test temperature of 20 degrees Celsius. (c) The second column of Table 4 indicates the number of identical units that were tested. The V scm and P scm data correspond to the average value of the units tested. (d) It should be noted that in this work V b = V n and S b = S n because they are single-phase units. In the case of three-phase transformers V b is the phase voltage and S b the apparent power per leg.
1
Balloon boundary models the region outside geometry of interest as being nearly infinitely large.
2
The surface integrals are carried out with the Fields Calculator tool in ANSYS Maxwell.