
Abstract
Nondestructive examination and evaluation system for high pressure feed water heat exchanger tubes in nuclear power plant was developed. Differential-type bobbin coils made of copper wire are placed on both sides of GMR sensors arranged in a ring shape. If alternating current (AC) is applied to the bobbin coils, then an inductive current is occurred in circumferential direction of the tube to be examined. Under these conditions, eddy currents are generated around the defect. Because the time-varying magnetic field is distorted by eddy current that is generated around the defect, the shapes and dimensions of defect can be quantitatively evaluated with cylindrical arrayed GMR sensors. The result was verified by the artificial defects fabricated in a small diameter heat exchanger tube.
Introduction
Eddy current testing (ECT) to verify the integrity of heat exchanger tubes is periodically performed with bobbin probe during the plant maintenance outage [1,2]. Depending on the test results, the tube plugging is carried out for the tube exceeding the acceptance criteria. The bobbin probe can be applied with high testing speed (approximately 40 in/sec), and has many advantages such that is able to examine many tubes in limited time and can easily detect various type of defects including volumetric defect. However, it is difficult to evaluate the characteristics of the defects, i.e. it is hard to distinguish crack-like defects and volumetric defects and to know the size of the defect. In addition, it has a poor sensitivity of circumferential crack, so the crack-like defect can be mistakenly evaluated as a volumetric defect.
As a successive action of the ECT results, if any crack is found in a tube, the tube should be plugged regardless of the repair criteria, but the tube with volumetric defect should be plugged only for the case its thickness exceeds the criteria. Therefore, if a crack-like defect is mistakenly evaluated as a volumetric defect and remains unrepaired, there is a potential risk of leakage due to rupture of the heat exchanger tube during the normal operation of the power plant.
To overcome these limitations of bobbin probe, motorized rotating pancake coil (MRPC) probe is additionally applied to the tube that defect is found from the bobbin test [3,4]. MRPC probe helically scans inside of the tube with approximately 900 rpm by a motor attached on the rear of the probe head and moves axially with 0.5 in/sec. However, the testing with MRPC probe has disadvantages of slow speed and short service life, so that it is not used practically to the whole examination of the heat exchanger tubes.
Meanwhile, an annular arrayed ECT system (referred to as ‘X-probe’) which arranges the active coil sensor in a circumferential direction and scans inner wall of a small diameter tube in an axial direction with an increased speed has been developed to distinguish the existence of defects and to evaluate the defect quantitatively [3,5–7]. Compared to the MRPC probe, the X-probe has a merit that it can detect defects with high speed. But, in case of passive pancake coil, there will be an inevitable crosstalk between neighboring coils when all sensors are active at the same time. To solve this problem, the space between coils must be increased, or the sensors should be activated alternately and maintained at a distance sufficient to avoid crosstalk.
Recently, the developments of bobbin-type magnetic camera for the examination of small bore heat exchanger tubes have been reported [8–14]. These systems are able to detect and evaluate defects by imaging eddy currents using magnetic sensors that are arranged in a ring or cylinder shape. When alternating current (AC) is applied to a coil, an inductive current is generated in circumferential direction of a tube. If there is a defect in the tube, the inductive current is distorted and then the time-varying magnetic field is distorted. This time-varying magnetic field is measured by annularly or cylindrically arrayed GMR or Hall sensors, and the shape as well as the dimension of the defect can be quantitatively evaluated. Since the time-varying magnetic field intensity resulting from the presence of the defect is measured by solid-state passive magnetic sensors, the magnetic camera has an advantage that spatial resolution can be increased because there is no interference between sensors and no need to activate the sensors in rotation unlike X-prove. Nevertheless, the magnetic camera also has a disadvantage that it is difficult to distinguish the location of defect like inner diameter (ID) or outer diameter (OD) because it depends on change of voltage only.
Therefore, in this study, we propose a method to characterize defect size and shape as well as location using a bobbin-type integrated GMR sensor array (BIGiS), consisting of differential-type bobbin coils and a GMR sensor array. To distinguish the location of defect (ID or OD), GMR sensors which have higher sensitivity than Hall sensors were used. Differential-type bobbin coils cause axial magnetic flux density changes due to defects that can be measured by GMR sensors with axial directional sensitivity. The distribution and phase angle difference of alternating magnetic field due to the presence of defects were measured and imaged, and the location, type, shape, and size of defects were evaluated quantitatively by analyzing the Lissajous plots and the alternating magnetic field distributions.
Principles
When time-varying magnetic field is applied by a bobbin coil, inductive current and secondary time-varying magnetic field is generated in a conductive small-bore tube. Because this secondary time-varying magnetic field includes R, L, and C components, there will be a phase angle difference as well as an amplitude difference due to the existence, size, and location of the defect. In the meanwhile, if a first time-varying magnetic field is applied to two neighboring bobbin coils, the secondary time-varying magnetic field on the center of two coils are canceled each other, and the region whose magnitude is zero is produced as a ring shape. Accordingly, as shown in Fig. 1, when the magnetic camera passes the defect area, the balance of the secondary time-varying magnetic field is broken, and the amplitude and phase angle difference are measured by sensors.
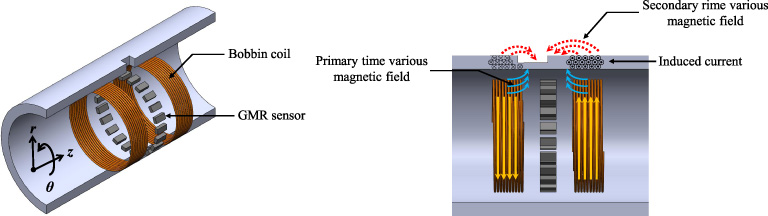
Projected BIGiS and magnetic field distribution.
Therefore, it is possible to measure the overall secondary time-varying magnetic field distribution of a small-bore tube by locating a sensor element, which can measure the magnetic flux density like a GMR sensor, to the region that the secondary time-varying magnetic field is canceled and scanning the inside of the tube in the axial direction. The time-varying magnetic field, which can be measured by GMR sensor, is expressed as following Eq. (1) [15].
In Eq. (1), V G indicates the output voltage of a GMR sensor. A GMR sensor responses sensitively to horizontal direction to sensor face, i.e., B z or B 𝜙. In this study, GMR sensors are arranged to be sensitive to Z direction. C 1 and C 2 are constants which indicate the inherent properties of applicable sensors, and p is an input voltage. The above equation indicates that, when an external magnetic field is applied, the voltage increases nonlinearly regardless of the polarity to saturation point.
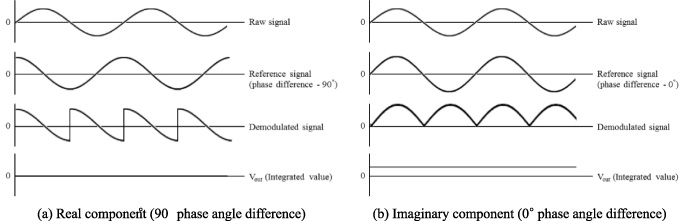
On the other hand, the amplitude ratio and phase angle difference which are changed by interaction of electromagnetic fields can be obtained by diverging and mixing the output signals derived from Eq. ((1)). That is, as shown in Fig. 2(a) and Fig. 2(b), the real component of the signal is extracted by mixing the signals which have 90° phase angle difference in detected signals, and the imaginary component is extracted by mixing the signals which have the same phase angle. The amplitude ratio and the phase angle difference expressed in Eqs ((4)) and ((5)) can be calculated using Eqs ((2)) and ((3)).
In this study, the distribution of amplitude ratio and phase angle differences are expressed in different colours on plane which have a sensor array axis (𝜙) and scan axis (z).
Measurement method of real & imaginary component.
Figure 3 shows the test specimen with artificial defects to verify the effectiveness of the proposed inspection system. The material of the specimen is 304 type stainless steel which is commonly used for high-pressure heat exchanger tubes. The ID and wall thickness of the tube are 13.3 mm and 1.27 mm, respectively. The defects on the left side of the specimen have different type of artificial flaws, and the types are tapered wear (A), flat wear (B), round hole (C), axial notch (D), circumferential notch (E), dent (F), and steam cut (G) as shown in Table 1. In this study, the distribution of amplitude and phase angle differences of alternating magnetic field in the specimen are characterized according to the type of defect. Also, the change of alternating magnetic field is quantified according to the location and depth by using the ASME calibration standard.
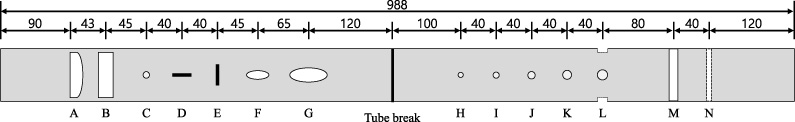
Test specimen (unit:mm).
Shape and dimesion of artificial flaws
Figure 4 shows the experimental setup and the 3-D illustration of the sensor probe. The sensor probe was designed to examine the tube of 13.3 mm ID and 22 GMR sensors were arranged in a circumferential direction of the sensor head which was made of PEEK. In this sensor array configuration, the angular resolution is 16.36 degree. The inductive current is generated in the inner wall of the specimen by placing the bobbin coils of 180 turns at each side of the sensor array. The width of each coil is 3 mm, and the gap between two coils is 8 mm. The coils are activated with constant-voltage driven AC of 50 kHz. Output of GMR sensor was obtained through a 300 kHz low pass filter, a 53.89 dB AC amplifying circuit, and a real and imaginary component circuit. Sensor assembly in Fig. 4 was inserted into the specimen by automated pusher-puller with scan speed of 50 mm/sec, and then the real and imaginary component, amplitude ratio, and phase angle difference distribution expressed in Eqs ((2))–((5)) were measured and calculated.
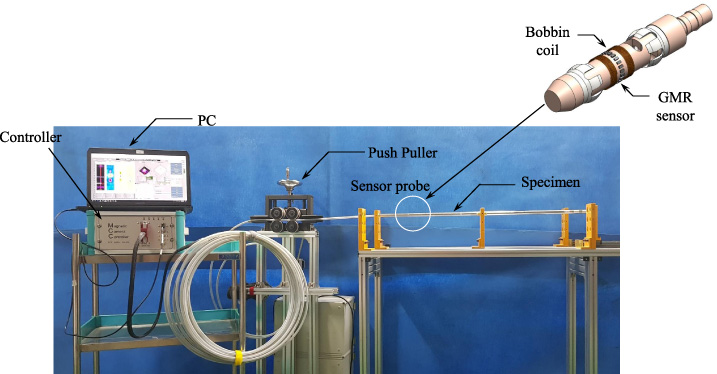
Sensor assembly and experimental setup.
Figure 5 presents the absolute value distribution of Re (r, 𝜙, z), Im (r, 𝜙, z), Z (r, 𝜙, z), and 𝛷(r, 𝜙, z), which were measured and calculated by GMR sensor array when AC of 100 mA at 50 kHz was applied to differential-type bobbin coils. The lift-off (the distance between the sensor and the specimen) is 0.715 mm. Wears (A, B), round hole (C), notches (D, E), dent (F), steam cut (G), flat bottom holes (H, I, J, K, L), and grooves (M, N) are detected. In addition, we can realize that the shape and intensity of the absolute value distribution of Re (r, 𝜙, z), Im (r, 𝜙, z), Z (r, 𝜙, z), and 𝛷(r, 𝜙, z) are different in accordance with shape (A ∼ G) and depth (H ∼ L) of defect.
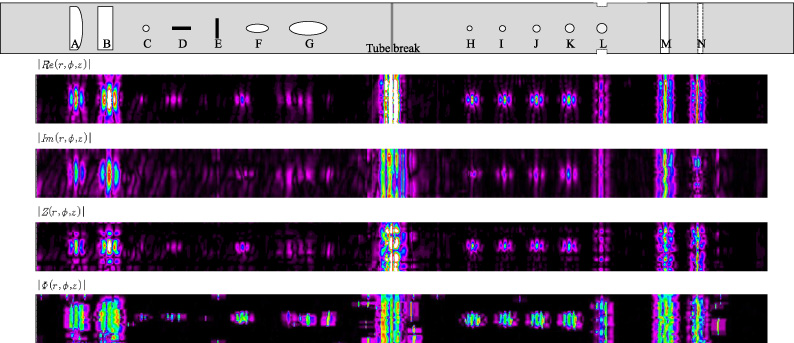
Distributions of amplitude and phase angle difference depending on defect type.
Figure 6 shows the stretched view of the distribution and the cross-section of Re (r, 𝜙, z) in the defect area. In case of tapered wear (A) and flat wear (B), the magnetic field was distorted in a wide region in the circumferential direction. In addition, the magnetic field distortion of a tapered wear in the left and right side is different each other, whereas that of a flat wear is parallel. The flat bottom holes (C, H, I, J, K, L) has a relative large distortion in the center of defect, but a relatively small distortion of magnetic field occurred in the circumferential direction compared to wears. The four flat bottom holes spaced 90° apart around the tube also can be distinguished clearly. The axial notch (D), compared to the circumferential notch (E), has a relatively long shape of magnetic field distortion and the size of magnetic field distortion is also large. On the other hand, dent (F) and seam cut (G) have a relatively narrow width of magnetic field distribution compared to wears. Most of all, steam cut has remarkable feature. That is, generally bobbin probe is difficult to detect steam cut, however, GMR sensor can detect it easily. The grooves (M, N) show defect indicating signals in the circumferential direction throughout 360°.
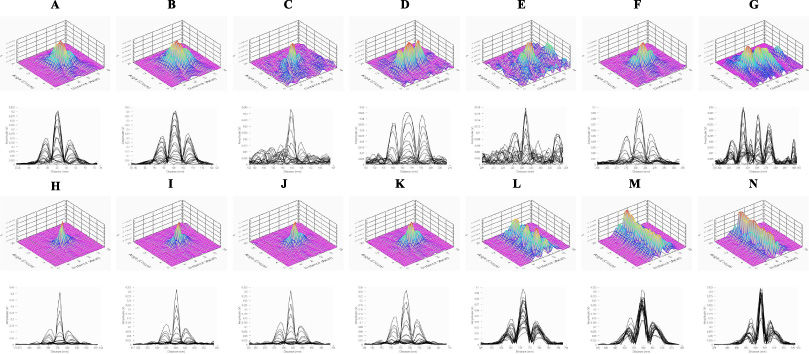
Stretched view of real component of impedance depending on defect type.
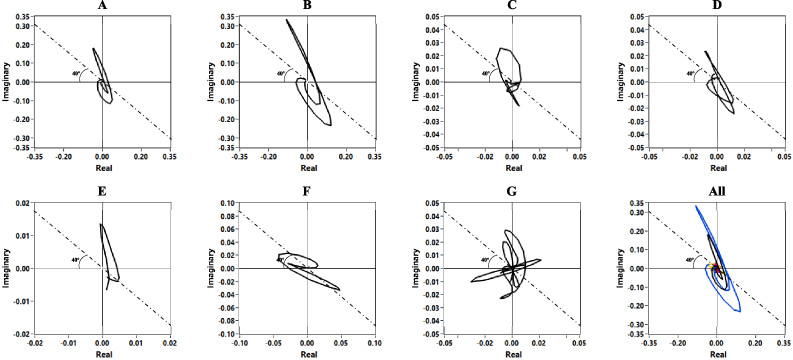
Lissajous plots depending on defect type (defect A ∼ G).
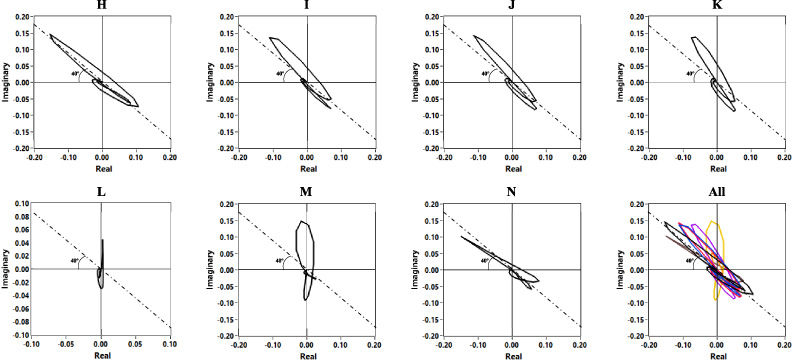
Lissajous plots of ASME calibration standard (defect H ∼ N).
Figure 7 presents the output of the GMR sensor near the center of defect by the Lissajous curve which plots the Re (r, 𝜙, z) and Im (r, 𝜙, z) component of impedance continuously along the transverse and the longitudinal axis. In the Lissajous plot, the volumetric defects (A, B, C, G), axial crack (D), and circumferential crack (E) indicate the phase angle larger than 40°, whereas the dent indicates 30.8°, when the output signal (phase angle difference) of 100% through wall hole (H) is adjusted to 40°. Figure 8 presents the Lissajous plot of the outputs of GMR sensor that scans the vicinity of the center of the defects (H through N), when AC of 50 kHz is applied to the differential-type bobbin coils. Unlike flat bottom holes (FBHs), grooves M and N indicate the continuous value of Z (r, 𝜙, z) and 𝛷(r, 𝜙, z). When the output signal of the through wall hole (H) is set to 40°, here is a phase angle difference depending on the defect depth regardless of the size of FBH. The change of phase angle difference according to the defect depth is shown in Fig. 9, and can be approximated as Eq. (6).
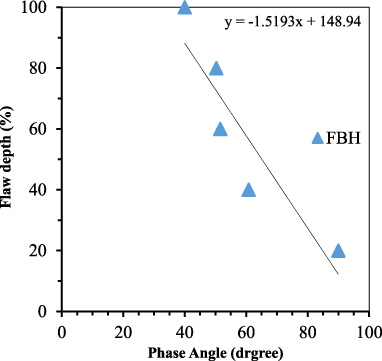
Relationship between depth and phase angle difference of defects.

Quantitative analysis of defect depth.
In this study, a nondestructive examination and evaluation system for high pressure feed water heater tubes in nuclear power plant was developed. A BIGiS consisting of differential-type bobbin coils and a GMR sensor array was used to effectively detect and characterize defects. GMR sensors without electromagnetic interference between sensors are densely arranged in a ring shape to increase the sensitivity of detecting defect signals. Differential-type bobbin coils were used to utilize the ability of the GMR sensors to detect magnetic flux density change in the axial direction. The output of the GMR sensors were decomposed to real and imaginary components using the signal processing circuits, and the amplitude and the phase angle difference distribution were calculated by arithmetic operations. These values measured inside the heat exchanger tube were indicated by unique patterns according to the shape of the defects. In addition, the defect location, i.e. ID or OD of tube, can be distinguished, and the defect depth can be quantitatively estimated within 9.44% error.
Footnotes
Acknowledgements
This research was funded by Korea Hydro & Nuclear Power Co. (KHNP L16S055000) and Korea Institute of Energy Technology Evaluation and Planning (KETEP 20171520101610). We are grateful for the supports.