
Abstract
This study proposes a method to probabilistically evaluate the area of coverage of nondestructive inspections to detect defects on a surface of a structure. For the specific problem, this study considers the effect of the distance between two neighboring scanning lines on the detectability of eddy current testing against near-side cracks. Thirty-eight type 316L stainless steel plates having a fatigue crack were prepared, and eddy current examinations were performed with a sufficiently fine scanning pitch. The full width at half maximum of the spatial distribution of the amplitude of the signals was approximated using a Gaussian function. A probability of detection model considering the distance between two neighboring scanning lines is proposed because in actual inspections a scanning line does not always run directly above a crack. The results demonstrated that the proposed model enables a reasonable probabilistic evaluation of the effect of the distance between two neighboring scanning lines.
Keywords
Introduction
Detecting a flaw is one of the most important roles of non-destructive inspections to assure the integrity of structures. In contrast, most non-destructive testing methods have a trade-off between the sensitivity and the area of coverage. Namely, using a highly sensitive probe leads to not only the detection of tiny flaws but also the need to perform the inspection with a fine scanning pitch or many probes. This creates difficulty in planning coverage paths to minimize the cost for the inspection while assuring the reliability of the results, especially when the target has a complicated profile [1–3].
Usually, the area of coverage of a probe for non-destructive inspections is evaluated using calibration blocks containing mechanically machined flaws with known dimensions [4]. However, several studies have pointed out the discrepancy between mechanically machined flaws, such as slits, and real flaws, such as cracks [5–9]. In general, the latter have much more complicated profiles than the former. Even though they have almost the same macroscopic boundary profiles (surface length and maximum depth) they would cause quite different signals, mainly due to microscopic characteristics, such as the roughness of the flaw faces, that are usually not measurable in real situations. This indicates that planning non-destructive inspections and evaluating their results based on the deterministically evaluated area of coverage would lead to unnecessary cost and even increase the risk from the viewpoint of all maintenance activities.
Based on this background, this study proposes an approach to probabilistically evaluate the area of coverage with the aid of the concept of probability of detection (POD) [10–12]. Specifically, this study con-siders eddy current inspections of fatigue cracks on a stainless steel plate and proposes a POD model to evaluate the effect of the distance between two neighboring scanning lines on the probability that the fatigue cracks are detected. Analyzing eddy current signals gathered in a laboratory test demonstrates the validity of the proposed model.
Sample preparation
Type 316L austenitic stainless steel plates manufactured in the same lot were prepared. The yield and tensile stresses of the plates were 280 and 554 N/mm2, respectively. The plates measured 170 mm in length, 70 mm in width, and 12 mm in thickness. An artificial slit with a depth of approximately 0.5 mm was introduced at the center of each plate using a fine cutter with a diameter of 89 mm to initiate fatigue, and the plate was subjected to cyclic four-point bending tests to introduce a fatigue crack. The distances of loading pins of these four-point bending test were 120 and 40 mm. After the tests, the plates were machined to reduce their thickness by approximately 1 mm to remove the artificial slit.
A total of 39 fatigue cracks were prepared. Table 1 lists the surface lengths and depths of these cracks and the loads and cycles used for introducing them. Their surface lengths were measured using a laser scanning microscope VK-X1000 (Keyence Corporation, Osaka, Japan). The depths were confirmed by gradually removing the surface with a milling machine until the fatigue crack disappeared after eddy current inspections. Thus, the depths shown in the figure would have an uncertainty of a few hundred micrometers. The table demonstrates a clear correlation between the lengths and depths of the flaws (R =0.899). Figure 1 presents a microscopic picture of a surface of one of the plates after the thickness reduction. Confirming the cracks with the naked eyes was difficult because of their small openings and the tiny curved grooves running in parallel caused by the milling for thickness reductions as shown in the figure.
Eddy current inspection
Eddy current signals due to the fatigue cracks were measured using a commercial eddy current instrument (aect-2000N, Aswan ECT Co., Ltd., Osaka, Japan) and a differential type plus point eddy current probe, illustrated in Fig. 2. The probe consists of two rectangular coils with a side length of 5 mm and width of 3 mm. The coils were situated perpendicular to each other; the probe outputs the difference in their impedances as signals. The exciting frequency and the lift-off were 100 kHz and 1 mm, respectively. The probe was attached to an XYZ stage controlled by a PC, so that one of the coils was parallel to a fatigue crack and scanned the surface of the sample two-dimensionally to gather signals with a pitch of 0.5 mm. The signals were calibrated so that the maximum signal due to a rectangular artificial mechanical slit with a depth of 5 mm and length of 20 mm became 1.0 V. The probe accelerated and decelerated rather quickly when it moved to the next scanning point to measure the signals due to the fatigue cracks so that the vibration of the XYZ stage polluted the signals, whereas the signals due to the slit were measured without such acceleration and deceleration so that they are free from noise.
After the measurements, signals across a flaw were extracted, and full width at half maximum (FWHM) of the amplitude was evaluated to confirm the effect of positional deviation between a probe and a flaw. Figure 3 shows the relationship between the depths of the flaws and the FWHM except the shallowest flaw (ID:38) whose signals were not clear enough to evaluate FWHM quantitatively. The solid and broken lines represent the regression line (with ±1 standard deviation). The dotted lines present 95% confidence bounds. The figure shows that FWHM can be represented as a probabilistic function of d as P1 (FWHM; d) using a normal distribution having a mean given as a linear function of the depth and a constant standard deviation. It should be also noted that this emphasizes that it would not be reasonable to plan scanning by postulating that the area of coverage is constant.
Fatigue cracks used in this study
Fatigue cracks used in this study
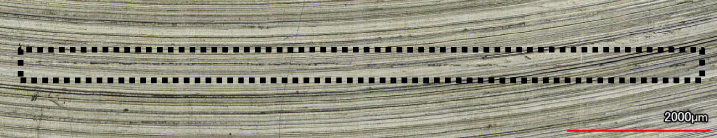
Microscopic picture of a surface of a stainless steel plate: the broken box indicates an introduced fatigue crack.
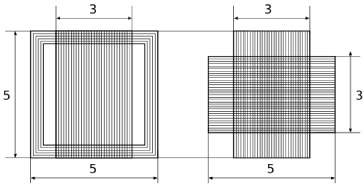
Eddy current probe used in this study (unit: mm).
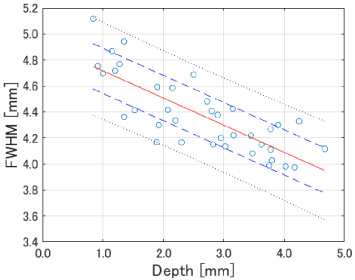
Results of regression analysis of the relationship between FWHM and the depth of a flaw.
Method
Because the lengths and the depths of the flaws were highly correlated as mentioned in Section 2, this study attempts to represent the POD as a function of a single flaw parameter (depth), as in the conventional POD approach [10–12], and avoids characterizing a flaw using multiple parameters [13–16].
Figure 4 presents the results of the regression analysis of the depth of a flaw and the square root of the amplitude of the signal due to the flaw. The square root was considered rather than the amplitude itself to satisfy the linearity and homoscedasticity needed for the regression analysis. The solid, broken, and dotted lines correspond to regression line, regression line ±1 standard deviation, and 95% confidence bound of the regression, respectively. According to this regression analysis, the distribution of the square root of the amplitude of a signal due to a flaw with a depth of d is represented using a normal distribution P2(a1∕2; d).
It is reasonable to assume that the relative position of a crack with respect to a scanning line, x, follows a uniform distribution, U (−s∕2, s∕2), where s stands for the distance between two neighboring scanning lines. Approximating the amplitude of eddy current signals across a crack using a Gaussian function whose FWHM follows P1 represents the decrease in the signal amplitude due to the positional deviation, F (x), as
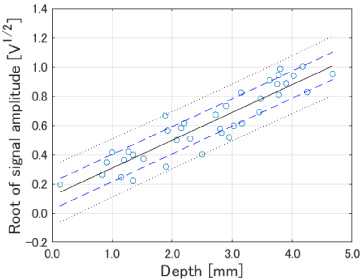
Results of the regression analysis of the relationship between the square root of signal amplitude and the depth of a flaw.
Figure 5 shows POD curve under an assumption that the distance between two neighboring scanning lines is sufficiently small (s = 0). This POD curve is essentially the same as the one obtained using the conventional POD model [10,11] because the effect of F (x) on POD vanishes. The Monte Carlo simulations to obtain the POD curve shown as the solid line took a few seconds on an ordinary Windows PC (CPU: Core i5-9400F); the bootstrap calculation for evaluating the 95% confidence bounds, shown as the broken lines, required approximately 2,300 seconds. The figure also presents two parameters commonly used to characterize the POD: a50, the size of a flaw with a 50% POD, and a90∕95, the minimum size of a flaw that can be detected in 90% of cases with 95% confidence.
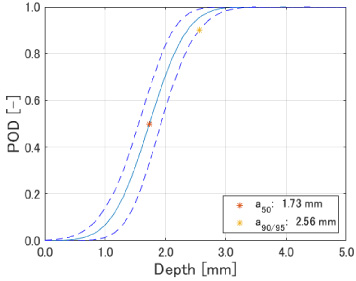
POD curve, s = 0 mm.

Four distributions when d =1.5 mm is used to calculate POD of s = 5 mm.
Figures 6 and 7 present the results of another POD analysis when s = 5 mm. The distributions of FWHM, F (x), a1∕2, and
Figure 8 shows the effect of the distance between two neighboring scanning lines, s, on a50 and a90∕95. The figure reveals that both a50 and a90∕95 remain almost unchanged if s < 2 mm. In contrast, a90∕95 increases rapidly when s >4 mm, while the increase in a50 is more gradual.
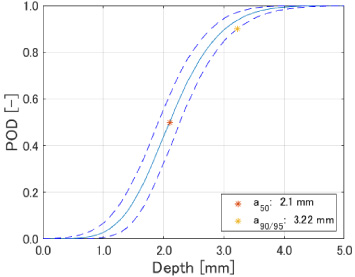
POD curve, s =5 mm.
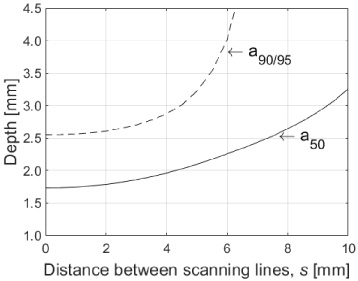
The effect of the distance between two neighboring scanning lines on a50 and a90∕95.
This study proposed a POD model that considers the distance between two neighboring scanning lines to probabilistically discuss the area of coverage in nondestructive inspections. The model was applied to evaluate the POD of eddy current testing against an artificial fatigue crack introduced into type 316L stainless steel plates. Analyzing the eddy current signals confirmed that the model can reasonably characterize the effect of the distance probabilistically.
Footnotes
Acknowledgements
The fatigue tests were performed at the Institute of Fluid Science, Tohoku University. The authors deeply appreciate Professor Tetsuya Uchimoto for his kind collaboration in performing the tests. The authors also thank Mr. Danqi Wang for his contribution in introducing the cracks into the plates. The laser scanning microscope used to evaluate the surface lengths of the cracks belongs to the Hashizume-Ito-Ebara-Cheng laboratory, Tohoku University.