
Abstract
This paper presents the three-dimensional modeling of soft magnetic composite (SMC) based on the discrete element method. The proposed method makes it possible to take the possible contact among the magnetic particles in SMC as well as the distributed particle size into consideration. Based on this modeling, the macroscopic B-H characteristics is computed with the finite element method considering magnetic saturation. It is shown that the three-dimensional model of SMC can have larger initial permeability in comparison with the two-dimensional model even if they have the same filling factor.
Introduction
Soft magnetic composite (SMC) composed of insulated metallic powder is widely used in electric machines and devices such as motors and inductors, because of its flexibility in manufacturing, cost effectiveness, and relatively low eddy current loss for higher harmonics. For the evaluation of the macroscopic permeability of SMC, the unit-cell approach and the method based on the Ollendorff formula have been proposed. In the former method, assuming that SMC is composed of periodic structures, the magnetic field in the unit cell which contains one magnetic particle is numerically analyzed to obtain the macroscopic permeability [1,2]. On the other hand, in the latter method, the macroscopic permeability is analytically computed from the Ollendorff formula that is derived under the assumption that the macroscopic field generated by the magnetization in the surrounding particles is uniform [3,4]. Moreover, SMC has been analyzed on the basis of the Maxwell-Garnett formula [5] that has been shown equivalent to the Ollendoff formula [6]. However, they have two limitations; it is difficult to consider the distribution in the particle radius while the actual SMC particles have distributed size, and the macroscopic permeability can be underestimated because the possible contact among particles is neglected [5]. To solve this problem, a method based on the discrete element method (DEM) [7] has been proposed [6]. In this method, the motion of the particles with distributed radius is analyzed to obtain the final configuration. Then, the macroscopic magnetic property of SMC is analyzed by applying the finite element method (FEM) to this model. This method makes it possible to take both particle inhomogeneity and contact among the particles into account. However, there remain two problems; magnetic saturation of the SMC particles is not considered, and SMC is assumed to be two-dimensional while the absence of three-dimensional magnetic paths would affect the magnetic characteristics [8].
In this paper, we propose a three-dimensional model of SMC based on DEM. Using this method, we evaluate the macroscopic B-H characteristic of SMC considering magnetic saturation. Moreover, we discuss the difference in the magnetic property obtained from the two- and three-dimensional models.
Modeling method
Discrete element method
In DEM [7], we analyze the dynamical motion of particles considering the mutual mechanical interactions. The equations of motion given by
Particles with different radii are set in a domain randomly. The collision between particles is detected from the criterion By solving (1) and (2), the new particle positions and velocities are computed. A spring damper system is assumed between the two particles. Return to step 2 if the number of steps does not exceed the given number; otherwise, procedure is stopped.
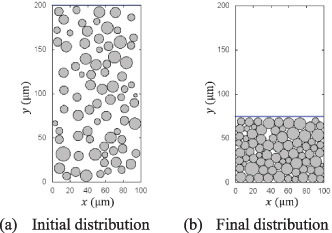
First, we consider the two-dimensional modeling of SMC. We generate particles whose size obey the Gaussian distribution, with average radius of 5 μm, and standard deviation of 1.2 μm. The particles are placed randomly in a 100 μm × 200 μm domain avoiding overlapping of particles. We also place a free-falling mass bar above all the particles. By analyzing the time evolution of the particles as well as the mass bar in a gravitational field through the above-mentioned procedure of DEM, we eventually obtain the final particle configuration which is assumed to be a model of SMC. The physical parameters for DEM are summarized in Table 1. The parameters are tuned so that the system falls into the final state after sufficient randomization of the particle positions [6].
Figure 1(a) shows the initial distribution of particles, while Fig. 1(b) depicts the final distribution after 160,000-step analysis. The domain 𝛺 below the mass bar, represented by the solid line, which includes 80 particles, is regarded as the model of SMC. Note that the final distribution depends the initial configuration of the particles, although there would not be significant differences in the magnetic property of the resultant SMC models [6]. We performed five simulations in total to obtain the results shown in Fig. 2.
Two-dimensional modeling result (First trial).
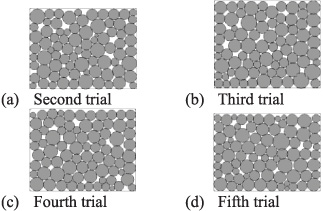
Additional modeling results (Two-dimensional).
Physical parameters for DEM
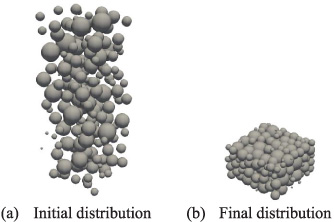
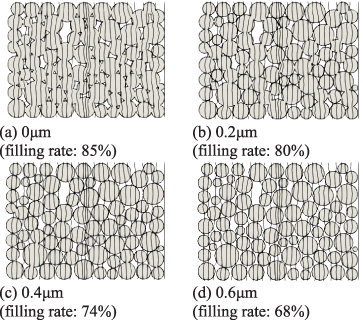
To consider the possible contacts between the particles in a more realistic way, we extend the two-dimensional model to the three-dimensional model. We basically use the same procedures and parameters as those in the two-dimensional case, whereas the standard deviation in the particle radius is changed to 1.8 μm to keep the filling rate unchanged. The SMC domain 𝛺, which includes 200 particles, is now 70 μm × 70 μm × 180 μm. Figure 3(a) and (b) show the initial and final particle distributions, respectively. The distributions resulted from different random seeds are shown in Fig. 4.
Three-dimensional modeling result (First trial).
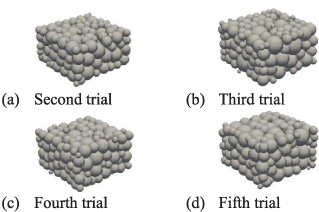
Additional modeling results (Three-dimensional).
Formulation
We assume that SMC has a periodic structure whose unit cell corresponds to the models obtained by DEM. Moreover, SMC is assumed to be immersed in a uniform magnetic field. We analyze the magnetostatic field over the SMC domain 𝛺 by solving
In the SMC model, there can exist small overlaps among particles owing to the numerical errors in DEM. The actual SMC particles are coated with a thin insulating layer on the surface, whereas it can be partially broken in the manufacturing process. In the result, the SMC particles can have partial contacts among them. We model these local contacts as the overlaps among the particles. To evaluate the effect of the insulating layer, we simply set the permeability in the surface layer of SMC particles to μ0, the permeability of vacuum [6]. When the assumed thickness is larger than the overlapping depth, there are no contacts among the particles.
Numerical results
B-H characteristic of two-dimensional model
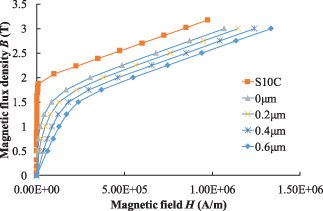
The homogenized B-H curve is computed for the two-dimensional model shown in Fig. 1. It is assumed that the particles are made of S10C and insulation thicknesses takes 0 μm, 0.2 μm, 0.4 μm, and 0.6 μm. Fig. 5 shows the homogenized B-H curve obtained from (9) where the B-H curve of S10C is also plotted for reference. In the process of the Newton–Raphson iteration for the nonlinear field computation, the magnetic flux density can take fairly large values. Moreover, it can become rather large, for example, near the conductor edges in an inductor. For these reasons, the B-H characteristics in Fig. 5 are plotted in a wide range. In Fig. 5, it can be seen that the permeability decreases with increase of the thickness of the insulating layer. The slopes of the B-H curve for all the insulation thickness for sufficiently large applied field are nearly equal to that of the slope of S10C.
B-H characteristic of 2D-SMC model.
The flux line in the SMC model is shown in Fig. 6, where the magnetic field is 2 T. With increase of the thickness of the insulation layer, the magnetic resistance increases to decrease the magnetic fluxes.
Flux lines when changing thickness of insulating layer.
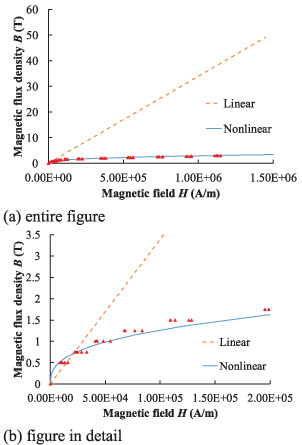
In Fig. 7, we compare the B-H characteristics for the nonlinear and linear models where the thickness of insulation layer is 0.2 μm. The macroscopic permeability is set to 27 for the latter model [6]. Moreover, the triangles represent the results obtained by the homogenization method, while the regression curve is represented in a solid line. We can see that there is a considerable difference between both curves especially for the high-field region. Figure 8 shows the flux lines for both cases. Since the magnetic field is not well saturated in the linear model, the flux concentrates at the contact points and can pass though the inside of the SMC particles easily. In contrast, in the nonlinear model, because the deep magnetic saturation occurs at the contact points, the magnetic field has a rather uniform distribution.
Comparison of nonlinear analysis with linear analysis.

Flux lines for linear and nonlinear analysis.
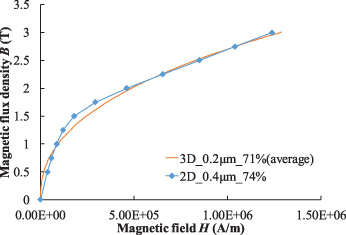
We compute the homogenized B-H curve for the three-dimensional model shown in Fig. 3. The particle material is again assumed to be S10C and the insulation thickness is set to 0.2 μm. In addition, since it is hard to analyze the entire domain of the model due to considerable number of finite elements, the domain 𝛺 is limited to 50 μm × 50 μm × 42 μm in this computation.
Figure 9 shows the homogenized B-H curve obtained by the proposed method. The filling rates are represented in Fig. 9. For reference, the B-H curve for the two-dimensional SMC model with near similar filling rate is also plotted. Note that, for the three-dimensional model, the filling rate means the volume filling rate, whereas the filling rate for two-dimensional model represents the area filling rate. This is the reasons why the filling rate of the former model is less than that of the latter model. The B-H characteristics for deep saturation seem to depend just on the filling rate. On the other hand, the two models have the different initial magnetic characteristics. To make clear this point, the B-H characteristic is plotted for the magnetic induction ranging from 0T to 1.6 T in Fig. 10. It can be seen that the three-dimensional model has relatively high permeability for the weak magnetic field. On the other hand, when the magnetic flux density becomes stronger, over 1 T, its permeability drops down more rapidly than that of the two-dimensional model. The reason for these properties would come from the different spatial structures. When the applied magnetic flux density is relatively low, there can be more magnetic local paths among the neighboring particles in the three-dimensional model. This leads to the higher magnetic permeability. As it becomes stronger, however, the effect of saturation blocks the local magnetic concentration so that the permeability goes down rapidly. Figure 11 shows the magnetic flux density in the three-dimensional SMC model when the magnetic induction is 1 T and 1.5 T. In Fig. 11(a), the magnetic field are not deeply saturated, and the magnetic permeability is kept relatively high. In contrast, in Fig. 11(b), the magnetic field seems to be deeply saturated, and the resultant magnetic permeability is relatively low. This tendency is consistent with that reported in [8]; the two-dimensional SMC model has lower magnetic permeability than the measured value for weak magnetic fields.
B-H characteristic of 3D-SMC model.
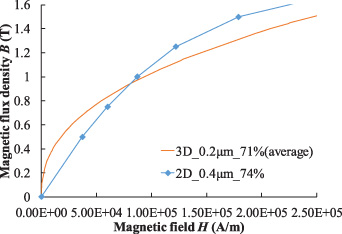
B-H characteristic of 3D-SMC model (in detail).

Magnetic flux density of 3D-SMC model.
In this study, two-dimensional and three-dimensional SMC models based on DEM are studied considering the magnetic contact among particles as well as the inhomogeneity in the particle radius. By the homogenization method, the macroscopic B-H characteristic of SMC models is obtained taking the magnetic saturation into account. It is found that the three-dimensional model has higher magnetic permeability for weak applied field than the two-dimensional model. This is consistent with the result reported in [8] which compares the measured and computed B-H characteristics based on the two-dimensional SMC model.
In future, we plan to analyze the three-dimensional model with consideration of the eddy current and the displacement current to evaluate the characteristic at high frequencies.