
Abstract
Coated conductive structures play an important role in such industrial fields as aerospace, energy, chemical engineering, etc. Because of the corrosive and hostile environments, the corrosion which is normally hidden under the conductor coating, occurs in the surface of the in-service structure. It poses a severe threat to the integrity and safety of the structure. Therefore, it is imperative to effectively detect and quantitatively evaluate the hidden corrosion via Non-destructive Evaluation (NDE) techniques. Pulse-modulation Eddy Current technique (PMEC) has been identified to be superior to other electromagnetic NDE methods, particularly regarding evaluation and imaging of corrosion. Whereas, the acquired corrosion images hardly indicate the true opening profile of the corrosion. This hinders the quantitative evaluation of the corrosion. In light of this, in this paper PMEC along with the image processing technique for imaging and evaluation of corrosion in coated conductors is intensively investigated. The image processing technique is proposed based on Theta Map (TM) which is a processing method for quantifying the source parameters of magnetic data that describe the anomalous structure. The validity of PMEC combined with modified TM for profile recognition and assessment of hidden corrosion in nonmagnetic structures is identified via experiments.
Keywords
Introduction
Conductive structures of such nonmagnetic materials as Copper, Aluminum, etc. have been extensively adopted in engineering fields including aerospace, energy, petrochemical, transportation and so on. Over their surfaces, the nonconductive coatings are usually deployed for protection against corrosion and abrasion. Nevertheless, the hostile environment leaves the in-service coated conductor vulnerable to such anomalies as the hidden corrosion, which resides under the protection coating and occurs in the conductor surface. This defect severely undermines the structural integrity and safety of the conductive structures, making the traditional Non-destructive Testing (NDT) techniques such as Penetrant Testing (PT) [1], Magnetic Particle Testing (MT) [2] and Visual Testing (VT) [3] incapable of detecting and evaluating the hidden corrosion. In light of the conductive characteristics of the structure, Electromagnetic NDT techniques involving Eddy Current (EC) [4] and Pulsed Eddy Current (PEC) are found to be advantageous over the aforementioned methods and could be preferable for evaluation of hidden corrosion in coated conductors.
Therefore, it is necessary to adopt feasible NDT techniques for effectively detecting and quantitatively evaluating the hidden corrosion. Electromagnetic induction does not exist in the nonconductive coating which means the coating can be considered as inexistence. Therefore, Electromagnetic Non-destructiv Testing (ENDE) techniques is superior to other NDT techniques such as Ultrasonic Testing [5], Infrared Testing [6], etc. As an ENDE technique, Pulsed Eddy Current testing (PEC) has an advantage over other NDT techniques in detection and quantitative evaluation of defects in conductive structures. Gao et al. proposed a novel weak coupling sensing structure of PEC, which obviously improves the ability to detect deep subsurface defects of ferromagnetic materials [7]. The novel features of PEC signal extracted by Nafiah et al. are capable of defining crack depth and inclination angles simultaneously [8]. Ulapane et al. propose a ferromagnetic material thickness quantification method based on the decay rate of the PEC sensor detector coil voltage [9]. Fu et al. proposed a new approach based on the dynamic trajectories of the fast Fourier transform of the received PEC signals for inspecting of internal and surface defects [10]. In an effort to further enhance the testing sensitivity and evaluation accuracy of PEC, Pulse-modulation Eddy Current technique (PMEC) has been proposed. The advantages of PMEC over PEC in terms of imaging and quantitative evaluation of hidden corrosion in planar and tubular conductors have been identified [11].
Following previous research, in this paper the PMEC-based imaging of corrosion hidden underneath the protection coating of the coated conductor is intensively investigated. The modified Theta Map is proposed for processing of the acquired raw images of hidden corrosion. The feasibility of the proposed algorithms for recognition and quantitative evaluation of the corrosion opening profile are investigated through experiments.
Modified Theta Map
The Theta Map (TM) is an image processing technique for magnetic mapping in geophysics [12]. It is derived from the analytic signal, that highlights magnetic contacts in the acquired 2D Total Magnetic Intensity (TMI) image. The analytic signal of a TMI is normally written as:
On account of the fact that: (1) the main axis of the net magnetic field in PMEC is in z direction; and (2) utilization of both gradient and absolute fields could improve the mapping results [13], the z-component of the magnetic field i.e., B
z
is thus employed and substituted for ∂f∕∂z in Eq. (2). This brings about the modified TM which gives a new Theta written as:
In the experiments, a PMEC system has been built up for imaging and evaluating the hidden corrosion via the modified Theta Map. In order to simulate corrosion in coated conductors, a series of specimens of aluminum alloy with square-shaped corrosion hidden beneath the nonconductive coating are fabricated for the experimental investigation.
System setup
The PMEC inspection system for profile recognition and quantitative evaluation of hidden corrosion has been built up. The schematic illustration of the system is portrayed in Fig. 1. The system consists of a signal generator (Tektronix AFG3022C), power amplifier (NF HSA4014), PMEC probe, signal amplifier (NF P-65), filter (NF P-61), data acquisition card (ADLINK PCI-9812) and PC. The inner and outer diameters, height and number of turns of the excitation coil for generating the incident magnetic field are 20.2 mm, 24.4 mm, 26.3 mm and 2451, respectively. A magnetic field sensor (MultiDimension TMR-MMLP57F) is deployed at the bottom centre of the excitation coil for picking up the PMEC signals of the vertical component of the net magnetic field, i.e., B z . The maximum amplitude, carrier-wave frequency, modulation-wave frequency and duty cycle of the excitation current driving the excitation coil of the probe are chosen as 30 mA, 800 Hz, 80 Hz and 50%, respectively, as per the strategy regarding the excitation parameters [14].

The schematic illustration of the inspection system.
Four planar specimens of aluminium alloy 6061 with the size of 210 mm × 210 mm × 4 mm (length × width × thickness) are employed in the experiments. Square-shaped volumetric defects simulating localized corrosions with the perimeter of 20 × 20 mm and depths of 1 mm (Corrosion #1), 2 mm (Corrosion #2), 3 mm (Corrosion #3) and 4 mm (Corrosion #4) are fabricated on the upper surface of each specimen A nonconductive thin slice with the thickness of 0.5 mm is used to simulate the protection coating, and deployed in between the probe bottom and specimen surface.
During experiments, the PMEC probe scans over the corrosion area (with a perimeter of 60 × 60 mm) of the specimens with the spatial resolution of 1 mm. At every scanning position, the PMEC signal is obtained, and subtracted into the reference signal when the probe is placed over the corrosion-free area for acquiring the differential signal. The reference signal and signals when the probe is right over the centre of the corrosion are shown in Fig. 2(a) whilst the acquired differential signals are portrayed in Fig. 2(b). It can be observed from Fig. 2(a) that the magnitude of the PMEC signal is directly proportional to the corrosion depth. This is due to the fact that when the corrosion depth increases, more eddy currents are perturbed, leaving the eddy-current-induced magnetic field (opposing the incident magnetic field) further weakened. In regard to the differential signals, as can be seen in Fig. 2(b), the amplitude of the differential signal as well as its extremum i.e., Peak Value (PV) rises as the corrosion depth increases. Therefore, PVs at different scanning positions are adopted as the image pixels during production of the hidden-corrosion image. The raw image of each corrosion is portrayed in Fig. 3 together with the true corrosion opening profile indicated by the red dotted line.
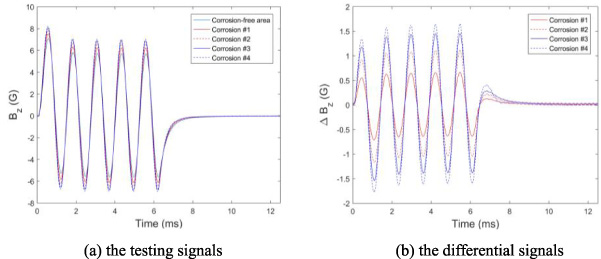
Experimental signals of PMEC.
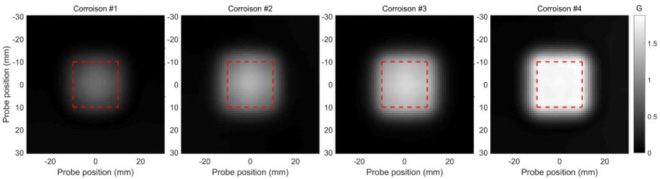
Raw images of hidden corrosion.
It can be seen from Fig. 3 that although the square-shaped corrosion profile can be roughly indicated by intuitive observation of the raw image for the corrosion with larger depth the opening profile of the shallow corrosion such as Corrosion #1 could be mistakenly identified as the circular shape. This is due to the dissipation of the electromagnetic field within the conductor. In an effort to enhance the image contrast in the region where the hidden corrosion resides, the modified TM is employed in processing of the raw corrosion image. The processed corrosion image regarding every corrosion scenario is exhibited in Fig. 4. As can be observed from Fig. 4, with the modified TM the pixel values vary significantly on different sides of the corrosion profile, resulting in high gradient of the pixel value over the profile boundary. This benefits the enhancement in image contrast and thus the accuracy in profile recognition. It is noticeable from Fig. 4 that the square-shaped corrosion profile can be readily identified, regardless of the corrosion perimeter.
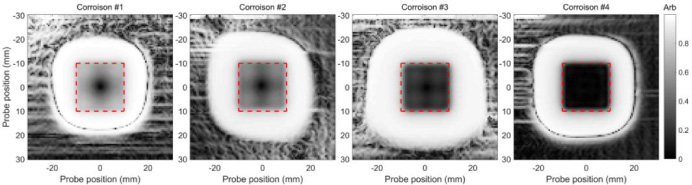
Processed corrosion images via the modified TM.
However, it is still formidable to quantitative evaluate the corrosion opening profile by using the derived images from the modified TM, since the processed corrosion image presented in Fig. 4 has considerably discrepancy, compared with the true corrosion image. In light of this, the Canny algorithm [15,16] is used as an alternative method for processing the raw corrosion image. The Gauss filter in the Canny algorithm is used to smooth the image by reducing spurious edge response caused by noise. It can be written as:
Recognition of raw corrosion images via Canny algorithm.
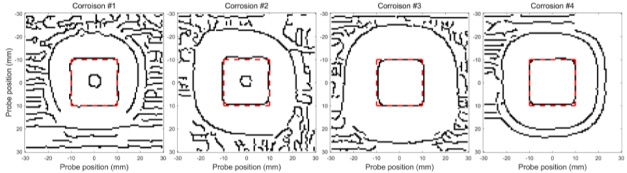
The recognized profiles of raw corrosion images via Canny algorithm, which are indicated by the black solid lines are shown in Fig. 5. It can be seen from Fig. 5 that even though the hidden corrosion can be localized, the area of the recognized corrosion profile varies with the corrosion. It is also noticeable that the corrosion regions depicted by the yellow solid lines are much larger than the true corrosion profile implied by the red dashed lines. This indicates that the corrosion profile is overestimated by merely using Canny algorithm, which subsequently would give rise to the overestimation in sizing the corrosion profile.
The profile recognition of the corrosion imaged by the improved TM via Canny algorithm.
In order to mitigate the overestimation of the corrosion region, the derived images from the modified TM (portrayed in Fig. 4) in lieu of the raw images (shown in Fig. 3) are processed by using the Canny algorithm. The processed images are presented in Fig. 6. It can be observed from Fig. 6 that: (1) the hidden corrosion can be accurately localized; and (2) the recognized corrosion profile agrees well with the real corrosion profile, apart from the phantoms i.e. spurious edges distributing around it. It is noteworthy that the true corrosion profile has 80 real edge pixels, compared with the recognized corrosion profiles of Corrosion #1, Corrosion #2, Corrosion #3 and Corrosion #4 composed of 885, 688, 650 and 510 edge pixels, respectively. The discrepancy between the number of pixels regarding the real corrosion profile and that of the recognized profile is resulted from the phantoms that manifest themselves due to the extraneous noise leading to the low SNR of the PMEC differential signal particularly in the corrosion-free area. It has been found that the SNR of the PMEC differential signal declines as the corrosion depth is decreased. This is because the amplitude of the differential signal is directly proportional to the corrosion depth, and can readily be polluted by the noise particularly when it drops under the noise level.
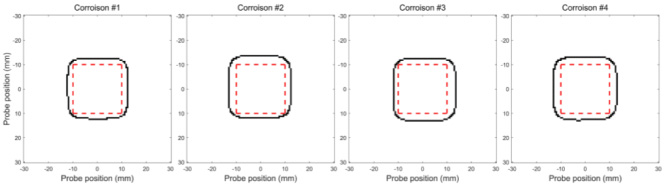
In order to eliminate the phantoms, the values of the pixels within the processed image are firstly normalized to one, following which the pixels corresponding to the normalized corrosion image with values greater than the threshold of 0.5 are retained and used for reproduction of the images for profile recognition and sizing whilst those less than the threshold are discarded. The final image-processing result is shown in Fig. 7. It is found from Fig. 7 that the recognized corrosion profiles have good agreement with the true corrosion profiles, inferring that with the image-processing method based on the modified TM in conjunction with the Canny algorithm the profile of hidden corrosion can be identified without much loss in accuracy.
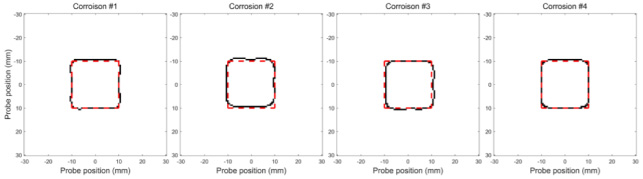
Recognition of corrosion profile via thresholding.
Based on the image-processing results presented in Fig. 7, the corrosion area can be further approximated. The estimated corrosion areas of Corrosion #1, Corrosion #2, Corrosion #3 and Corrosion #4 via Canny algorithm together with the improved TM are 434 mm2, 421 mm2, 404 mm2 and 400 mm2, respectively. The average relative error of the estimated corrosion area is 3.69%. In contrast, the approximated corrosion areas of Corrosion #1, Corrosion #2, Corrosion #3 and Corrosion #4 via Canny algorithm are 599 mm2, 631 mm2, 633 mm2 and 645 mm2, respectively. The average relative error is up to 56.75%. This implies that the accuracy regarding quantitative evaluation of the hidden corrosion particularly the in-plane sizing is considerably enhanced by using the image processing method integrating the Canny algorithm with modified TM, which could subsequently benefit the out-of-plane sizing such as assessment of the corrosion depth.
In this paper, a PMEC system is built up for imaging and quantitative evaluation of the corrosion hidden inside the coated conductors. The TM originally dedicated to quantification of the source parameters of magnetic data that describe the anomalous structure is modified and adopted for enhancement regarding the image contrast of the acquired raw corrosion images via PMEC. In a bid to improve the accuracy in profile recognition and quantitative evaluation of the hidden corrosion, the image processing method integrating the modified TM with Canny algorithm is proposed. The experimental results reveal the superiority of the proposed method over that without the modified TM in terms of high-accuracy identification of the corrosion profile and assessment of the corrosion opening area.
Footnotes
Acknowledgements
The authors would like to thank the National Natural Science Foundation of China (Grant No. 51777149, 11927801), National Key R&D Program of China (Grant No. 2017YFF0209703), and Fundamental Research Funds for the Central Universities of China (Grant No. XJJ2018027) for funding this research.