
Abstract
Eddy current testing (ECT) is commonly used in steam generator tube inspection. Among multiple probes applied in this area, array probe shows the merit of the capability of obtaining a C-scan image in a simple linear scan. In this work, a novel array ECT probe with three-phase excitation is proposed. The probe consists of two rows of excitation coils and a row of pickup coils. The induced eddy current shifts electrically in the testing sample so that the necessity of multiplexer is eliminated, resulting in advantages of lower cost, less noise and faster inspection speed. Theoretical analysis indicates that the background signal of the array sensor would be small. A 3D finite element method (FEM) model is developed to study the operating principle and to predict the inspection performance of the probe. A prototype probe has been developed and tested, by which a steam generator tube sample with different kinds of defects was inspected. The experiment results validate the simulation model and further demonstrate the feasibility of the sensor.
Introduction
Steam generator (SG) is one of the most critical components of nuclear power plant, which contains thousands of tubes. These tubes transfer heat from the primary side coolant flowing through the reactor core to the secondary side clean water to produce steam to drive turbines for electrical power production [1]. These tubes are not only the heat exchanger but also a barrier between the two sides against the radioactive matters. This makes the integrity a vital concern for the safe operation of the nuclear power plant. However, harsh working environment such as high temperature, high pressure, strong radiation and vibration poses serious challenges to the integrity of these tubes. All these conditions may lead to several kinds of defects in the tube wall, denting, pitting, fretting wear, axial or circumferential outside diameter stress corrosion crack (ODSCC) etc., for instance [2]. Thus, periodic inspection is essential for the safe and reliable operation of the power plant.
Among plenty of inspection techniques, eddy current testing is commonly applied in SG tube inspection. Due to the advantages like high inspection speed, high sensitivity, noncontact, relatively low cost and so on, ECT is wildly applied in material sorting, thickness measurement, nondestructive inspection and many other aspects. For the SG tube inspection, there are mainly three kinds of ECT probes. Bobbin probes have simple structures and fast scanning speed, and are cheap also. However, they are not sensitive to circumferential defects. Rotating probes are sensitive to flaws in all orientations with their spiral scan path to cover all directions. In contrast, the scan is much more time-consuming and demands complex motion control. To cover a larger area in a simple scan path, probes with multiple coils arranged in array form were designed and adopted [3]. Commercial array probes like X-probe [4] are extensively applied in SG tube inspection. Though a C-scan image can be obtained in a line scan, most current array probes need multiplexers to switch the excitation channels and complex circuit to process the output signals. To reduce the complexity of the circuit, and enlightened by the rotating field probe design of Junjun Xin et al. and Chaofeng Ye et al. [5–7], we proposed a novel array probe in tube inspection with three-phase excitation which eliminates the necessity of excitation switching through multiplexer.
Principle
The structure of the probe is shown in Fig. 1. For the sake of simplicity of description, we flattened the probe model into a plate form, as shown in Fig. 2. The probe consists of two rows of excitation coils and one row of pickup coils which are located in the middle of the two rows of excitation coils. Let us start from a unit of the array shown in Fig. 3, which contains three excitation coils and one pickup coil, to interpret the principle. The centers of the three excitation coils are placed at the three vertices of a regular triangle Δ
ABC
, which are rendered in red, yellow and blue respectively as is shown in Fig. 3. The excitation coils are driven by three-phase current source I
A
, I
B
, I
C
with the separation of 120° in phase as described in Eq. (1), where I0 is the amplitude of the excitation current and ω is the angular frequency.
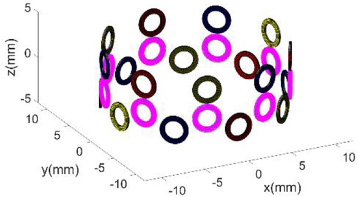
3D schematic of the three-phase excitation.
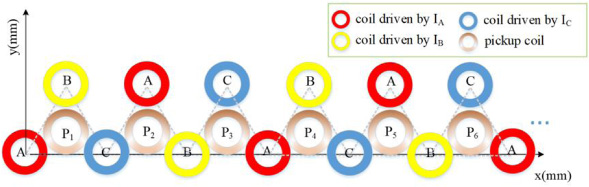
Flattened form of the array probe.
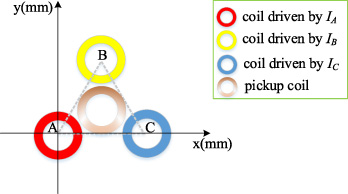
A unit of the array.
Since the three-phase excitation current is identical in amplitude, the outputs of the pick-up coil when the excitation coil A, B, C works individually can be denoted as v
A
, v
B
, v
C
respectively, as expressed in Eq. (2), where v0 is the amplitudes of the outputs. Therefore, the net output voltage v
p
is the sum up of the three components as Eq. (3) shown and theoretically should be vectorial zero if the unit is interacting with a defect free sample when all the conditions remain symmetry. This indicates the background signal of the probe is small, which is a significant advantage of this probe design.
Then let us turn attention back to the array case. The array consists of two rows of excitation coils arranged in an A-B-C sequence in each row. The two rows of excitation coils are dedicatedly arranged as shown in Fig. 2. The pickup coils are placed in a row and each of them is located at the very center of the corresponding triangle formed with the three adjacent excitation coils. Based on previous analysis of a unit, the output of the pickup coils is, even not completely, counteracted to a large extent. Thus, the background signal of this probe is relatively small compared with conventional ECT probes. If there is a defect existing, the disturbance of the induced eddy current will be captured by the measurement of the pickup coils with stronger discrimination to the background signal than other conventional probes.
With the phase difference of the three-excitation currents, the peak value I0 is reached by I A , I B , I C in alternate. At the same time, the three-phase excitation coils are located by the current peak alternately spatially. Thus, the induced eddy current will follow the shift of the phase of the excitation currents. Therefore, it is seen that the induced eddy currents shift electrically in the conductive sample eliminating the necessity of multiplexer. Defects under the sensor will disturb the distribution of the eddy current, resulting in a disturbance voltage measured by the pick-up coils.
FEM model
A 3D finite element model was built to study the performance of the probe. Reduced magnetic vector potential (RMVP) formulation [8,9] was applied in the model. The governing equations are shown in Eq. (4) and (5).
This RMVP formulation separates the excitation source and the induced field, which indicates that there is no need to regenerate mesh at different scan positions. This method of modelling reduces the mesh noise and computation time significantly.
The model consists of 9 coils in each row. The inner and outer diameter of the coil were set to be 2 mm and 3 mm respectively. The spacing between the centers of every two adjacent excitation coil was 5.8 mm. The excitation coils were driven by three-phase current sourc I A , I B , I C as described in Eq. (1), where I0 was set to be 0.15 mA and the excitation frequency was 60 kHz.
Figure 4 shows the tube model with inner diameter (ID) defect. The conductivity, relative permeability and relative permittivity of the sample were 9.69 × 10⁵ S/m, 1 and 1 respectively. The outer diameter of the tube was 19.04 mm and inner diameter was 16.86 mm. These parameters were in accordance with a kind of SG tube used in nuclear power plant. A cylindrical coordinate system with origin located at the volumetric center of the tube was applied, as shown in Fig. 4.
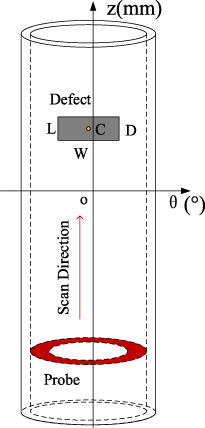
Schematic diagram of the simulation model.
Three types of defects were investigated in the simulation, namely: (1) axial notches, (2) circumferential notches and (3) flat bottom holes. It should be noticed that only single defect was modeled in each simulation. Parameters of the defects are listed in Table 1, where L, W, D, C stand for the axial length along z-axis, circumferential length, depth (percentage of tube wall thickness) and the cylindrical coordinate of the center of the defect respectively.
The parameters of the defects in different simulation case
To understand the operating principle of the three-phase array probe, the induced eddy current generated by the array probe in flattened form in a defect free plate sample was calculated. The three-phase excitation currents are shown in Fig. 5. The induced eddy currents at five consecutive time 0, T0∕12, T0∕6, T0∕4 and T0∕3 are presented in Fig. 6(a)–(e), where T0 =1∕f is the period of the excitation current.

Waveform of the three-phase excitation currents.
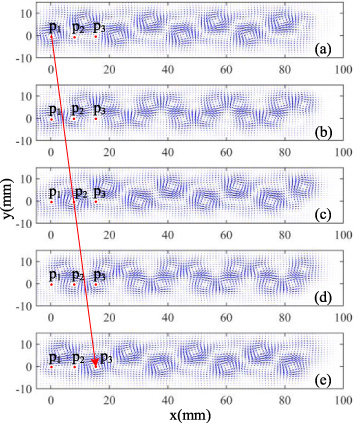
Simulation result: induced eddy current in the conductive sample at five consecutive time: (a) 0; (b) T0∕12; (c) T0∕6; (d) T0∕4; (e) T0∕3.
Here the amplitude and direction of the eddy currents are presented by the density and direction of the arrows in the figures. Taking the distributions of the induced eddy current in the three positions (p1, p2 and p3 shown in Fig. 6) as an example, a circular eddy current appears centered at p1 in Fig. 5 (a). After T0∕6 time, eddy current centered at p2 achieves the same density in Fig. 5 (c). Then it shifts to the p3 in Fig. 5 (e). The eddy currents at different positions change periodically make it seem like the eddy current shifts electrically. This indicates that such design can eliminate the necessity of multiplexer to switch the excitation coils.
The array probe scanned along the z-axis inside the tube with a C-scan image obtained. The scan range was from −8 mm to 8 mm. The step size was 1 mm.
Figure 7 shows amplitudes of output signal of the axial notches with different depths (defect #1 and #2 in Table 1) It is seen that the amplitudes of the signals are positively correlated with the defect depth, which is common for ECT. The positions of the peaks of the signals are at the center of the defects. The images for the circumferential notches (defect #3 and #4 in Table 1) are shown in Fig. 8. Different with the image of axial notch, the image of a circumferential notch has two peaks. It is worth noticed that the amplitude of the peak values for the axial notch and the circumferential notch are in the same order, meaning the probe has comparable detection ability for axial and circumferential notches. Figure 9 shows the simulation result of the flat bottom holes. The differences of the signals for various kinds of defects are obvious.
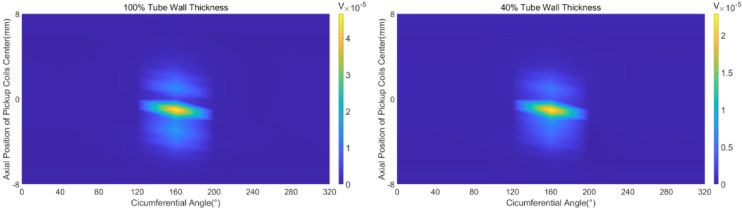
Simulation results: amplitudes of output signal of the axial notches with depth of 100% TW and 40% TW.
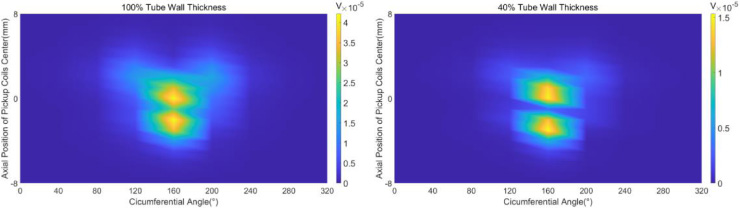
Simulation results: amplitudes of output signal of the circumferential notches with depth 100% TW and 40% TW.
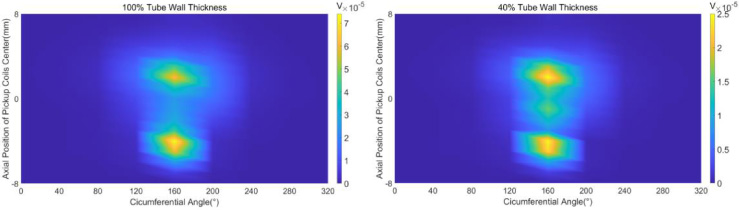
Simulation results: amplitudes of output signal of the flat bottom hole with depth 100% TW and 40% TW.
Based on the simulation analysis, a prototype probe was made following the design of the model and was used to conduct the experiment on a tube sample with machined defects. Figure 10 shows a photo of the prototype probe. The schematic diagram of the experiment system is as shown in Fig. 11.
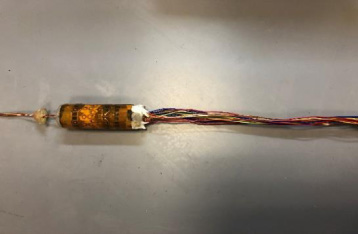
Photo of the prototype probe.
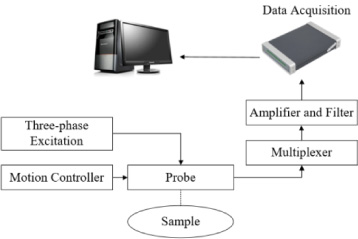
Schematic of experiment system.
Different kinds of defects were tested by the prototype probe to validate the simulation model. Figure 12 presents the experimental image. The three-phase excitation currents were generated by two waveform generators that are synchronized with a clock signal. Each of the waveform generator has two channels. The output voltage of the waveform generator was set as 10 V. The signal #1, #2 and #3 shown in Fig. 12 are the amplitude signal of axial notch, circumferential notch and flat bottom hole respectively. The sizes of the two notches were length × width = 2.54 mm × 0.127 mm and 0.127 mm × 2.54 mm, respectively. The depths of the notches were 100% TW. The diameter and depth of the flat bottom hole were 1.3 mm and 100% TW respectively. It is seen that the defects can be recognized from the image. The experiment results can be compared with the simulation results qualitatively, which validates the simulation model and further demonstrates the feasibility of the new probe design.
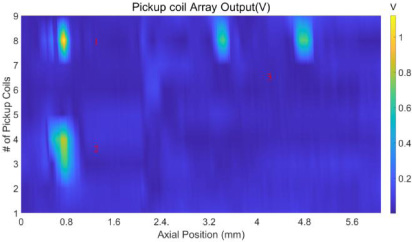
Experiment result of a tube sample with machined defects.
A novel array ECT probe with three-phase excitation for steam generator tube inspection was presented in this paper. Theoretical analysis implies the background signal will be small, which is one of the major advantages of this design. Induced eddy current simulation indicates that the eddy current shifts electrically in the sample which eliminates the necessity of the multiplexer to switch the excitation. The operation principle and the performance of detecting defects of different types were simulated numerically based on a 3D FEM model. A prototype probe was developed and tested, by which a steam generator tube sample with different kinds of defects was inspected. The experiment results validate the simulation model and further demonstrate the feasibility of the sensor.
Because the new probe design does not need multiplexer circuit to switch the excitation or the pickup coils, the probe has advantages of lower cost, less noise and faster inspection speed compared with conventional ECT array probe. The simulation and experiment work in this paper investigated the working principle and performance of the idea of three-phase excitation probe, which may provide a novel method for the research and industry. Potentially, it can be used widely for steam generator tube periodical inspection to guarantee the safety of nuclear power plant. However, extensively study still need to be conducted before field applications, e.g. optimization of the parameters of the probe, detection capability testing and development of signal processing algorithm for defect classification et al.