
Abstract
This paper proposes a multi-objective stratified optimization (MOSO) design for a permanent magnet linear synchronous machine (PMLSM) to obtain higher thrust and suppress the thrust ripple. MOSO can combine the advantages of different optimization methods and have fast and efficient optimization characteristics. Based on the parametric analysis of the influence of the auxiliary tooth size and the end-tooth width on the thrust performance, the sensitive variables are quickly filtered by using the Taguchi method. The response surface model (RSM) is built by adopting the central composite design (CCD) based on the sensitive variables. Moreover, the stratified optimization design of the PMLSM is completed by combining with the multi-objective particle swarm optimization (MOPSO) to achieve a balance between local and global search. Finally, a prototype is manufactured, and experiments are implemented to verify the proposed method.
Keywords
Introduction
Permanent magnet linear synchronous machines (PMLSMs) have now been widely used in CNC machine tools, lithography and other high-precision applications due to their direct drive motion with faster response, higher thrust density, easy maintenance, and good heat dissipation [1–5]. However, the detent force of PMLSM is unavoidable due to the unique end structure to produce the thrust ripple.
To reduce the thrust ripple caused by the detent force, weakening the end force and cogging force is effective [6,7]. The most popular optimization methods are the innovative design of new motor topologies and the improvement of traditional structures using advanced optimization algorithms. The new structural innovations mainly include the addition of trapezoidal end diagonal teeth, V-shaped distribution structure of permanent magnets, and bilateral primary asymmetry [8–10]. However, such methods are too demanding in terms of processing technology and cost and are difficult to be applied universally. In addition, the advanced optimization method is used to optimize the traditional motor structure [11]. The mapping relationship between the motor structure parameters and the optimization objective is created first, and then advanced optimization algorithms are applied to optimize the motor structure using the mapping relationship as the objective function. Among the optimization algorithms include using particle swarm optimization combined with signal-to-noise ratio approach, extreme learning machine combined with grey wolf optimization algorithm, and weighted random forest combined with modified krill swarm algorithm [12–14]. The difficulty of advanced optimization algorithms is how to ensure accurate accuracy.
In [15,16], the virtual displacement method is used to analyze the relationship between the end force and the length of the mover core, and the calculation method of the core length is presented when the end force is the smallest. In [17], the relationship between the end force and the end structure is analyzed by the finite element method (FEM), and a V-shaped end structure is proposed to weaken the end force. In addition, the auxiliary tooth adopts the arc-shaped chamfer optimization, which can change the magnetic flux path of the left and right end faces to reduce the thrust ripple to improve the precision [18]. In [19], the combination of the analytical method and FEM is used to analyze the detent force. The effect of permanent magnets (PMs) and their chamfered sizes on the thrust ripple suppression are studied. Therefore, the end tooth structure, slot width, and PM structure greatly influence the thrust performance of the PMLSM.
Due to the mutual coupling between the structural variables of the PMLSM, the average thrust will also be weakened while the thrust ripple is suppressed [20–22]. Therefore, multi-objective optimization is usually used to solve the nonlinear relationship between objectives and variables [23,24]. In [25], the Taguchi method is introduced into the optimization design of the linear motor to optimize the teeth and the pole parameters, and a set of relatively optimal parameter combinations are selected to reduce the thrust ripple effectively. The genetic algorithm (GA) can also be used to complete the optimal design of the linear motor [26]. Since the FEM takes a long time and requires a large amount of calculation, the response surface model (RSM) is introduced into the motor optimization process, and the GA is used to optimize the surrogate model to complete the optimization design to improve the electromagnetic torque of the motor [27,28]. However, these optimization methods all have the limitation of the search range. To obtain fast and efficient optimization results, a stratified optimization method is proposed to satisfy the global search optimal value [29]. In [30], the objectives function and constraints are analyzed. The multi-objective NSGA-II is used to optimize the design of a high-speed permanent magnet synchronous motor to achieve higher efficiency and higher power density. After optimization, it can be seen that the power density and efficiency of the optimized motor are significantly improved. Multi-objective stratified optimization (MOSO) can combine the advantages of different optimization methods to achieve fast and efficient optimization. Therefore, it is necessary to select each layer method reasonably according to the objectives for the MOSO of PMLSM.
This paper proposes a MOSO method based on PMLSM with unequal end-tooth width used in CNC machine tools to improve the average thrust and reduce the thrust ripple. Section 2 introduces the initial motor structure and performs the parametric analysis on the auxiliary and end teeth dimensions to determine the critical variables for optimization. Section 3 proposes a stratified optimization method to improve thrust and reduce thrust ripple for PMLSM. The first layer uses the Taguchi method to filter sensitive variables to reduce the complexity of optimization. The second layer uses CCD to quickly get the high-precision RSM surrogate model in the local range of the PMLSM to reduce the computational cost. GA has crossover and variational operators, and its search deviates when it approaches the global optimum, with long convergence time and poor local search capability. Particle swarm optimization (PSO) is easier to achieve a balance between local search and global search. Therefore, the third layer selects MOPSO to perform iterative optimization to avoid falling into the local optimum. A set of feasible solutions under MOPSO is obtained through the whole process, and then several optimization methods are then compared and selected to get the optimal solution. Section 4. presents the optimized prototype and experimental platform. Then, the no-load EMF test, static thrust test, and detent force test are carried out to verify that the stratified optimized structure can effectively improve thrust and reduce thrust ripple for PMLSM.
Structure and parametric analysis
Initial structure
Figure 1 is an existing initial PMLSM, which adopts the structure of 12 slots/14 poles with fractional-slot centralized winding. The main parameters are listed in Table 1. The detent force that affects the thrust ripple is mainly composed of the end force and cogging force [6,16]. The end force optimization can be optimized from the mover end structure, while the cogging force optimization is usually optimized from the slot and the PM structure.
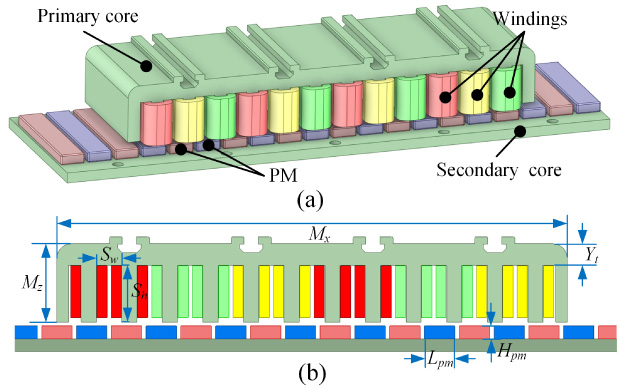
Initial PMLSM structure. (a) 3D structure of initial PMLSM. (b) Sizes of initial PMLSM.
Main parameters of PMLSM
Since the initial structure has an auxiliary tooth structure, using the triangular chamfer design as shown in Fig. 2 can improve the magnetic flux path at the end [31].
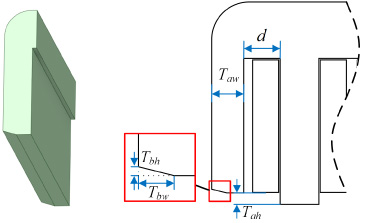
Auxiliary tooth structure diagram.
The relationships between the auxiliary tooth parameters and the average thrust F a and thrust ripple F r are obtained by the FEM parametric analysis, as plotted in Fig. 3.

Effect of auxiliary tooth size on thrust characteristics.
The chamfer height T ah has the most significant effect on the average thrust than the chamfer width T aw and the end slot width d, but the effect of thrust fluctuation is small after T ah exceeds 3.25 mm, while the average thrust is still decreasing, so there is no need to consider T ah greater than 3.25 mm.
Chamfered height T ah has the most significant effect on the average thrust than chamfered width T aw and end slot width d, but the effect of thrust ripple is small after T ah exceeds 3.25 mm, while the average thrust is still decreasing, so there is no need to consider T ah greater than 3.25 mm. Changing the chamfered size T bh and T bw has almost no effect on the average thrust but significantly impacts the thrust ripple. Due to the coupling phenomenon between the variables and the objectives, it isn’t easy to get the optimum through parametric analysis.
Due to the air-gap permeance distortion of the end structure, changing the tooth end structure will improve the detent force. The unequal end-tooth structure depicted in Fig. 4 can improve the end air gap to reduce the thrust ripple. The variable characteristics with different tooth widths are analyzed by using FEM, as shown in Fig. 5.
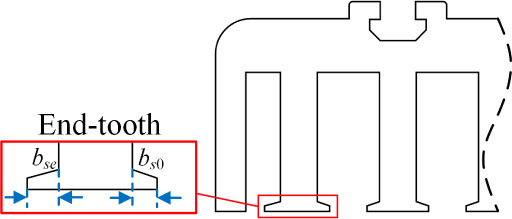
Unequal end-tooth width structure.
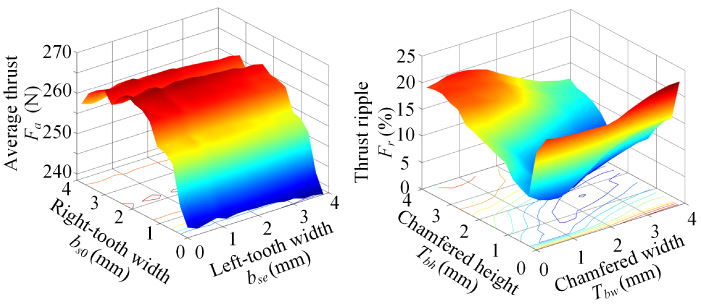
Effect of unequal end-tooth width on thrust characteristics.
From Fig. 5, right-tooth width b s0 greatly influences the average thrust, b s0 and left-tooth width b se have significant sensitivity to thrust ripples. The optimal value of b s0 and b se can be obtained between 1 mm to 2 mm, and the unequal width of the teeth can improve the thrust performance of the PMLSM.
The auxiliary tooth and unequal end-tooth width can improve the thrust performance of the PMLSM. Applying these two structures to the initial structure gives an improved PMLSM structure with unequal tooth width, as illustrated in Fig. 6.

Sizes of improved PMLSM.
Due to the mutual coupling between key variables, it is necessary to use a multi-objective optimization method to optimize the thrust performance of the PMLSM. The initial values of the key variables of the PMLSM are shown in Table 2. To simplify the analysis, we assume that b
s1 = S
w
− 2 × b
s0, b
s2 = 0.5 × S
w
− b
se
. The objectives and the constraints are defined as,
Initial values for key variables
For the PMLSM with unequal end-tooth width optimized in this paper, a total of 12 key variables are highly correlated with the objectives. Conventional full factorial optimization will be a time-consuming project. Therefore, the MOSO is proposed to seek fast and effective optimization by combining the advantages of different optimization methods [32]. This paper adopts the MOSO combining the Taguchi method, the RSM method, and the MOPSO method. The optimization process is divided into three layers, as drawn in Fig. 7. The first layer uses the convenience of the Taguchi method in filtering variables to reduce the complexity. The second layer utilizes the rapidity of the RSM in constructing the surrogate model to reduce the computational cost. The third layer takes advantage of the advanced nature of MOPSO in optimization to avoid the result from falling into local optimum.
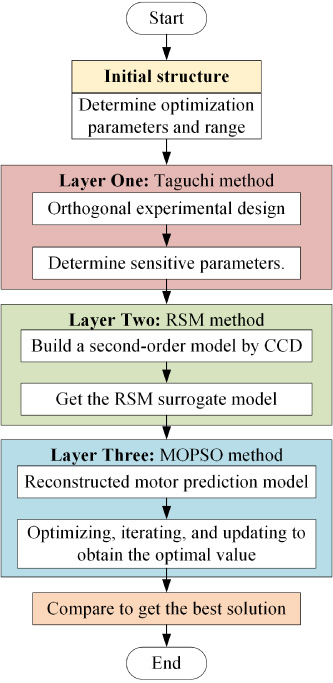
MOSO flowchart.
Taguchi method can extract the best combination level of experimental variables through fewer trials and has the advantages of simplicity, convenience, and high accuracy [33]. This method for PMLSM optimization needs to determine the optimized objectives, the optimized variables, and the value ranges. Besides, an orthogonal table is required to be established by using FEM. The results are analyzed by means and variance analysis to select the optimal combination.
The means of the simulation results for each optimized objectives is calculated as,
Variance analysis can filter the sensitivity between variables and objectives to get the variable impact ratio. The variance is obtained from the mean of the variable at level l and the mean of the optimization objective. The variance SS
if
and variable impact ratio Sp
i
(f) are calculated as,
For PMLSM, the objectives are F p and F a , the variables are d, T ah , T aw , T bh , T bw , Y t , L pm , H pm , R pm , S w , b s1 and b s2. The 12 variables are divided into two groups. The one is the main variable affecting the end force, and the other one is the main variable affecting the detent force. The value range and level distribution of each variable are shown in Table 3, and two orthogonal tables L 25(56) are constructed for FEM.
Variable value range and level by Taguchi method
The results of means analysis are plotted in Fig. 8. For variable d, the general trend of thrust performance deteriorates as the number of levels increases, taking level 1. The variables T aw , T bh , and b s1 are similar to the variable d, taking level 1. Variable T ah after level 3, F p decreases slowly, and F a has been decreasing, so take level 3. The variable T bw has the largest F a at level 4, which is taken as level 4. When the variable Y t is at level 3, F p is the smallest, and F a is the largest, taking level 3. The F p of the variables L pm , H pm , and R pm changed smoothly, so it mainly depends on F a , and the level is 4. The variable S w has better performance at levels 4 and 5. Although F p is smaller in level 4 than that in level 5, level 4 is taken to avoid magnetic saturation and increase stiffness. The F p of the variable b s2 changes gently, and level 5 has the smallest F p value, which is taken as the level 5. Variables optimized by Taguchi method are listed in Table 4.
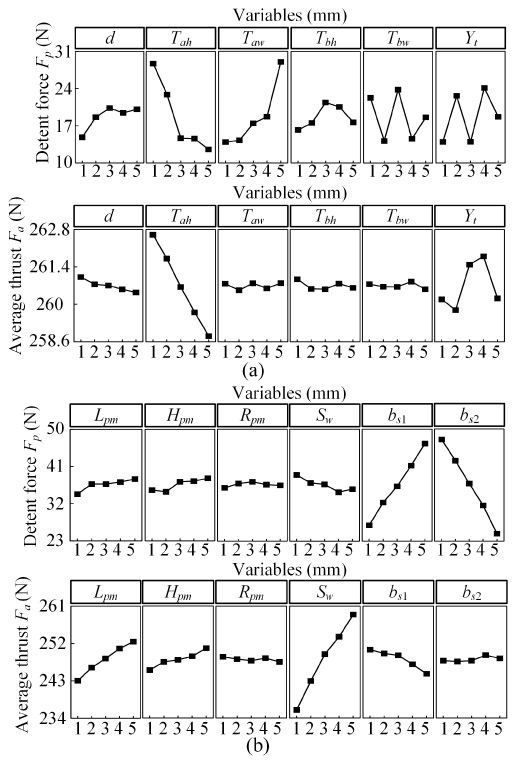
Means analysis. (a) Group 1. (b) Group 2.
Optimized variables by Taguchi method
The variable impact ratio are shown in Fig. 9. Among the six variables in the first group, T ah is the one that affects the thrust performance significantly. T aw is also closely related to F p , but has less influence on F a . Similar to T ah , Y t has a greater impact on thrust performance. In addition, the proportions of d, T bh , and T bw are too small, which need to be discarded to simplify the calculation. Similarly, among the six variables in the second group, S w is the most sensitive to F a , accounting for 77.35% of the total. F p is mainly affected by b s1 and b s2, and the total proportion of the two can reach 95.29%. Combined with the analysis of the first group, T ah , T aw , Y t , S w , b s1, and b s2, are determined as sensitive variables.
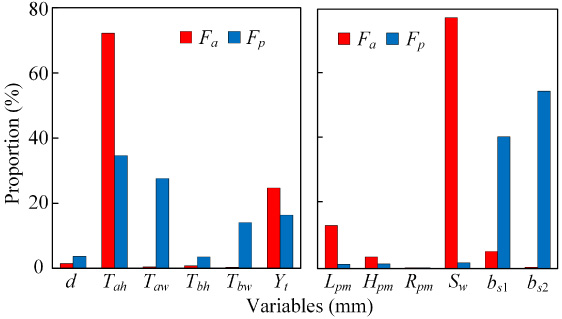
Variance analysis.
Although the Taguchi method is straightforward and convenient in experimental design, the optimum calculated is relatively rough. The RSM can accurately fit complex response relationships in a local range with fewer trials and replace complex multi-dimensional problems to get corresponding surrogate models to obtain the optimum [34]. The RSM method is to design an experimental table about the variables and the objectives by CCD, which is used to calculate the nonlinear relationship between the variables and the objectives. This experimental table can be used to quickly obtain a proxy model, which is a fitting equation between the variable and the objective. This surrogate model can replace the finite element simulation model and simplify the computation time.
Due to the complexity of the structure of the PMLSM, the RSM needs to be constructed through a second-order model. The commonly used second-order model design include Central Composite Design (CCD) and Box-Behnken Design (BBD) [35]. The CCD can obtain the calculation accuracy with more experiment numbers than the BBD. To achieve a better optimization effect, the CCD method is selected after comprehensive consideration to build an RSM model based on the six key variables of T ah , T aw , Y t , S w , b s1, and b s2.
Based on the optimum of the Taguchi method, it is necessary to combine the influence of each variable on the thrust characteristics to narrow and determine the value range of the variable, thereby reducing the area of RSM fitting. It can achieve the actual effect of height in local space and get the variable-level coding table in Table 5. Each variable takes values at 5 levels as (−r, −1, 0, 1, r). Where, level −r represents the minimum value, 0 represents the central value, and r represents the maximum value.
Variable level coding table by RSM method
Variable level coding table by RSM method
In order to express more precisely the relationship between the six key variables and the optimization objective, the average thrust F
a
and the peak thrust F
p
are described by a second-order Quadratic regression equation with cross terms as follows,
Using the CCD method, the total simulation solutions can be listed according to the range of values corresponding to each factor in the Table 5, and then the F
p
and F
a
values of all solutions can be obtained by ANSYS finite element simulation. This data set represents the finite element simulation results, which are used to compare with the results predicted by the surrogate model to verify the accuracy. The FEM simulation of the CCD design table is carried out, and the multivariate quadratic regression equation about the thrust characteristics are calculated by Design-Expert as,
The time to obtain the objective by surrogate model calculation is only 10 s, while the ANSYS finite element method takes 13 min, which greatly improves the efficiency. Further, the 3D surface map corresponding to the RSM equation can be plotted in Fig. 10. If the detent force value F p takes the minimum value, the average thrust F a often cannot achieve the optimum value because of the strong coupling. Therefore, solving the RSM model is a typical multi-objective problem. The variables need to be coordinated and weighed to realize the two optimization objectives.
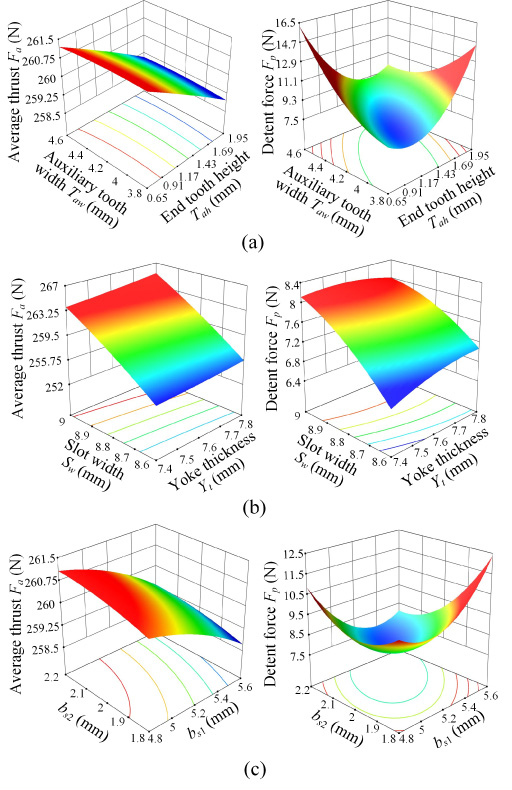
3D response surface plot of key variables and objectives. (a) Variables T aw and T ah . (b) Variables S w and Y t . (c) Variables b s1 and b s2.
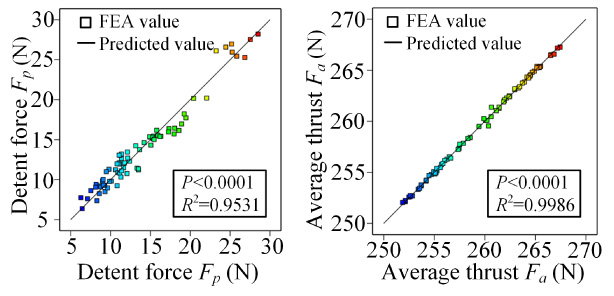
The rationality of the surrogate model is usually checked by the P value and the complex correlation coefficient R
2. The regression model has a good significance, and fitting accuracy when the P value is less than 0.05 and the R
2 is more significant than 0.9 and close to 1. R
2 represents the error between the calculated value and the actual value, as follows,
Combined with the finite element simulation results, the rationality evaluation of the RSM model is calculated, and the simulation values and model prediction values in Fig. 11 are obtained. The optimized objectives F p and F a under the Quadratic model are far less than 0.05, and the values of R 2 are 0.9531 and 0.9986, respectively, which proves that the CCD-based RSM mathematical model has better performance.
Model accuracy verification.
To solve the above RSM model, the objectives and constraints are set as ((1)), and the variable optimization results of RSM can be given in Table 6. When the residual variable values take the Taguchi optimal solution, the thrust performance of the PMLSM can reach the optimum.
Optimized variables by RSM method
GA has crossover and variational operators, which are biased when searching close to the global optimum, and GA has a long convergence time and poor local searchability. PSO is better than the GA in terms of search speed, and the update iteration of each particle in the particle swarm is affected by the local optimum and the global optimum, therefore PSO is easier to achieve the balance between local search and global search.
MOPSO performs iterative optimization on the surrogate model calculated from the RSM to gain higher-precision optimization results and avoid the occurrence of extreme values in the local range [36,37]. Since the range of PMLSM variables has been reduced to a sufficiently small size after the Taguchi method and RSM method analysis, the weight variable ω is taken as 0.4 to ensure that the particles have sufficient local searchability. The population size of the whole simulation is set to 100 and the number of iterations is set to 200 to obtain the Pareto solutions as shown in Fig. 12. The entire iterative optimization process using Matlab takes only 15 s.

MOPSO optimization results.
From Fig. 12(a), each circle represents a feasible solution. The distribution of all solutions is relatively uniform, and the red circles represent the Pareto-optimal front is relatively complete, which together indicate that the solutions are diverse. From Fig. 12(b), the average thrust and the detent force reach convergence when the number of iterations is 80. Although the Pareto-optimal front is very steep when F p is less than 8 N, and the effect on F a is small, the change of F p will increase the thrust ripple. Considering the objectives and constraints, discard the results after F p exceeds 8 N, and finally choose the two results MOPSO1 and MOPSO2 as the preferred solution. The variables of the two solutions are listed in Table 7.
Optimized variables by MOPSO method
The above optimized structural variables and the initial structural variables are obtained with FEM respectively. The results are listed in Table 8. The thrust waveform comparison and harmonics are drawn in Figs 13 and 14.
Comparison of optimized results
Comparison of optimized results
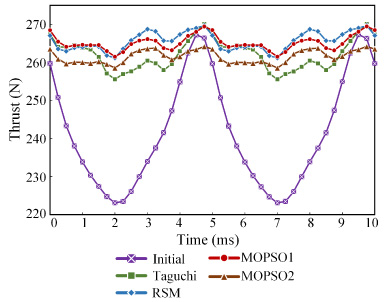
Thrust waveforms for different optimized methods.
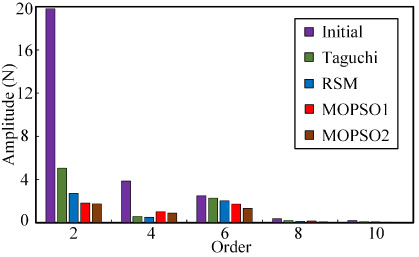
Thrust harmonics for different optimized methods.
Compared with the initial structure, all optimization methods can increase the average thrust while reducing the thrust ripple. After rough optimization, the Taguchi method has the highest detent force and thrust ripple. Compared with the Taguchi method, the RSM method improves the optimization accuracy. The average thrust increases by 1.4%, and the thrust ripple decreases by 42%. Based on the RSM method, the MOPSO method gives two optimal results MOPSO1 and MOPSO2 in the Pareto solution set. Compared with MOPSO2, MOPSO1 reduces thrust ripple by 6.83%, while the average thrust remains almost unchanged. MOPSO2 reduces the thrust ripple by 32.92% at the expense of 1.56% of the average thrust.
In addition, the 2nd and 4th harmonics, which have the most significant impact on thrust performance, have been significantly weakened after optimization. Through the above analysis and comparison, it can be proved that the MOSO strategy can combine the advantages of different optimization methods to achieve fast and efficient optimization. Considering the low thrust ripple requirement of high-precision PMLSM, MOPSO2 is selected as the final optimized structure when the average thrust values are almost similar.
The comparison of the air gap magnetic density of the motor before and after optimization is shown in Fig. 15. It can be seen that the optimized air gap magnetic density has been significantly improved, and the positioning accuracy has been greatly improved. The loss distribution is shown in Fig. 16. The copper loss is about 65.6 W, the core loss is about 14.7 W, and the output power is 576 W. The efficiency is calculated to be 87.8%, which is mainly due to the copper loss.

Air-gap magnetic density waveform comparison.
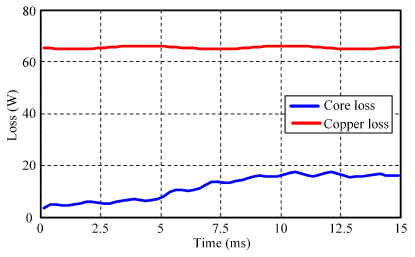
The loss distribution map.
An optimized mover prototype is manufactured to verify the MOSO method with optimized dimensions using MOPSO2, as illustrated in Fig. 17. Figure 17(a) and (b) show the lamination of the prototype and primary core, respectively. The mover is composed of stainless steel support plate, primary core, windings, and bearings, as presented in Fig. 17(c). The secondary is composed of arc chamfered PMs and back iron. The experimental platform is built and exhibited in Fig. 17(d).

Prototype and Experimental platform. (a) Primary core lamination. (b) Primary core. (c) Mover. (d) Experimental platform.
No-load EMF test, thrust test and detent force test are carried out to calculate electromagnetic thrust and thrust ripple of the PMLSM, respectively. The experimental equipment used includes magnetic grating transducer, power driver, S-type force sensor, signal amplifier, oscilloscope, DC voltage, multimeter, etc. The magnetic grid sensor used is the ERC-ME05 for position detection. The S-type force sensor is DYLY-103, which is used for thrust and detent force detection. The power driver uses DSP28062 for drive control. The signal amplifier uses DY510. The comparisons between the experimental results and the FEM results are plotted in Figs 18, 19 and 20, respectively.

Simulated and measured no-load EMF comparison.
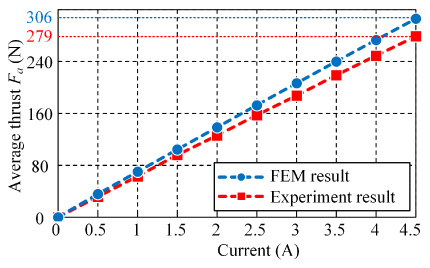
Simulated and measured average thrust comparison.
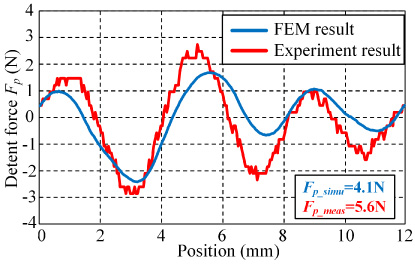
Simulated and measured detent force comparison.
The no-load EMF experiment is to connect the linear motor with the servo motor through the ball screw, then give the servo motor a fixed speed, and finally measure the three-phase voltage of the linear motor through the oscilloscope. The measured and simulated no-load EMF waveforms at 0.56 m/s are shown in Fig. 18. Here, the maximum value and THD of the no-load EMF are given. The experimental waveform is in agrees well with the simulation waveform. However, the proportion of harmonics in the experiment is larger than that in the simulation, which is mainly caused by the machining accuracy.
The output thrust experimental procedure is mainly to verify the thrust by measuring the static thrust. First, the mover is connected to the S-type force sensor and placed in a standstill blocked state, and then the three phase windings are fed with different amplitude currents, and the thrust under different currents is measured by the force sensors. The thrust of the prototype is measured with different current values and fitted into a thrust-current curve as plotted in Fig. 19. The current amplitude has a linear relationship with the thrust. For every 0.5 A increase in current, the simulated thrust increases by about 34 N, and the experimental thrust increases by about 31 N. The difference between the two is basically kept at about 3 N, and the error is about 10%. The error is mainly due to its low manufacturing precision and the difference between material properties. Combining the no-load EMF test and the comparisons in Fig. 18, the thrust of the prototype is consistent with the simulation.
The detent force experiment is similar to the no-load EMF experiment, in which a servo motor is connected to a linear motor and given a low speed. The force of the linear motor at constant speed measured by a force sensor is the detent force. The detent force of the prototype is measured at a constant speed using the force sensor and compared with the simulation results, as plotted in Fig. 20. The detent force waveforms of the experiment and simulation are consistent, the peak-to-peak value of the experimental detent force is 5.6 N, and the peak-to-peak value of the simulated detent force is 4.1 N. There is only an error of about 1.5 N, and the main source of the error is the friction between the mover and the guide rail during operation. The thrust ripple is calculated as the ratio of the difference between the maximum and minimum values of thrust to the average thrust. The thrust ripple cannot be accurately measured in dynamic operation due to friction and other factors, and the difference between the maximum and minimum values of thrust is the magnetic resistance, so the goal of thrust ripple suppression is achieved by optimizing the minimum magnetic resistance in this paper. Based on the above analysis, the experimental results of the prototype can verify the simulation results, all of which prove that the MOSO design method proposed in this paper can effectively improve thrust and reduce thrust ripple.
This paper takes the PMLSM with unequal end-tooth width structure as the research object and adopts the MOSO method combining the Taguchi method, RSM method, and MOPSO method to achieve the goal of increasing the average thrust and reducing the thrust ripple. Firstly, based on the existing initial PMLSM structure, the influences of auxiliary tooth and unequal end-tooth width structure on reducing thrust ripple and improving thrust of PMLSM are analyzed by FEM parametric analysis. The two optimized structures are applied to the initial PMSLM structure, and an improved PMLSM with unequal end-tooth width is obtained. Then, the MOSO method is carried out with the average thrust and thrust ripple as the objectives. The first layer uses the Taguchi method to select sensitive variables. The second layer uses CCD to quickly get the high-precision RSM surrogate model in the local range of the PMLSM. The third layer uses MOPSO for iterative optimization, and the optimum is given by comparison. Compared with the initial structure, the average thrust is increased by 8.14%, and the thrust ripple is weakened by 88.2%. Finally, the experimental results of the prototype thrust and detent force are compared with the FEM simulation results to verify that the PMLSM after MOSO can improve the average thrust and reduce the thrust ripple.
Footnotes
Acknowledgements
This work was supported in part by Jiangsu Provincial Key Research and Development Program under Grant BE2021016 and Postgraduate Research and Practice Innovation Program of Jiangsu Province under Grant KYCX21_0320.