
Abstract
This study proposed a method to evaluate proper experimental conditions of eddy current tests under a low signal-to-noise ratio. This method was applied to quantify the detection reliability of the eddy current test to detect corrosion pits on the surface of austenitic stainless-steel weld cladding from the perspectives of probability of detection and probability of false alarm. The fluctuations of flaw signal and noise were described using truncated bivariate normal distributions of a two-dimensional vector composed of the real and imaginary components of a signal. The probabilities of detection and false alarms were formalized as cumulative distributions of the estimated distributions of the maximum flaw signal and the noise exceeding a decision threshold. The receiver operating characteristic curves were created by coupling the probabilities of detection and false alarms at various thresholds. The area under the curve was used to quantify the detection reliability, simultaneously considering the probabilities of detection and false alarms. The results obtained in this study support the applicability of this method in quantitatively evaluating the detection reliability of a non-destructive inspection under a low signal-to-noise ratio.
Keywords
Introduction
Non-destructive testing plays an important role in ensuring the integrities of structures. Knowing the presence of a harmful flaw by non-destructive testing is vital for discussing proper maintenance activities. However, non-destructive testing cannot always detect flaws, especially in a noisy condition. This indicates the importance of quantitatively assessing the reliability of a non-destructive testing method to detect a flaw.
Eddy current testing (ECT) is an electromagnetic non-destructive testing method suitable for the rapid inspection of a surface flaw even in the inspection of welds where large noise appears [1,2]. Whereas recent studies to evaluate the detection reliability of ECT basically focuses only on the probability of detection (POD) [3–6], it is also essential to evaluate the probability of false alarm/detection (POFA). However, how to consider the influence of noise on detection reliability quantitatively remains unclear. A potential method to consider POD and POFA simultaneously is based on the receiver operating characteristics (ROC), which has been applied to evaluate the detection reliability of ultrasonic testing [7].
Given the above background, this study developed a method quantifying the detection reliability of ECT in a noisy condition using ROC. In our previous studies, a POD model incorporating multiple signal features and flaw parameters was proposed [6]. To distinguish signals due to a flaw from noise more clearly, this study incorporated not only the amplitude but also the phase of eddy current signals. In addition, how to quantify POFA was also proposed. Surface flaws on stainless steel weld cladding were prepared and measured by ECT to simulate an inspection in a noisy condition [8]. Flaw detection reliability was evaluated based on the receiver operating characteristics curve and quantified using the area under the ROC curve.
Weld inspection using ECT
Weld cladding samples
To gather eddy current signals due to flaws in a noisy condition, this study used welded plate specimens fabricated in our previous study [7] shown in Fig. 1. The samples were fabricated by cladding the base material of a steel plate, ASTM A387 Gr22, with austenitic stainless steel of US-B309L through electro-slag welding. The thickness of cladding and bead width were about 5 mm and 50–60 mm, respectively. The cladding surface was ground, and the resultant surface roughness Rz (JIS2001) was about 4.7–5.6 μm. To simulate the flaws with irregular shapes in practical inspection, artificial corrosion pits were introduced to the center of each weld bead in width by the corrosion test, using a ferric chloride-based etchant (37–39 wt.% ferric chloride, H-1000A; Sunhayato, Tokyo, Japan). The total number of corrosion pits was 47. The profiles of the corrosion pits were measured using a 3D shape measuring machine (VR-5000; KEYENCE Co. LTD., Japan). The size information of all the corrosion pits is described in Fig. 2. In addition, flawless weld cladding samples were prepared to gather the noise generated by the weld structure.
Since the uneven electromagnetic properties, and surface undulation of weld structure can cause large noise in ECT signal. Detecting flaws on the weld cladding using ECT is able to simulate an inspection in a noisy condition.
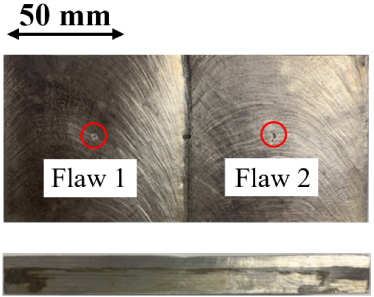
Photographs of the welded sample.
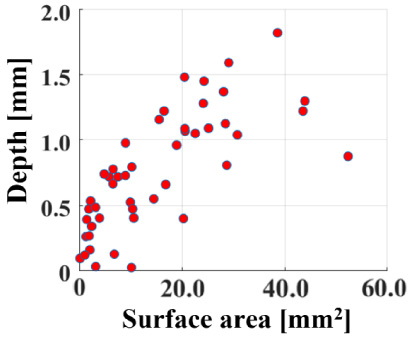
Size of corrosion pits.
Experimental set-up
The weld inspection was conducted using two probes, as shown in Fig. 3. Each probe was fixed at an X–Y stage, which controlled the movement of the sample, and was energized by the ECT instrument of aect-2000N (Aswan ECT Co. Ltd., Osaka, Japan) with a 300 kHz alternating current. Generated eddy current was parallel with the weld path. The lift-off was 1 mm. The 25 mm2 × 25 mm2 square areas centered on the corrosion pits and the same size flawless areas were measured. The experimental configuration is shown in Fig. 4. Because the ECT signals suffer from the “end effect” due to the sample edges and the joint of two beads, only the signals within the range of 14 mm × 14 mm square were extracted. The signal with the largest amplitude was regarded as the signal from a pit.
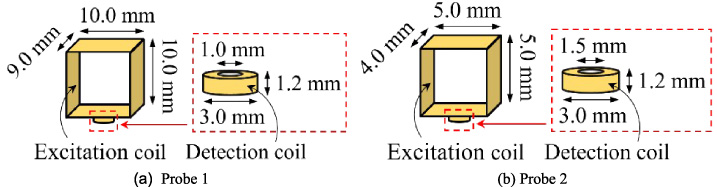
Illustration of ECT probes.
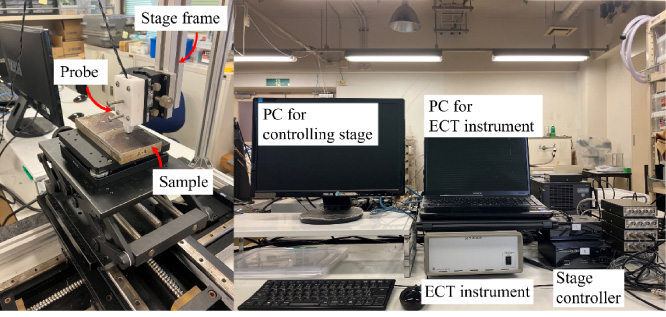
Experimental configuration.
The relationships between signals measured using Probe 1 and flaw parameters are qualitatively summarized in Fig. 5. The signal features considered here were the real and imaginary parts of signal amplitude, amplitude, and phase angle, which are labeled as “Real”, “Imag”, “Amp”, and “Phase”, respectively in the figure. The flaw parameters used to characterize a pit are the surface area, depth, and volume of a pit. The figure reveals the difficulty in representing a flaw parameter using a single signal feature, and the relationship between phase angle and flaw parameters also indicates it is difficult to express phase angle with flaw parameters.
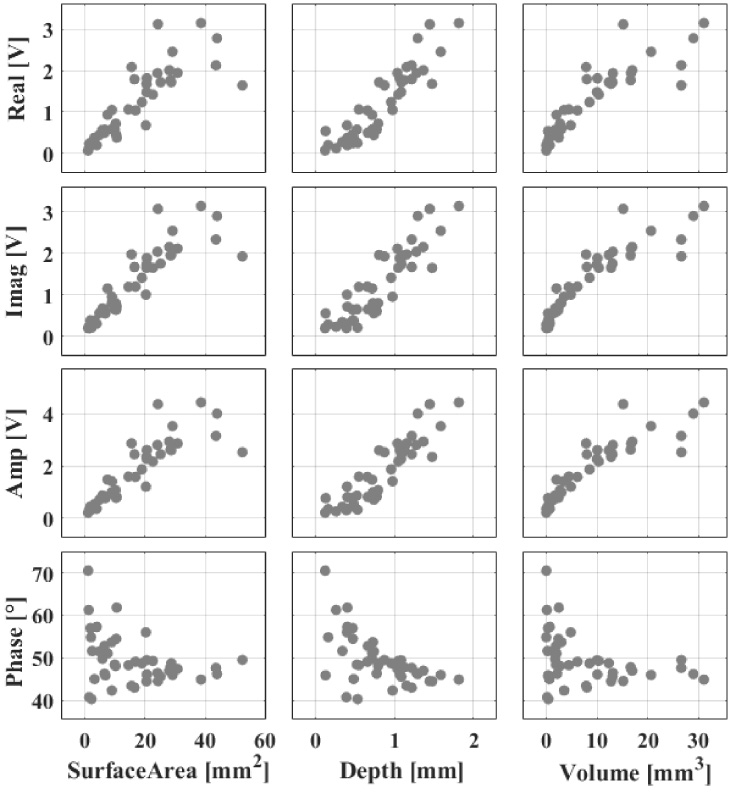
Relationships between signal features and flaw parameters.
The noise of the flawless area measured by Probe 1 is shown in Fig. 6. According to the noise distribution, there is a difference in the deviation between phase angles 1 and 2. Simply using a distribution of a single variable shown in Fig. 7, a signal feature of amplitude, cannot reasonably describe the realistic distribution because the phase information of noise cannot be included.
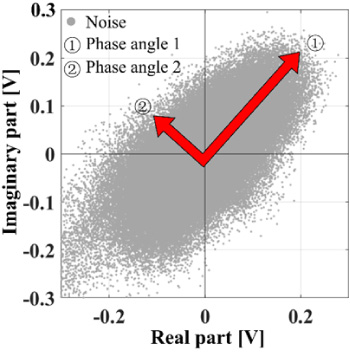
Difference in deviation between phase angles 1 and 2 of noise distribution.
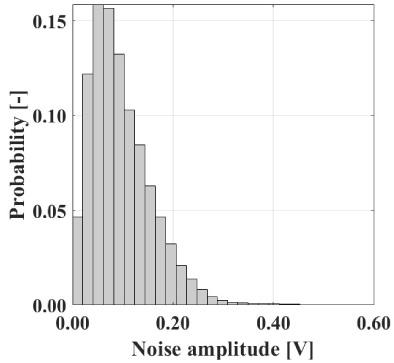
Unidimensional distribution of noise.
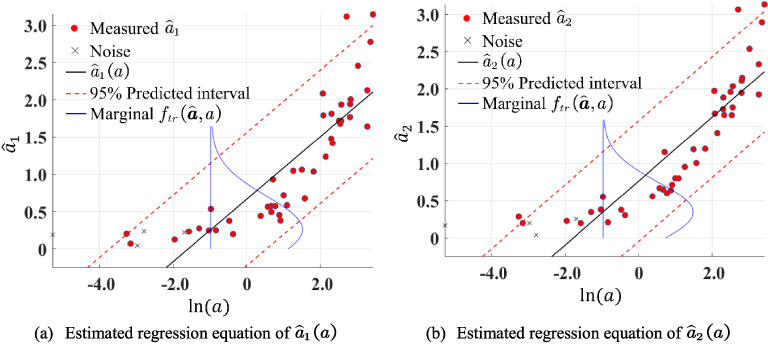
Estimated regression equations when using Probe 1.
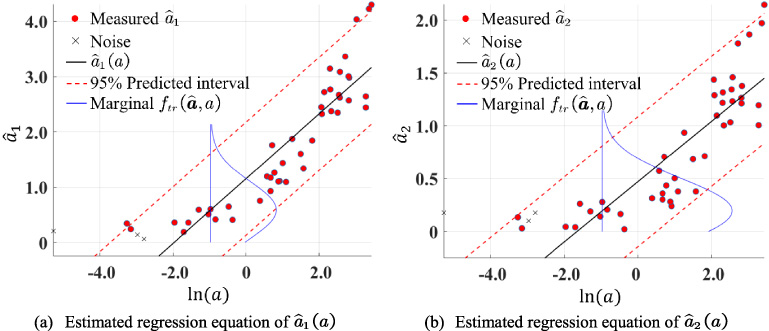
Estimated regression equations when using Probe 2.
Method
To consider the phase of ECT signal, bivariate normal distribution of the real and imaginary parts of the signal was built to describe the distribution of flaw signal and noise to determine POD and POFA for the ROC analysis of ECT.
Modeling of the measured flaw signal and noise
This study describes the fluctuations of the maximum flaw signal and noise,
The probability density function of noise
Once the truncated probability density functions of the maximum flaw signal
Results of modeling of measured flaw signal and noise
Table 1 lists the calculated R2 when relating the maximum flaw signal to different flaw size a. The result indicates that relating to the pit volume provides the most reliable regression, since the logarithmically transformed pit volume provides the highest R2 in either Probe 1 or 2. The regression equations
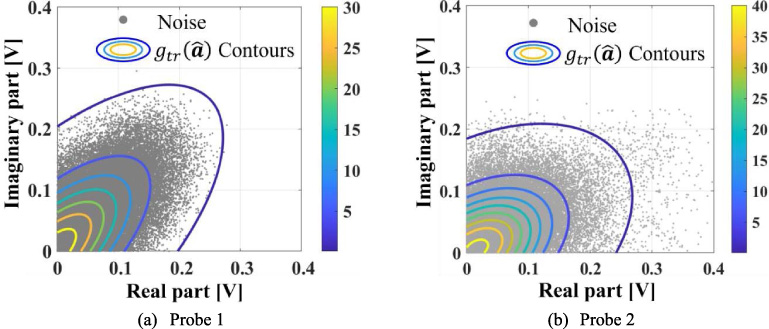
Estimated probability density function of noise.
Calculated R2 when using different types of flaw parameters a
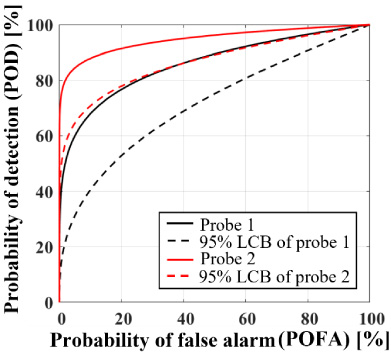
ROC curves at the volume of 0.16 mm3.
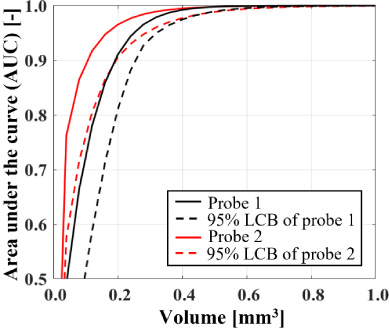
AUC curves.
Figure 11 presents the ROC curves corresponding to a 0.16 mm3 pit volume estimated based on the experimental data collected by Probes 1 and 2. This result reveals that Probe 2 of smaller size reduces the POFA by more than 20% while maintaining the same POD as Probe 1. It also has higher reliability than probe 1, since the AUC curve of Probe 2 is located above the curve of Probe 1 in Fig. 12. Smaller confidence intervals of the ROC and the AUC curves of Probe 2 also suggest higher reliability in the evaluation result of Probe 2.
Conclusion
This study proposed a method for modeling the realistic distribution of the maximum flaw signal and the noise measured by ECT through truncated bivariate normal distributions. The POD and the POFA were formalized with two signal features: amplitude and phase. The proposed method was applied to quantify the flaw detection reliability of two ECT probes having a difference in size used in weld inspection.
The results reveal that the proposed method was able to model the realistic distributions of the maximum flaw signal and the noise reasonably. The applicability of the proposed method to the quantitative reliability evaluation of ECT under a low signal-to-noise ratio was confirmed.