
Abstract
In this paper, the imaging and evaluation of defects hidden within the stratified conductor via pulse-modulation eddy current testing (PMEC) is intensively scrutinised through theoretical and experimental investigation. Following the proposition regarding the optimal excitation signal of PMEC, a fused signal feature integrating the harmonic and pulsed characteristics of PMEC signals is proposed in an effort to further enhance the testing sensitivity and signal-to-noise ratio (SNR). By comparing with the features of conventional PMEC and pulsed eddy current testing (PEC), the superiority of the fused feature is identified via theoretical simulations. This is subsequently supported by the corrosion imaging results obtained from the experiments, further indicating the advantage of the fused feature over traditional features in terms of testing sensitivity and SNR.
Keywords
Introduction
Layered conductors are extensively utilised in pivotal structures of such engineering fields as aerospace [1], nuclear [2], transportation [3], etc. The rigorous and hostile environments normally leave the layered conductors vulnerable to various defects including corrosions [4] and cracks [5], etc. It is noticeable that among these anomalies the hidden flaw particularly occurring at the interlayer of a layered conductor poses the most severe threat to the conductor integrity, further leading to the structure failure [6]. Therefore, in a bid to ensure the safety of in-service structures, non-destructive evaluation (NDE) technique is highly demanded for evaluation of hidden defects in layered conductors.
As one of the transient eddy current testing techniques, pulse-modulation eddy current (PMEC) technique has been found to be advantageous in detection and evaluation of subsurface flaws in planar and tubular conductors, compared with the classical harmonic EC technique [7–9]. To drive the testing probe, it uses the excitation signal in the pulse modulation waveform derived from the product of a sinusoidal carrier wave and modulation wave in the rectangular waveform, making it distinct from eddy current testing particularly in terms of the excitation-signal profile and its frequency spectrum [10].
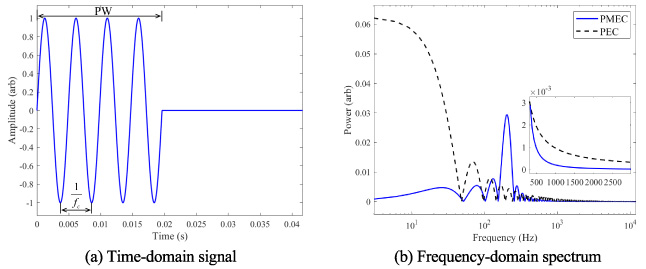
Conventional excitation signal of PMEC and its spectrum.
The conventional excitation signal of PMEC is presented in Fig. 1(a). It is noteworthy that the pulse width (PW) of the modulation wave is equal to n∕f c , where n is an integer denoting the number of carrier-wave cycles whilst f c stands for the frequency of the carrier wave. It can also be observed from Fig. 1(b) regarding the spectrum analysis of the excitation signal that the excitation energy of PMEC is concentrated around the carrier-wave frequency, indicating that PMEC is advantageous in focusing the electromagnetic field right within the specimen thickness, in conjunction with the pulsed characteristics originating from the modulation wave. Whereas, compared with the spectrum of the excitation signal of pulsed eddy current (PEC), the excitation energy of PMEC in high-frequency range is relatively lower. This could result in the loss in the information regarding the shallow depth of the anomaly, and could lead to the drawback of PMEC in comprehensive evaluation of hidden defects in layered conductors.
In an attempt to optimise spectral characteristics of the PMEC excitation signal by combining harmonic characteristics of the carrier wave and pulsed characteristics [11,12] of the modulation wave, a new form of the excitation signal is proposed. As exhibited in Fig. 2(a), the train of the carrier waves within the PW is adjusted to n and a quarter cycles, i.e., PW = (n + 1∕4)∕f c . This results in the so-called NQPMEC extended from the traditional PMEC. In contrast to the traditional excitation signal of PMEC, the train of the carrier waves is essentially truncated by the falling edge of the modulation wave when it reaches the maximum amplitude. The corresponding spectra of excitation signals of NQPMEC and PEC are shown in Fig. 2(b). It can be observed from Fig. 2(b) that the spectrum of the NQPMEC excitation signal is similar as that of PMEC, indicating that the NQPMEC excitation signal inherits the spectral profile particularly the harmonic characteristics of PMEC excitation signal. It also conceives a wide band of high-frequency harmonics, owing to the pulsed characteristics which PEC excitation signal has. Further analysis regarding the spectral power portrayed in the inset figure of Fig. 2(b) reveals that the excitation energy allocated to the harmonics (from 312 Hz to 2976 Hz in particular) in the excitation signal of NQPMEC is 202% higher than that of PMEC, benefiting the integrity assessment of the conductor at relatively shallow depths. Therefore, in a sense of the excitation-signal spectrum, it is indicated that NQPMEC inherits the merits of PMEC and PEC. Its testing signal would have higher sensitivity to hidden defects in stratified conductors due to the fact that it conceives more comprehensive responses to the defects.

(a) NQPMEC excitation current; (b) spectra of NQPMEC and PEC.
In order to investigate NQPMEC evaluation of defects in layered conductors, a semi-analytical model of a NQPMEC probe deployed over a double-layer conductor is established based on the ETREE modelling [13]. A typical defect, i.e., subsurface corrosion which progresses from either the back surface of the upper layer or the surface of the bottom layer, is introduced to the model. The 2D axisymmetric model is portrayed in Fig. 3. The solving domain is truncated in the radial direction with h. The probe consists of: (1) a funnel-shaped coil driven by the NQPMEC excitation signal for generation of the incident magnetic field; and (2) a tunnel magneto-resistance (TMR) sensor deployed at the centre of the coil bottom for picking up the net field.
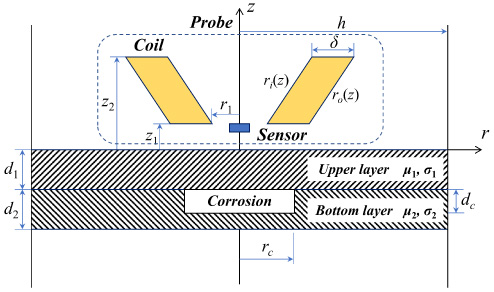
A 2D axisymmetric model of NQPMEC for evaluation of corrosion in a layered conductor.
Based on the ETREE method of transient eddy current testing, for each harmonic within the excitation signal the closed-form expression of the magnetic vector potential within the region of 0 ≤ z ≤ z1 can be written as:
Parameters of the probe and specimen
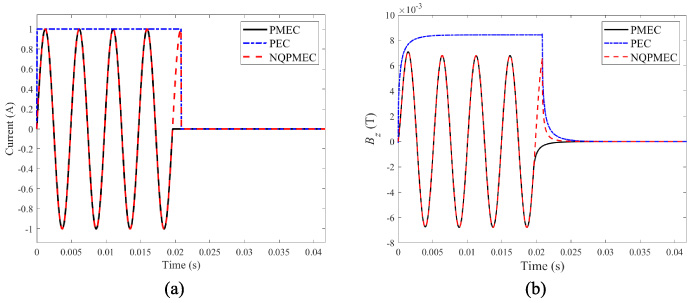
Signals of NQPMEC, PMEC and PEC: (a) excitation-current signals; (b) testing signals.
It can be observed from Fig. 4(b) in particular that similar to the excitation signal, when 0 < t ≤ 20.83 ms (i.e., the time-harmonic section) the sectional profile of the NQPMEC testing signal agrees with that of the PMEC signal, implying the harmonic characteristics of the NQPMEC testing signal. When t > 20.83 ms (i.e., the pulsed section), the NQPMEC testing signal exhibits the pulsed characteristics particularly at the falling part of the signal amplitude, which is comparable to PEC.
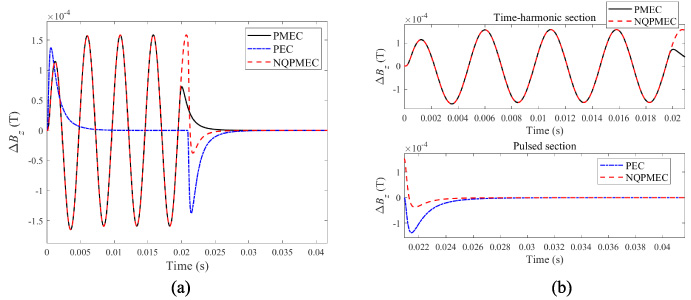
Differential signals of PMEC, PEC and NQPMEC: (a) signals in full period; (b) signal profiles in the time-harmonic and pulsed sections.
After the testing signal is acquired, the differential signal is subsequently derived from subtraction of the testing signal from the defect-free signal. The computed differential signals of NQPMEC, PMEC and PEC are shown in Fig. 5(a) whilst the sectional profiles of each differential signal in the time-harmonic and pulsed sections are presented in Fig. 5(b). Interestingly, it is noticeable particularly from Fig. 5(b) that besides the excitation and testing signals, the differential signal of NQPMEC also conceives the harmonic and pulsed characteristics. Since the signal profile appreciably varies at the temporal boundary (i.e., t = 20.83 ms) between the time-harmonic and pulsed sections, peak values (Pv, the extremum of the signal) of the differential signal in the time-harmonic and pulsed sections are extracted, giving the individual signal features highly correlated with the hidden corrosion: (1) Pv
H
for the time-harmonic section; and (2) Pv
P
for the pulsed section. In an attempt to efficiently detect and evaluate the corrosion by fully utilising the harmonic and pulsed characteristics of NQPMEC, Pv
H
and Pv
P
are fused via feature fusion by using the expression written as:
In a bid to identify the superiority of the fused feature, peak values are also extracted from differential signals of PMEC and PEC, and taken as the signal features (i.e., Pv PM and Pv PE for PMEC and PEC, respectively) for cross comparison. In regard to the corrosion in either the upper or bottom layer of the double-layer conductor, the correlation of each signal feature with the corrosion depth is presented in Fig. 6.
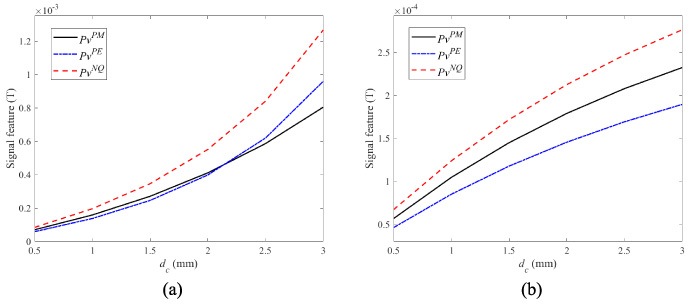
Relationships between signal feature and corrosion: (a) corrosion in the upper layer; (b) corrosion in the bottom layer.
It can be seen from Fig. 6 that similar to Pv PM and Pv PE , Pv NQ is monotonically increased as the corrosion size rises due to more significant perturbation of eddy currents induced in the conductor. Whereas, further analysis regarding the testing sensitivity via the cross comparison reveals that not only the feature value but the sensitivity of NQPMEC is the highest, compared with PMEC and PEC. This implies the superiority of NQPMEC along with the fused feature to PMEC and PEC for detection and evaluation of hidden defects which could hardly be interrogated because of the relatively low testing sensitivity of either PMEC or PEC.

The system setup: (a) schematic illustration of the system; and (b) the sample with defects in various sizes.
In parallel to theoretical simulations, a transient eddy current testing system has been built upfor imaging and evaluation of defects in layered conductors. The schematic illustration of the system is presented in Fig. 7. It is noteworthy that: (1) the parameters of the probe and specimen are same as those listed in Table 1; and (2) the system can readily be used to implement NQPMEC, PMEC and PEC by applying the excitation signals corresponding to individual techniques. Flat bottom holes (with d c = 1 mm ∼ 4 mm and r c = 12.5 mm ∼ 17.5 mm) are fabricated in the back surface of the upper layer and bottom-layer surface in order to imitate the corrosion occurring at the interface of the double-layer conductor.
As per the signal processing in simulations, after the testing signal is acquired, differential signals of NQPMEC, PMEC and PEC are derived, and portrayed in Fig. 8(a). This is followed by the extraction of Pv NQ , Pv PM and Pv PE for cross comparison regarding the testing sensitivity. The correlation between each signal feature and the corrosion depth is shown in Fig. 8(b).
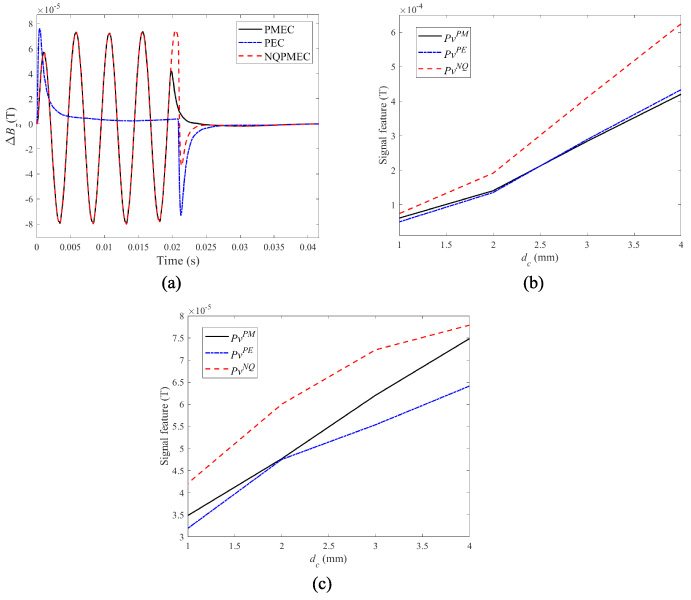
Experimental results of PMEC, PEC and NQPMEC: (a) differential signals; (b) signal feature against depth of the corrosion in the upper layer; (c) signal feature against depth of the corrosion in the bottom layer.
It can be found from Fig. 8 that in consistent with the finding from theoretical simulations, Pv NQ has the monotonic correlation with the corrosion size. Besides, the magnitude as well as the response sensitivity of Pv NQ is the largest among the signal features under analysis, which further indicates the advantage of NQPMEC in terms of the testing sensitivity. Based on the testing signal and its feature, imaging of the corrosion in different sizes can be produced. The feature-based imaging results of PMEC, PEC and NQPMEC are presented in Fig. 9. The higher sensitivity of NQPMEC fused feature can be concluded from the colour distinction obviously.
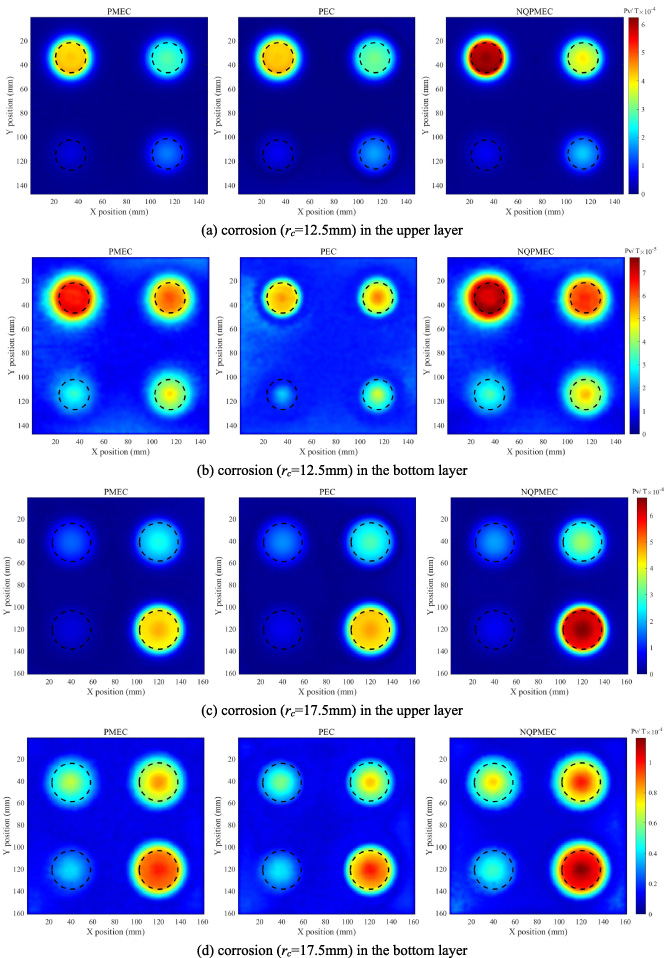
Imaging results via PMEC, PEC and NQPMEC.
SNRs of images of corrosion with the radius of 12.5 mm
To further analyse the performance of the fused feature, the signal-to-noise ratio (SNR) of the imaging result for each corrosion scenario is evaluated by using the equation: SNR = 20log10(S∕N) where, S and N denote the averaged magnitudes of the feature in the corrosion area and flawless region, respectively. Note that the corrosive and defect-free regions are defined in reference to the true specimen profile exhibited in Fig. 7(b). The computed SNR for every corrosion case is tabulated in Tables 2 and 3 along with Fig. 10 presenting the averaged SNR of each method. It can be seen from Table 2, Table 3 and Fig. 10 that the SNRs of NQPMEC are the highest compared with those of PMEC and PEC. This further indicates the superiority of NQPMEC alongside the fused feature to conventional signal features of PMEC and PEC.
SNRs of images of corrosion with the radius of 17.5 mm

Comparison of the averaged SNR of NQPMEC with PMEC and PEC.
In an effort to enhance the testing sensitivity and SNR, the excitation signal of PMEC is analysed and subsequently optimised by integrating harmonic characteristics of the carrier wave with pulsed characteristics of the modulation wave, leading to NQPMEC extended from the traditional PMEC. A semi-analytical model of NQPMEC inspection of a layered conductor is established for analysing the signal characteristics. Through theoretical simulations, a fused feature is proposed to further utilise the harmonic and pulsed characteristics of the resultant NQPMEC testing signals for imaging and evaluation of the corrosion hidden at the interlayer of layered conductors. The theoretical investigation has revealed that the fused feature of NQPMEC has the highest sensitivity, compared with the features of PMEC and PEC. This is supported by the experimental results acquired by using the testing system built up for imaging of subsurface defects in layered conductors. From the cross-comparison of the obtained corrosion images via NQPMEC, PMEC and PEC, it is affirmed that in regard to detection and imaging of hidden corrosion in layered conductors, NQPMEC along with the fused feature is advantageous over traditional PMEC and PEC in terms of the testing sensitivity and SNR.
Following the current work, further investigation involves: (1) the mining of signal features particularly in regard to the multi-frequency harmonics in the testing signal; and (2) the feature fusion for sophisticated combination of various features with harmonic and pulsed characteristics.
Footnotes
Acknowledgements
The authors would like to thank the National Natural Science Foundation of China (Grant numbers: 52177007, 11927801), National Magnetic Confinement Fusion Program of China (Grant number: 2019YFE03130003) and Fundamental Research Funds for the Central Universities of China (Grant number: XZY022022011) for funding this research.