
Abstract
In recent years, ultra-compact electric vehicles have gained increasing interest. These vehicles can easily make turns owing to their compactness, and they have a low impact on the environment. However, exterior road and wind noises have a large impact on occupant comfort in the interior space because an electric motor is used instead of an internal combustion engine. Therefore, an active noise control system using control sound or masking for ultra-compact electric vehicles was studied. To select the sound used for masking, a sound containing 1/f fluctuation, which has a relaxing effect on humans, was investigated. In the study of 1/f fluctuations, various analysis methods for comfort evaluation are used. However, a method of detecting sounds including 1/f fluctuations has not been established and clarified. Thus, a basic study of 1/f fluctuations was performed to select the sound to be used for the masker. Furthermore, brain waves of participants were measured in cases in which participants heard sounds including or not 1/f fluctuation. The results revealed that sounds including 1/f fluctuation of amplitude and frequency helped participants to relax.
Introduction
Recently, ultra-compact electric vehicles (EVs), with one or two seats, with ultra-compact mobility, have been considered as new transportation tools. Ultra-compact EVs have little impact on the environment, and the use of ultra-compact EVs is expected to spread to urban areas and areas where public transport is not maintained [1–3]. However, the spread of these vehicles is inadequate. The obstacle to the spread of these vehicles is that the driving assistance system for ultra-compact EVs has been considerably reduced compared with that of conventional vehicles because of interior space and weight limitations of the vehicles. In particular, because the outer plate of the ultra-compact EV has low rigidity, the road noise generated by tire rotation and the wind noise generated from the projection shape of the vehicle are transmitted to the inside of the vehicle. This interior noise can be detrimental to passenger comfort [4]. The demand for ultra-compact EVs is expected to increase. However, the research and development of noise control systems as noise countermeasures for ultra-compact EVs have been insufficient.
The reduction of low-frequency noise using active noise control (ANC) [5,6] through the wall surface vibration of the vehicle and the increase in ride comfort achieved through noise masking by using the sound signal from the secondary noise source [7,8] have been studied. In the study of masking for interior noise, sound signal analysis has been performed to use masking to improve passenger comfort.
Studies on masking have focused on the 1/f fluctuation, which is expected to have a significant relaxation effect [9–11]. In the 1/f fluctuation, the power spectral density is inversely proportional to the frequency f [12]. Recently, research on the psychological influence of sound signals including 1/f fluctuation has progressed and increased in various fields [13,14]. However, no calculation method of 1/f fluctuation in the sound signal has been developed, and the sound signal information in research on sound signals including 1/f fluctuation is insufficient. Furthermore, an index that shows whether the CD in the hearing effect includes 1/f fluctuation has not been established.
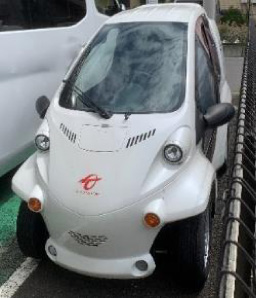
Ultra-compact EV.
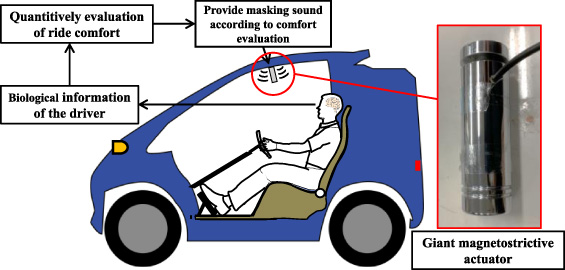
Proposed ANC system for the ultra-compact EV.
According to Musya, a 1/f fluctuation exists in the changes of the acoustic power and instantaneous frequency [15]. However, a calculation method of these changes from the sound signal has not been clarified.
In this study, a numerical analysis method for 1/f fluctuation of the sound signal for masking the interior noise was examined, and comfort evaluation was conducted using different fluctuation coefficients to improve the comfort of ultra-compact EVs. A fundamental consideration of the established calculation methods for the frequency and amplitude fluctuation coefficient by discrete Fourier transform was conducted using time changes to clarify the 1/f fluctuation in the sound signal. In addition, experiments on the relationship between the fluctuation coefficient and comfort were performed using brain waves measured when the participants listened to music including different fluctuation coefficients to clarify the evaluation of comfort using different calculated fluctuation coefficients.
Interior noise of the ultra-compact EVs and current status of countermeasures
Figure 1 shows an ultra-compact EV. The interior noise during driving in an ultra-compact EV is composed of 1000–5000 Hz from wind noise and 100–500 Hz from road noise. These noises have a massive impact on the interior space [16–20]. In conventional vehicles, sound-absorbing materials are installed inside the vehicles. Furthermore, some luxury vehicles have an ANC system with a controlling sound generated by a speaker installed in the cabin [21,22]. However, it is difficult to control noise in ultra-compact EVs using noise reduction materials because of the space limitation and weight of the vehicles.
Countermeasure for interior noise using masking by wall surface vibration
The use of an ANC system has been proposed for ultra-compact EVs as an alternative. This system utilizes a giant magnetostrictive actuator on the wall surface in the cabin instead of a speaker installed in the vehicle to generate a control sound through wall surface vibration for the noise transmitted from outside. The sound signal generated masks the interior noise, as shown in Fig. 2.
Improvement of comfort by masking
Research on improving the interior space using the masking effect has been progressing in various fields. In the masking phenomenon, Signal A is difficult to hear if Signal B exists against Signal A because of the increase in the minimum audible range. Masking technology has difficulty achieving complete masking when Signal A can only be heard with difficulty.
Interior sound control system using biological information about the passenger
To improve ride comfort, an interior noise control system was created for ultra-compact EVs, as shown in Fig. 2. With this system, it is possible to mask interior noise using an appropriate sound signal selected by estimating the psychological state of each individual from the data obtained by measuring the biological information of the passengers in real-time. The control sound signal for masking is generated by wall surface vibration using the giant magnetostrictive actuator. The estimated state of the driver is based on brain wave data. Brain waves can be used to estimate the status of the driver ranging from drowsiness to excitement by measuring the frequency of the electrical signal in the brain.
In this study, the focus was on the sound signal for masking in the proposed system. Methods of calculating the 1/f fluctuation coefficient were considered. Furthermore, the comfort obtained using a sound signal including 1/f fluctuation was quantitatively evaluated using measured brain waves.
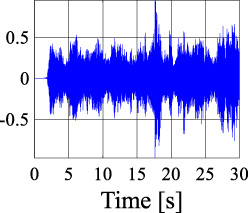
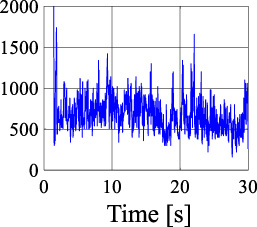
Wav data of sound signal.
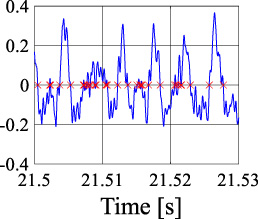
Cutting out the sound signal.
Time history of RMS.
Fluctuation coefficient of the entire sound signal
Fluctuations including a sound signal were analyzed using a wav file providing the time history of the sound signal, as shown in Fig. 3. The spectrum exhibited the discrete Fourier transform, as defined in Eqs (1) to (4).
The least squares method was used to calculate the slope of the spectrum. The relationship between frequency f and spectrum F is given as follows:
The instantaneous frequency of the sound signal was calculated using the zero-cross method for the time history of sound signal data. This method is used to calculate the frequency from the number of times the amplitude value of the sound signal intersects the zero point at a certain time, as shown in Fig. 4. In this study, the time interval between counting the zero-cross of the sound signal for the frequency was 25 ms to detect frequencies of more than 20 Hz, which is the absolute threshold of human hearing. The average frequency in each interval was obtained using Eq. (5):
Calculate the results of each the fluctuation coefficient.
The changes in amplitude value of the sound signal were calculated using the root mean square (RMS) for the time history of the sound signal data. The calculation interval of the amplitude value was 25 ms — the same as that of the fluctuation in frequency. The spectrum was calculated using the discrete Fourier transform, as defined in Eqs (1) to (4). The time history of the RMS was used to analyse the fluctuation, which provides the change in amplitude. The fluctuation coefficient 𝜆 was defined by calculating the spectral slope from 0.05 to 0.5 Hz. In this study, the fluctuation coefficient of the amplitude 𝜆 a , was defined using the above method.
How to evaluate the fluctuation coefficient
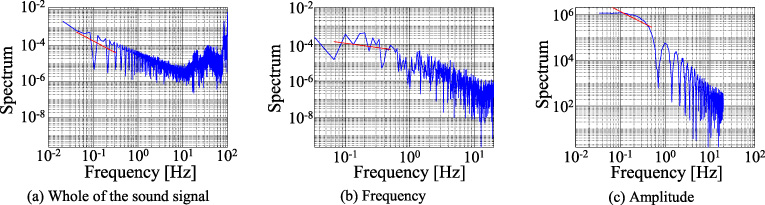
Each fluctuation coefficient was calculated using the calculation method in Section 3. Figure 6 shows the sample result of the spectral slope obtained by the above equations. 1∕f fluctuation means the power spectral density is inversely proportional to the frequency f. In this paper, we considered that the closer the fluctuation coefficient value is to −1, the more comfortable it is for humans. In the figure, (a) is the spectrum of the sound signal, (b) is the spectrum of the frequency, and (c) is the fluctuation of the amplitude. The red line, which is the spectral slope in the figures, shows that 𝜆 m is −1.31, 𝜆 f is −0.98, and 𝜆 a is −0.48. Therefore, it can evaluate that this sound signal includes the 1∕f fluctuation of frequency and does not include 1∕f fluctuation of spectrum or amplitude.
Comfort evaluation of sound signal by different calculated fluctuation coefficients
Fluctuation coefficient of music using experiment
For the experiment, the fluctuation coefficients for three music samples and one noise sample were calculated using the calculation method in the previous section. Figures 7(a)–(d) show the result of the spectral slope. In all figures, the blue and orange lines are the frequency fluctuation and amplitude fluctuation slopes, respectively. From Fig. 7, we considered that music C is the most comfortable effect for human. In this study, we defined that 1∕f fluctuation was included in the music whose spectral slope is in the range of −1 ± 0.2.
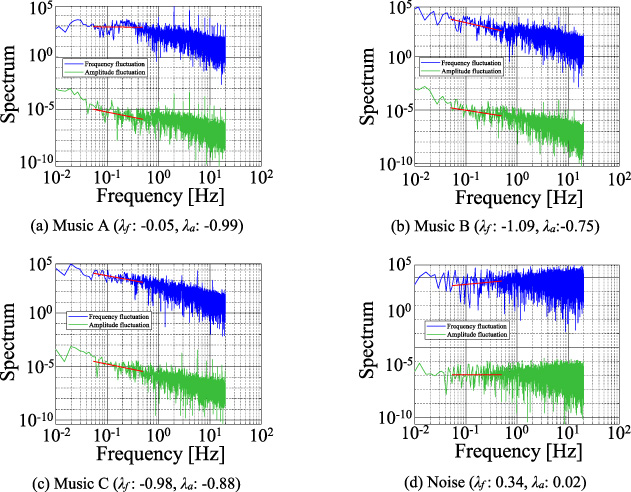
Calculation result of each music and noise fluctuation coefficient.
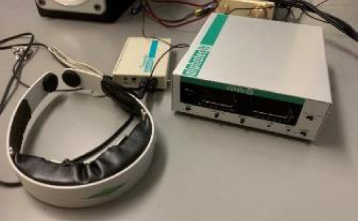
Electroencephalography (alphatech IV).
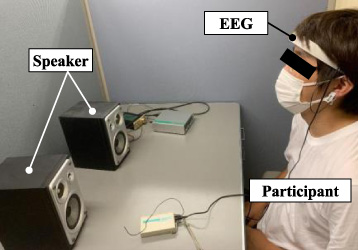
Participant sits in front of the speaker with EEG.
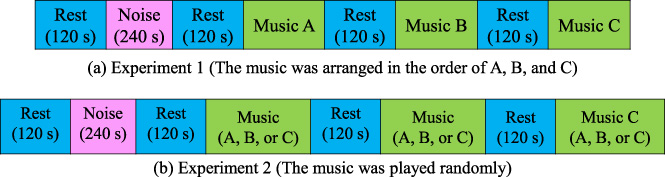
The experimental flow.
In the comfort evaluation when the participant listened to different music samples including each fluctuation coefficient, electroencephalography (EEG) for obtaining the biological information to quantitatively evaluate the comfort as shown in Fig. 8. For comfort evaluation using the brain wave, the 𝛽 wave decreases as an evaluation criterion for comfort evaluation using the brain wave. During the experiment, the brain waves were measured while staring at an empty wall as shown in Fig. 9 to suppress changes in brain waves due to visual information as much as possible.

Result of 𝛽 wave appearance rate for listening to each music and noise including different fluctuation coefficients.
In this experiment, we conducted a total of three experiments by two experimental methods using one noise and three music that were analyzed for fluctuations in the previous section. The experimental flow shows in Fig. 10. From Fig. 10(a), the participants take rest for 120 seconds before listening to sound and measured brain waves. Next, the participant listens to noise and measures the brain wave for 240 seconds. After listening to the noise and measuring the brain waves, the participant takes a rest for 120 seconds. After resting for 120 seconds, the participant listens to music A, B, and C according to Fig. 10 (a). During listening to music, the brain wave was measured for each music. In this experiment, the participant takes a rest for 120 seconds between music A, B, and C. Figure 10(b) was also the same as experimental flow 10(a). The music was arranged in the order of A, B, and C in Fig. 10(a). On the other hand, the music was played randomly, and the brain waves were measured in Fig. 10(b). In this experiment condition, the experimental participant was a man in his 20s.
The experiment results are shown in Fig. 11. The y-axis is the 𝛽 wave appearance rate, and the x-axis is the experiment number. The 𝛽 wave appearance rate decreased compared with listening to noise and music including fluctuation in all the experiments.
Music sample C with the frequency and amplitude fluctuation coefficient both close to −1 had the most decreased 𝛽 wave appearance rate compared with those of music A and B. Furthermore, sample C had the most decreased 𝛽 wave appearance rate regardless of the order in which the music was played. Moreover, the experiment was performed multiple times and we also experimented with changing the order of the sound signal. From the results, we have confirmed that the results are similar in this paper.
Conclusion
A numerical analysis method for sound signals with the 1/f fluctuation was studied for masking interior noise of ultra-compact EVs, and comfort was evaluated for different fluctuation coefficients to improve passenger comfort. Regarding a sound signal including 1/f fluctuation, fundamental considerations on the established calculation methods of the frequency and amplitude fluctuation coefficient by the discrete Fourier transform using time changes were investigated to clarify the 1/f fluctuation in the sound signal. Experiments were conducted on the relationship between the fluctuation coefficient and comfort using measured brain waves when the participant listened to music with different fluctuation coefficients to evaluate comfort. In all experiments, the 𝛽 wave appearance rate decreased compared with listening to noise and music including fluctuation. Music sample C with frequency and amplitude fluctuation coefficients close to −1 had the most decreased 𝛽 wave appearance rate compared with sample A with an amplitude fluctuation coefficient close to −1 and sample B with a frequency fluctuation coefficient close to −1. Furthermore, sample C had the most decreased 𝛽 wave appearance rate regardless of the order in which the music was played.
In the future, we will clarify the relationship between the fluctuation coefficient and comfort from the results of more experimental participants. Furthermore, we will create a driving environment using a simulator and examine the relaxing effect and tendency in the driving state.