
Abstract
The top oil temperature in ultra-high voltage (UHV) reactors has attracted enormous interest due to its wide applications in fault diagnosis and insulation evaluation. In this work, the precise prediction method based on the Seq2Seq module with the convolutional block attention mechanism is proposed for the UHV reactor. To reduce the influence of vibratility and improve computational efficiency, a combination of the encoding layer and decoding layer named Seq2Seq is performed to reconstruct the complex raw data. The convolutional block attention mechanism (CBAM), composed of spatial attention and channel attention, is utilized to maximize the use of information in data. The Seq2Seq-CBAM is established to forecast the variation tendency of the oil temperatures in the UHV reactor. The experimental results show that the proposed method achieves high prediction accuracy for the top oil temperature in both single-step and multi-step.
Keywords
Introduction
In the transportation of electric energy, ultra-high voltage (UHV) transmission has the characteristics of large capacity, low loss, etc. [1], and UHV transmission lines are being vigorously developed [2]. The reliability of transformers, reactors, and circuit breakers guarantees the operation of UHV transmission lines [3]. High-voltage shunt reactors play an important role in transmission networks. The main functions are reducing the capacity rise effect of the UHV transmission line at no load or light load, suppressing over-voltage, and optimizing UHV lines voltage [4]. Due to the large capacity and high voltage, the internal heating of the UHV reactor is severe and easy to cause insulation damage. It is difficult to judge the internal insulation status of UHV shunt reactors directly. Oil temperature can reflect the internal insulation status of UHV shunt reactors [5].
In recent years, with the development of smart monitoring of high voltage assets, the relevant datasets, such as oil temperature, load, etc., have been collected and have the advantages of high sensitivity, high precision, low cost, and high integration [6]. Catterson et al. [7] bridged between the smart grid and insulation communities and examined various technologies considered under the smart grid umbrella and studied how these affect electrical insulation. Based on the development of smart monitoring technology, there is a data basis for reactor oil temperature prediction. If oil temperature can be predicted in advance, the insulation status of the UHV shunt reactors can be evaluated in time to improve their operational reliability and safety.
Owing to its outstanding ability to predict complex data, some machine learning models have been widely used in transformer and reactor state research. Many scholars used SVM and grey prediction to perform parameter prediction, including oil temperature and dissolved gases in oil [8–10]. In some cases, machine learning is more precise than other statistical methods, but a single model still has inherent limitations in performance and robustness [11]. Fei et al. [12] proposed a hybrid model of RVM and PSO to predict dissolved gas content in transformer oil. Particle swarm optimization (PSO) is applied to choose the appropriate embedded dimension, and RVM is used to do single-step and multi-step prediction. Zeng et al. [13] proposed a model for predicting the dissolved gas concentration in the power transformer based on the modified grey wolf optimizer and the least squares support vector machine (MGWO-LSSVM). Hu et al. [14] developed an optimized support vector machine (SVM) based on particle swarm optimization (PSO) to establish diagnosis and prediction models and perform optimization selection on the parameters of the models.
Machine learning algorithms face the problems of over-fitting and local optimum when processing high-dimensional data [15]. Deep learning models, including LSTM, GRNN, etc., are introduced to predict parameters in the transformer. The parameters include oil temperature, winding temperature, dissolved gases in the oil, etc. The authors in [16–18] developed the model of LSTM to determine the correlations between historical status monitoring information and the gas content in the forecasting time. The result showed that the model achieves greater forecasting accuracy than the grey model, backpropagation network, and support vector machine model. Qi et al. [19] considered the time-series theory and oil chromatography data characteristics and proposed a deep recurrent belief network (DRBN) model for transformer state prediction. Liu et al. [20] presented a time series forecasting model based on the seasonal autoregressive integrated moving average (SARIMA) model.
As complex datasets are used for forecasting models, feature extraction methods are introduced to consider the relationship between features and reduce data redundancy. The authors in [21,22] proposed kernel principal component analysis (KPCA) to consider the nonlinear components in the original data and select the main features to avoid the influence of redundant features. Lin et al. [23] proposed conditional mutual information (CMI) to simultaneously analyze correlation and redundancy between variables. Using the CMI value as the index to screen out features can ensure low redundancy on the premise that the selected feature is strongly correlated with the predictive target.
Despite effective results, feature extraction can only remove redundant data in one dimension. This has limited improvement in the prediction accuracy of the prediction model [24]. Due to the same ability to remove redundant information and not limited by the data dimension, many scholars have begun to study the attention mechanism [25]. Common attention mechanisms include self-attention [26], Bahdanau attention [27], Luong attention [28], etc. Owing to the advantages of processing high-dimensional data, attention mechanisms are widely used in the electrical field. Zhang et al. [29] proposed a remaining useful life prediction model based on dual-aspect self-attention, which works in parallel to extract features of different sensors and time steps simultaneously. Qin et al. [30] employed the long short-term memory (LSTM) architecture in the load prediction model, supported by an attention mechanism to prevent performance deterioration. The above studies only analyzed the correlation between the different features or time steps and could not combine them to figure out optimal attention values. A convolutional block attention module (CBAM) is proposed in this work, which can figure out attention values calculated by blending cross-channel and spatial information [31]. Wang et al. [32] proposed a novel convolutional neural network with a non-local convolutional block attention module (NCBAM) to automatically classify ECG heartbeats. The result showed that NCBAM achieves a noticeable improvement in classifying ECG heartbeats. Therefore, inspired by the works of Wang and his colleagues, this work applies the CBAM originally applied in the field of image recognition to the prediction of the oil temperature of the reactor.
The UHV reactor datasets’ intense volatility affects the computational attention value of the attention mechanism. Many scholars began to study the algorithms of EMD and VMD, decomposing the non-stationary series data into stationary subsequences with different scales [33]. Wang et al. [34] overcame the problem that traditional prediction methods have less consideration of the interaction between different trend items in the oil temperature series and proposed the VMD (Variational Modal Decomposition) and GRU (Gated Recurrent Unit) neural network to predict top oil temperature. Ruan et al. [35] proposed a hybrid prediction model based on modal decomposition. The variational mode decomposition (VMD) technique was used to decompose the original sequence into more robust subsequences. The LSTM neural network model was used to predict each subsequence. The result showed that the proposed hybrid model improves the prediction accuracy and robustness. Establishing forecasting models for each subsequence takes time and computer resources. In this work, the Seq2Seq structure involving an encoder and decoder is proposed to overcome the above problems and normalize noise [36].
In this paper, a top oil temperature forecasting method based on sequence to sequence (Seq2Seq) structure using a convolutional block attention mechanism (CBAM) is proposed. The Seq2Seq framework is used to convert the original sequence to a new sequence by the encoder, enabling the model to quickly learn the timing relationship between the data. The predicted data is decoded through the decoder. Then, the CBAM is established to calculate attention scores using two dimensions of information to preserve data information and avoid losing critical information. The Seq2Seq-CBAM reduces the impact of large fluctuations in the original data and overcomes the problem of predictive models being affected by redundant information. The proposed prediction framework achieves high prediction accuracy for the top oil temperature in the UHV reactor and can be easily deployed in online monitoring scenarios.
Structure of reactor and operation parameter
High-voltage shunt reactors are the essential equipment commonly used in a high-voltage power grid, which can effectively compensate for the capacitance of a high-voltage transmission line, absorb its reactive power, and prevent the voltage increase caused by excessive capacity when the power grid is light. The data parameters collected by the online monitoring device on the reactor are shown in Table 1. The external structure of the UHV reactor comprises bushing, an oil-expansion chamber, a gas-actuated relay, and various temperature gauges. The oil-expansion chamber is one of the most critical parts of the shunt reactor, which is installed in the upper and connected with the reactor oil tank with a bend. The function of the chamber is to compensate for the thermal expansion and contraction volume to avoid direct contact between transformer oil and the atmosphere. The temperature of the oil in the oil-expansion chamber is an essential index for the evaluation of the state of the reactor [37], affected by various factors such as environment temperature, load, and the operational status of the internal components [38]. The external structure of the reactor is shown in Fig. 1, comprised of seven parts: heat sink, bushing, oil-expansion chamber, gas-actuated relay, thermometer for winding, thermometer, and control box.
Description of thermal parameters and related factors
Description of thermal parameters and related factors
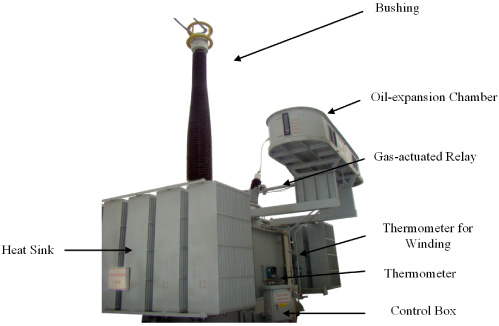
The external structure of reactor.
Winding temperature dramatically influences the transformer insulation and is closely related to the top oil temperature [39]. The same goes for reactors. The reactor insulation oil is affected by temperature and breaks down into low-molecular hydrocarbon gases during operation, in which H2, C2H2, and total hydrocarbon hold the highest weights [40]. The load is always an important indicator that impacts the status of the reactor. Environmental factors such as temperature and relative humidity can improve the model’s accuracy. In this paper, temperature and relative humidity are used due to their great influence on the top oil temperature [41].
In conclusion, oil temperature (OT), winding temperature (WT), total hydrocarbons (TH), H2, C2H2, environment temperature (ET), load, and relative humidity (RH) are chosen as features to predict top oil temperature.
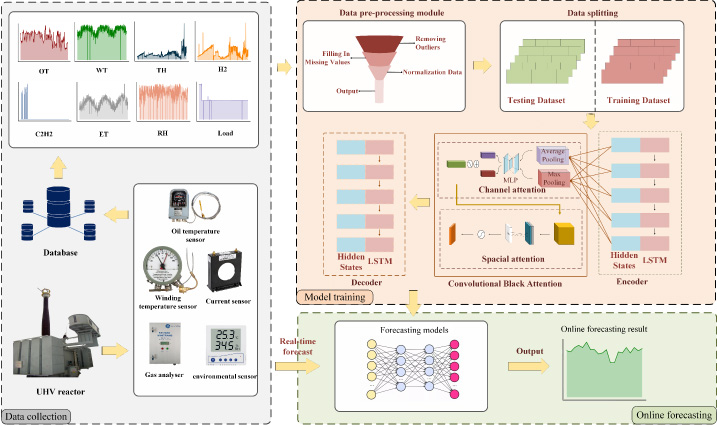
Procedure of training, forecasting and deployment based on Seq2Seq-CBAM.
In this study, a novel hybrid system based on Seq2Seq and CBAM mechanism is proposed for oil temperature forecasting in the reactor, as shown in Fig. 2, comprised of three parts: data collection, model training and online forecasting. The specific training, forecasting and deployment process are described as follows.
The historical datasets are collected by online monitoring sensors from the UHV substation, including the oil temperature sensor, winding temperature sensor, current sensor, gas analyzer, and environmental sensor. The various data is transmitted to a remote database for real-time storage.
After reading the data from the remote database, it first performs data pre-processing and then divides the data into the training set and test set and inputs it into the Seq2Seq-CBAM model to train the model.
The real-time data is directly input into the trained model, and the predicted value of oil temperature is output.
Data pre-processing method
(1) Data cleaning
The operating environment of reactors, transmission lines, and gas insulation systems are complex and diverse. Environment interference and limitations of measurement techniques result in original monitoring data containing abnormal data involving outliers and missing values. In the paper, the K-means algorithm is used for anomaly detection. K-means divides each variable into clusters: a cluster for abnormal data and a cluster for normal data. All abnormal data are removed. The missing data is filled by the result calculated by the multiple imputations by the chained equations (MICE) Algorithm.
(2) Data normalization
Different features of input data usually have different scales and units, which affects the results of data analysis. In order to eliminate the impact of the scale between features, data standardization is needed to be used in the forecasting module. Min-max normalization is adapted in the forecasting module and is the most common normalization method. The formula is as follows.
After normalization, the data is in the interval of [0,1], and the various features on different scales can also be compared in parallel. In the training module, the data after normalization can accelerate the gradient decline to the optimal solution speed and improve forecasting accuracy.
Seq2Seq model belongs to one of the encoder-decoder structures, as shown in Fig. 3, including LSTM, hidden states, convolutional block attention mechanism, and attention values calculated by CBAM.
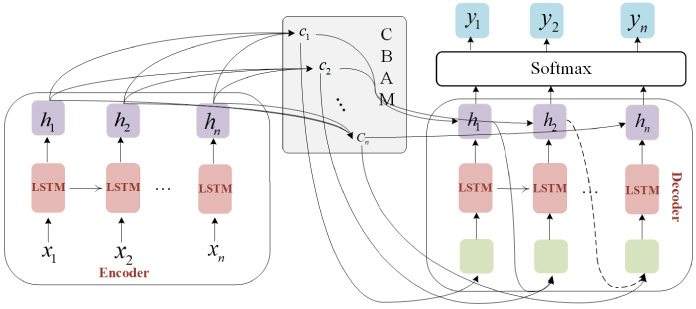
The structure of Seq2Seq.
The basic idea is to use one RNN as the encoder and the other RNN as the decoder. The encoder is responsible for compressing the input sequence into a vector of a specified length, which can be thought of as the semantics of the sequence, and the process is called encoding. The decoder section decodes based on the vector output of the encoder section. Traditional Seq2Seq uses RNN as encoder and decoder layers, which cannot handle long-distance dependencies and the problem of gradient disappearance. In this paper, LSTM is adapted to deal with the problems of RNN, as shown in Fig. 4, including four parts: Forget gate, Input gate, Output get, and Cell gate.

The structure of LSTM.
The internal formulas can be expressed as follows:
The main function of Seq2Seq is to use the memory ability of LSTM for time series to extract the time series features in the original data and obtain the reconstructed data. Since the reconstructed data is composed of time series features in the original data, the data distribution is smoother. The essence of the forecasting model is to analyze the law of data changes. The less fluctuating and more stable data can be easily learned by the forecasting model.
The attention mechanism is widely used in various realms, including image processing, speech recognition, and natural language processing. This mechanism imitates human vision, which can quickly and effectively capture the vital part of the data [42]. Attention helps artificial neural networks make more accurate judgments by assigning different weights to their input characteristics, highlighting more critical influence factors, and reducing the calculation and storage of models [43]. Traditional attention mechanisms are limited by representation power and cannot handle high-dimensional and irregular data about UHV shunt reactors. In this paper, a novel attention mechanism named the convolutional attention block mechanism is introduced to calculate the relationship between different dimensions and figure out in-depth information between different points to increase representation power and ultimately improve forecasting accuracy, which has been proved to be a more robust representation ability [44]. The structure of CBAM is shown in Fig. 5. It can be seen that the module has two sequential sub-modules: channel attention and spatial attention. The channel module focuses on ‘what’ is meaning in the field of computer vision, but in a time series, it assigns different values to each feature. Consequently, those features representing most of the information would be assigned relatively considerable attention, and the other features would be assigned little attention, which has a similar function to feature extraction. The important parts of the data would be magnified, and redundant information could be used to a certain extent.
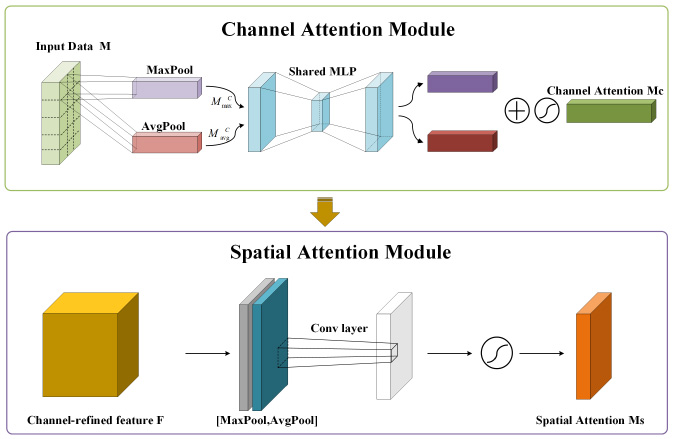
The structure of convolutional block attention mechanism.
The channel module contains max-pooling and avg-pooling, generating two different channel context descriptors,
For the spatial module, it focuses on ‘where’ the part of the information is in the realm of vision. However, in the time domain, it would dig into relationships of data in a different time, which is channel attention’s complement [45]. The mechanism is that the outline data or extreme values are assigned less attention, and the normal data is attached with greater attention. Through the module, abnormal data are ignored to some extent, and later models would focus more on normal data rather than being affected by outliers. In spatial attention, average-pooling and max-pooling are applied on channel-refined features F, resulting from a multiplying of M
c
and input data M, and generate a feature descriptor. Behind the pooling module, a convolution layer is adapted to generate a spatial attention map M
s
. Spatial attention module is given by
Datasets
To demonstrate the performance of the proposed Seq2Seq-CBAM model, the historical monitoring data of the UHV reactor in three ultra-high-voltage transmission lines from province A to province B (line AB) and from province A to C (line AC) and from province B to C (line BC) are used. The UHV reactor is a single-phase oil-immersed reactor, and the rated capacity of the high voltage side is 1000 MVA, the rated line voltage is 1050 kV, and the rated current is 1649.6 A. The monitoring period for data is one day. The databases involve oil temperature and winding temperature, environment temperature, load, humidity, and gas concentration like total hydrocarbons, H2, C2H2. The multi-dimension data spanning three years are divided into three parts: training set, test set, and validation set. The proportion of training and test set in the whole dataset is 8.5: 1.5, and the proportion of the train and validation set in the training set is 1:1.
In this study, the proposed hybrid forecasting module is compared with the Seq2Seq module based on Bahdanau attention [27], Seq2Seq, LSTM, bi-directional long short-term memory (BiLSTM), LSTM module based on Bahdanau attention, convolutional neural network (CNN), CNN based on Bahdanau attention, general regression neural network (GRNN), XGBoost, ensemble learning (EL), extreme learning machine (ELM) and gradient boosting decision tree (GBDT) to test the performance and computation efficiency of the proposed module in single and multiple step prediction.
All experiments are conducted on PC equipped with Intel® i7 CPU, 72 G memory and NVIDIA® GTX 1080 Ti GPU.
Hyperparameters
Hyperparameter directly affects the accuracy of the module. To improve the accuracy of forecasting, the control variable method is adopted to compare the forecasting accuracy of models with different learning rates, batch sizes, units in LSTM, the kernel size in CBAM, and the order of spatial attention and channel attention. This section uses MAPE (Mean Absolute Percentage Error) to evaluate the accuracy.
Set batch size, units in LSTM and kernel size to 10, 32 and 3, and test the optimal parameters of learning rate. Table 2 lists the proposed model’s forecasting accuracy with different learning rates. In line AB and line AC, the forecasting accuracy is the highest when the learning rate is 0.005. The accuracy is significantly low when the learning rate is more significant than 0.005, indicating that many neurons are over-fitting. The accuracy decreases slightly when the learning rate drops to 0.001, which means a weaker convergence. The proposed model gets the highest accuracy in line BC when the learning rate is 0.001. The proposed model also achieves high accuracy when the learning rate is 0.005 in line BC, and the final learning rate is 0.005.
Accuracy of models with different learning rates
Accuracy of models with different learning rates
Batch size also directly affect the performance of the module. Set learning rate, units in LSTM and kernel size to 0.005, 32 and 3, and test the optimal parameters of Batch sizes. Table 3 lists the forecasting accuracy of the proposed model with different batch sizes. The forecasting accuracy is the highest when the batch size is 10 in three databases. The accuracy is the smallest when the batch size is set to 1. There are too many neurons that cause the under-fitting. The accuracy is still lower when the batch size exceeds ten because the module falls into the local optimum. The final batch size is set as 10.
Accuracy of models with different batch sizes
Accuracy of models with different units
LSTM is used as the encoder and decoder. The number of units in LSTM affects the effect of encoding and decoding. Set learning rate, batch size and kernel size to 0.005, 5 and 3, and test the optimal parameters of units in the LSTM. Table 4 lists the accuracy of models with different units. In all three lines, the forecasting accuracy is highest when the units are 32, indicating that the encoder and decoder process the dataset most accurately.
In the spatial attention model, the convolution layer is applied, and the kernel size setting in the convolutional layer affects the accuracy of the attention values. Set learning rate, batch size, units in LSTM to 0.005, 10 and 32, and experiment with the kernel size parameter. Table 5 lists the accuracy of models with different kernel sizes. When the kernel size is set to 3, the model is most accurate on the three lines, indicating that the convolutional layer calculates the accurate attention value.
Accuracy of models with different kernel size
In CBAM, the order of spatial attention (SA) and channel attention (CA) also affects the module’s performance. Based on the above parameter experiments, the learning rate, batch size, units in LSTM and kernel size are set to 0.005, 10, 32, 3, and the influence of the order of spatial attention and channel attention on prediction accuracy is tested. Table 6 lists the forecasting accuracy of the proposed model with different orders of SA and CA. The result shows that the proposed model gets high accuracy with the order of channel attention and spatial attention.
Accuracy of models with different order of SA and CA
In order to verify the advantages of the convolutional block attention module, the two parts of CBAM are used separately to test its good representation power. Representation power means utilizing more typical data to represent the original data. In typical data, the vital information in raw ones would be magnified, and redundant information would be ignored to the same extent. In this part of the experiments, the two components of CBAM are tested separately to verify spatial and channel attention functions.
To test the representation power, the database about line AB after normalization is solely inputted to each module to avoid the effect of different scales in the different features. The input data dimension is three named C ∈ Rb×m×n, in which b, m and n represent the number of samples, the number of days in each sample, and the number of features in each day, respectively. In this experiment, b, m, n are 1036, 1, 8, respectively.
In the part of spatial attention, the output results are extracted to figure out the variance of each feature and compare with the normalized data, as shown in Fig. 6. It can be seen that the data variance after the spatial attention mechanism is much smaller, indicating that spatial attention comprehensively compares the situation of the data in each sample, and the outline samples or extreme values are assigned with less attention.
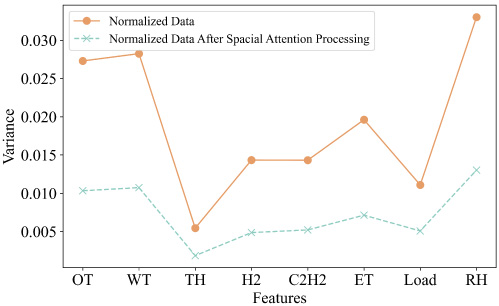
The variance comparison before and after spatial attention.

The datebase channel attention weight heatmap.
Similarly, in the part of the channel attention experiment, because databases’ channel attention data are too large, only 365 channel attention data in the year 2017 are extracted to show in Fig. 7. It is shown that the channel attention module mainly gives attention on winding temperature, environment temperature, and concentrations of H2 and C2H2. Other features, like humidity, load, etc., are assigned smaller values. The results show that winding temperature, environment temperature, and the concentrations of H2 and C2H2 are essential to the data. It is entirely reasonable because those temperature factors are crucial to affecting the operating state of the reactor, and C2H2 and H2 are generated by excessive oil temperature and electrolysis [4], which also reflect the reactor operating state and are adopted to assess reactor condition [46]. It can be seen that channel attention compares the importance of each feature and gives different attention to each feature.
In the three UHV transmission lines, with the above-mentioned optimal parameters set, the proposed Seq2Seq-CBAM is trained on the total training set for one-step-ahead forecasting and is tested on the test set. The curves of the single-step prediction of the test set on three lines are drawn, as shown in Fig. 8. It can be seen that the Seq2Seq-CBAM model has a slight deviation from the actual values.
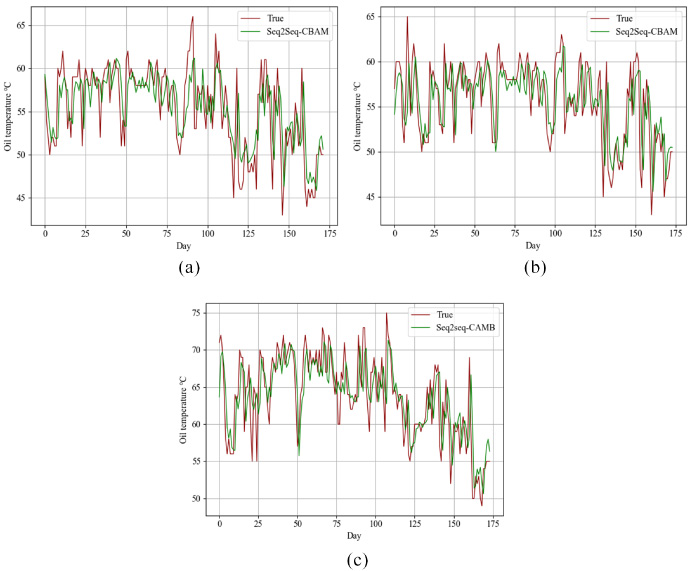
The curve of forecasting under the proposed model on the test set. (a) Forecast results of line AB. (b) Forecast results of line AC. (c) Forecast results of line BC.
To validate the proposed approach, comparisons are made with twelve other forecasting models, including Seq2Seq-Bahdanau attention, Seq2Seq, LSTM, BiLSTM, LSTM-Bahdanau attention, CNN, CNN-Bahdanau attention, GRNN, XGBoost, EL, ELM and GBDT, in which the EL model includes LinearRegression, RandomForestRegressor, and LinearSVR. Table 7 lists RMSE, MAE, and MAPE as the lowest in the proposed module. MAPE is more than 1% lower than that of other models. The indicators of RMSE and MAE are also 0.5 or so lower than those of other models, indicating that the proposed model’s forecasting precision and generalization performance outperform others.
Comparison of errors of different models on the test set
To further prove the efficiency of the proposed method, a comparison is carried out between the proposed approach and the above models on the test set. From Table 8, the prediction accuracy decreases gradually as the prediction scale increases because the large prediction scale decreases the dependency on the time series. In the three transmission lines, with the increase of the prediction step, the prediction errors of the twelve comparison models gradually increase, and the errors of CNN, CNN-Bahdanau, GRNN, ELM, XGBoost, GBDT, and EL increase rapidly. Seq2Seq-Bahdanau, LSTM, BiLSTM, LSTM-Bahdanau, and Seq2Seq can keep the error stable to a certain point in multi-step prediction. The twelve comparison models are limited in the accuracy of multi-step prediction, which indicates that comparison models are difficult to use effectively for long-term information. The Seq2Seq-CBAM model performs significantly better than the other models and shows a relatively small loss of accuracy with the increase of prediction steps, indicating that CBAM amplifies useful information in the data and enables the model to learn long-term trends.
Performance comparison of multi-step prediction on the test set
The proposed model is applied to the online detection scenario. It is meaningful to examine the computation time. A CPU time experiment is performed on the proposed model and the comparison models.
The comparison of CPU time for forecasting is listed in Table 9. XGBoost, ELM, and GBDT are three basic algorithms that are easy to implement. Therefore, these models are faster than deep learning models. The EL takes about 2.1, 1.2, and 1.1 seconds for the three lines of forecasting tasks, respectively. EL combines three machine learning models and takes more time than other machine learning models. Seq2Seq-Bahdanau, Seq2Seq, LSTM, BiLSTM, LSTM-Bahdanau, CNN, CNN-Bahdanau, and GRNN spend more time in three lines forecasting. Seq2Seq-Bahdanau and Seq2Seq use LSTM as the encoder and decoder, and the model structure is more complex. Therefore, the models take more time than the single LSTM and BILSTM. The principle of CNN is to do convolution operations, and this model structure is more superficial than LSTM. CNN spends 9.5, 10.1, and 10.3 seconds on the three lines forecasting tasks, and CNN-Bahdanau spends more time than CNN. As for Seq2Seq-CBAM, spatial and channel attention models make data easier to analyze. Therefore, the CPU time of Seq2Seq-CBAM for three lines is 25.6, 24.5, and 24.8 seconds, respectively, which is not much more than the other models. In a real scenario, the top oil temperature is predicted once a day. The time consumption of the proposed model is acceptable.
Comparison of CPU time for forecasting
Comparison of CPU time for forecasting
To further verify the efficiency of the training model, the loss curve of the models was drawn to compare the convergence of the models. The proposed model and comparison models are trained with the optimal parameters and set MSE as the loss function. The curves of the loss of about 100 epochs on the line AB training set and the validation set are shown in Figs 9 and 10. From Fig. 9, the error of the proposed model tends to be stable after training 40 epochs, and the error value is minimal. Deep learning models, including Seq2Seq-Bahdanau, Seq2Seq, LSTM, BiLSTM, LSTM-Bahdanau, CNN, and CNN-Bahdanau, are stable after more epochs, which means that CBAM accelerates model convergence. The construction of other machine learning models is relatively simple and can reach convergence quickly, and the errors are relatively large.

The curve of the loss on line AB training set.
From Fig. 10, the convergence performance of the proposed model on the verification set is the best. The proposed model gradually becomes stable within 30 epochs, and the error oscillation is small in the training process. The loss of other models fluctuates wildly in the validation set before 40 epochs. The LSTM and BiLSTM training errors tend to be stable after 60 epochs, and the loss of GBDT increases after 20 epochs, indicating that the model is over-fitting.

The curve of the loss on line AB validation set.
In this paper, the Seq2Seq model based on the convolutional block attention mechanism is established to forecast the top oil temperature of the UHV reactor. The Seq2Seq framework is used to convert the original sequence to a new sequence and avoid volatility in the original data. The convolutional attention mechanism assigns attention in both spatial and channel dimensions. Instead of traditional feature extraction and data cleaning, the CBAM can effectively use information in data and reduce the impact of abnormal data. The experimental results show that the proposed Seq2Seq-CBAM method can accurately forecast the variation trend of the top oil temperature in the next one to five days. The proposed model’s average RMSE, MAE, and MAPE outperform the other models. The proposed approach improves forecasting accuracy and performs better than other methods. Moreover, the experimental results prove that the time spent in the proposed model forecasting adapts to online prediction scenarios, and the model can converge quickly. In the future, we will focus on two directions: The first is to study new attention mechanisms with a powerful representational ability. Since the proposed model is only theoretical, the other direction is to deploy advanced models in the UHV reactor operation scenario.