
Abstract
With the development of non-destructive inspection techniques, more and more challenging situations have arisen and the correct choice of operating parameters can be decisive for a good detection sensitivity. Based on that, an algorithm was developed to obtain the best combination of an eddy current sensor operation parameters. The results obtained demonstrate the improvement in the cracks detection in welded parts after optimization.
Introduction
As inspection conditions become more challenging, there is a need for increased detection sensitivity. In the case of the eddy current technique, there are basically two ways to modify the inspection conditions, namely: changing the physical configurations of the coil or changing the operating parameters of the system. In the first case, the aim is to increase the sensitivity of detection through changes in the morphology of the sensors. This can occur by varying the geometry, wire diameter, number of turns and number of coils used and how they behave with each other [1–4]. Another way is to use different types of electromagnetic sensors together to help in the characterization of defects [5]. The second option, is to evaluate the behavior of eddy currents according to the change in operating parameters in the same coil. Among the possibilities, the one that stands out most is the excitation frequency, as this directly affects the currents induced in the material to be inspected. This is because, due to the skin effect, the depth of penetration of eddy currents in the material is inversely proportional to the frequency [6,7]. Added to this, the higher the frequency, the more cohesive the currents are [8]. The current way to define the frequency used in the tests is by calculating the standard depth of penetration or visual analysis of the signal in the equipment according to the standards. However, the choice of frequency through this methodology may not represent the optimal configuration and in more challenging cases it may lead to failure to detect the defect.
Thus, the present work aims to develop a methodology for optimizing the operating parameters of the eddy current technique. This will be carried out looking for the greatest differentiation between a signal of interest and an unwanted signal, to reach the configuration with the highest detection sensitivity. Precisely, the parameters reached will be responsible for generating a signal as required by the previously mentioned standards, in such a way that the obtained configuration can be used directly in the inspection equipment.
Methodology
Operating parameters
As well as the correct choice of sensors and caution with their movement during an inspection, the configuration of operating parameters is a crucial step to guarantee detection. Commercial eddy current equipment usually allows the setup of five operating parameters, these being: excitation frequency, probe drive, global gain, signal rotation and vertical gain (applied to the inductive component).
In this way, we can separate the parameters into two groups: physical and post-processing parameters. The first is formed by the frequency and probe drive, directly related to the alternating currents applied to the coil. The second, formed by the global gain, vertical gain and rotation, which are mathematical modifications of the signal acquired by the inspection system.
From these parameters, as we selected the highest possible probe drive value for the system, only the frequency and the combination of rotation and vertical gain can modify the shape of the inspection signal. Therefore, as these belong to different groups, first a methodology will be made to optimize the frequency and then the combination of rotation and vertical gain.
Optimization procedure
Frequency optimization
Of all the parameters, only the frequency values presents means to be determined or estimated. Firstly, through already established standards, such as ASME V article 8 mandatory appendix VIII [9], which defines for the specific case of nonmagnetic exchanger tubing that the frequency to be used must be between f90 and 2.1 × f90, Eq. (1). Where f90 is the frequency which generates a 90° phase separation between a shallow inside originated defect and a shallow outside originated defect, 𝜌 is tube material resistivity, t is tube wall thickness and 𝜇
r
is relative magnetic permeability. Another way is by calculating the standard depth of penetration. However, choosing the wrong depth or not knowing the conductivity and/or magnetic permeability can result in obtaining an ineffective frequency. Added to this, other methods that are based on obtaining a reference image, such as that the separation of the notch and lift-off signal must be 90°, have the definition of this parameter through trial and error [10].
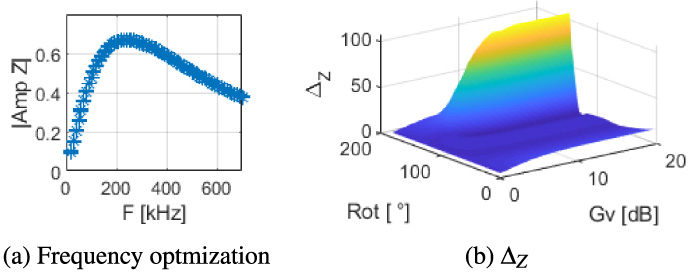
Therefore, to obtain the optimal operating frequency, inspection of the desired and undesired condition (for example, notch and lift-off respectively) was carried out inspections varying the frequency throughout the sensor’s operating range, keeping the rotation and vertical gain equal to zero. Subsequently, the signal amplitudes were calculated in each configuration and this value was correlated with the respective frequency. Through the result, the graph correlating the values was evaluated to define if there would be any trend or maximum amplitude.
With the frequency determined in the previous step, combinations of rotation and vertical gain are computationally made for the two inspection conditions. Subsequently, with each of the combinations, the maximum amplitude of the impedance vector are calculated for the desired and undesired situation.
In order to be able to compare the calculated results, a normalization was performed for both variables. This, called detection delta, was done in order to know in percentage how much the signal of interest is greater than the other signal. In Eq. (2) an example of the detection delta for the maximum amplitude of the impedance vector is presented.
Finally, a 3D graph is made relating the calculated values of the deltas with the respective combinations of rotation and vertical gain. Through the analysis of this graph, the values of these parameters are then defined.
To test the procedure, the condition of detecting notches in the root of clad steel weld joints will be considered.In this, the results obtained through the parameters chosen by the trial and error method, similar to some standards, will be compared with the results achieved through the optimized parameters. Finally, the optimized parameters will be used to inspect a welded joint containing a fatigue crack.
Results
For this analysis, the ability to detect the presence of fatigue cracks at the root of welded joints of clad steels will be considered. This inspection condition is encountered by autonomous tools, such as inspection PIG’s, when inspecting oil rigid pipelines.
First, to carry out the inspections, a differential probe formed by two coils in orthogonal configuration was used. This type of probe has the least influence on lift-off variations and the best performance for inspection of complex geometries. Together, in order to simulate the inspection condition, a clad steel specimen containing an EDM notch at the root of the weld joint measuring 10 mm × 0.25 mm × 2 mm (length, width and depth) was used, Fig. 1. Thus, in the case in question, the region of interest is formed by the weld plus notch joint and the “non-interest” region would be the weld without notch.

CLAD sample.
Aiming to compare the results achieved with the parameters obtained by the methodology, the choice of operating parameters was previously carried out through the trial and error methodology [11]. Method similar to that presented by the ASME standard for detecting surface notches [10]. Subsequently, the frequency optimization procedure was carried out, Fig. 2(a), varying from 20 kHz to 700 kHz in 10 kHz steps. Finally, the optimization of rotation and vertical gain for the selected frequency, Figs 2(b). The parameters obtained by both procedures are shown in Table 1.
Optimization of parameters for notch inspection in clad steel.
Comparison of operating parameters
In possession of the parameters, a scan of the entire specimen was performed in both configurations and a C-scan graphs of the impedance amplitude was made. Where the color bar represents the amplitude of the signal at the X and Y position on the sample. As can be seen in Fig. 3, Despite the amplitude reduction throughout the inspection, the result obtained by the proposed procedure only shows the detection of the notch with a good signal-to-noise ratio Fig. 3(b) while the other shows the overlap of this signal with the weld signal Fig. 3(a).
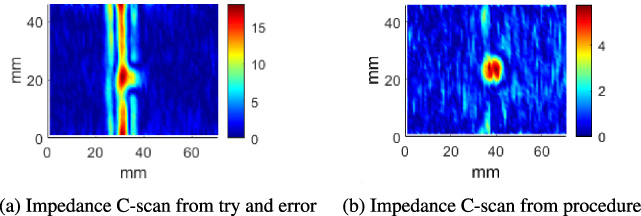
Comparison between the results obtained through the try and error methodology and those obtained through optimization.
However, the objective of the analysis is to enable the detection of fatigue cracking under such conditions. Therefore, using a specimen containing the defect in question and using the optimized parameters, a scan of the entire surface of the sample was performed. In Fig. 4 we can see that the parameters obtained through a sample with an EDM notch could be used for an inspection of a real case. Allowing clear detection of the defect despite it being close to a weld root.
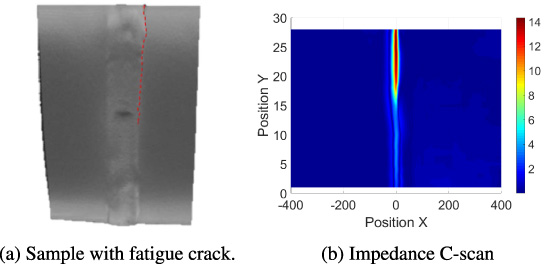
Inspection of a fatigue crack in clad steel simulating real inspection conditions encountered by autonomous tools.
Although the standards present methodologies and recommendations on how inspections should be performed and how data should be displayed on the equipment screen, these are very specific for the type of test to be performed. However, many of these standards only inform how the data must be presented without a defined procedure for defining the operating parameters. Added to this, the development of new materials and applications brings with it the need to carry out inspections in order to guarantee quality and safety. Therefore, due to the innovative and challenging character of such technologies, they also do not have a defined way to obtain the parameters.
Therefore, the present work proposed the development of a methodology for defining the operating parameters. This took as a principle the fact that the parameters can be divided into two distinct groups, physical and post-processing parameters. In this way, the frequency optimization was carried out first through successive inspections. Although this step seems costly due to the need to carry out inspections for each analyzed frequency, aiming at the construction of the analysis graph, there is the possibility of simplification. For example, performing inspections with larger frequency steps and, after identifying the region of maximum amplitude, refining the analysis in smaller frequency steps in the region or using multi-frequency inspections to obtain a group of amplitude values in each inspection.
The optimization capacity of the fatigue crack detection signal in clad steels was studied, comparing the result with those obtained by the parameter determination methodology through the visual analysis of the signal on the equipment screen (try and error). The achieved results show that the procedure allowed the detection of only the notch. Applying the parameters obtained in a inspection of a real fatigue crack, it was observed that the detection of the defect was similar to that obtained in the specimen with an EDM notch.
Therefore, the procedure proved to be effective for obtaining the operating parameters. This being applicable not only for the presented tests, but to differentiate any two signs of interest.
Footnotes
Acknowledgements
The authors express their gratitude to PETROBRAS and COPPETEC.