
Abstract
Nondestructive testing (NDT) for damage in thermal barrier coatings (TBCs) is significant for the safety guarantee of gas turbine blades. As a new NDT technology, electromagnetic acoustic transducer (EMAT) is widely applied for NDT of conductive structural components due to its advantages of coupling-free and high adaptability. In this paper, numerical simulations are conducted to study the wave propagation and interaction with delamination defects in TBCs inspected with a Rayleigh wave EMAT of the Lorentz force mechanism. Based on the numerical results, the wave structure in TBC, wave conversion at delamination defect, time domain EMAT signals, and its B-scan images are evaluated and the feasibility of Rayleigh wave EMAT to inspect delamination in TBCs was theoretically clarified.
Introduction
Thermal barrier coatings (TBCs) is widely used in protection of the gas turbine blades from damage due to high working temperatures. TBCs is usually composed of ceramic top coating (TC) and bond coating (BC) which are usually fabricated on the superalloy substrate through the plasma spray technique. Delamination may occur at the interface of BC and TC and has a significant influence on the performance of TBCs and the integrity of the gas turbine blades [1]. Some nondestructive testing (NDT) techniques are employed to inspect the delamination defect in TBCs [2–4]. These methods, however, are either low efficiency or lack detectability of small defects under practical TBCs surface conditions. The Rayleigh wave in ultrasonic testing (UT) method has the advantage of detecting surface and subsurface defects since most of its wave energy is within one-wavelength depth under the top surface of the specimen. Electromagnetic acoustic transducer (EMAT) is a non-contacting NDT technique that can directly excite ultrasonic wave in a conductive substrate and the BC of TBCs system and therefore can avoid influences of surface condition. With proper configuration, EMAT can generate a Rayleigh wave capable of propagating a long distance along the surface of the structure, and therefore, enables high-efficiency near-surface defect inspection. Recently, studies on NDT of Rayleigh wave are mainly on the concrete structure [5,6] and structures of the CFRP material [7], while little study dealing with the inspection of delamination in TBCs using the Rayleigh wave UT has been reported up to now.
In this paper, an EMAT numerical simulation model for delamination inspection of thermal barrier coatings using a Rayleigh wave EMAT is established. The wave structure in TBCs under different excitation frequencies, wave mode conversion around the defect, features of the time domain signal, and B-scan images are numerically calculated and discussed. Numerical results reveal that the Rayleigh Wave EMAT is feasible for NDT of delamination defects in TBCs even for a defect as small as 1 mm in size.
Simulation method of Rayleigh wave EMAT for TBCs structure
To investigate the propagation of Rayleigh wave in TBCs, numerical simulations of ultrasonic wave field were carried out using a numerical code developed by authors [8]. As shown in Fig. 1, a numerical simulation model consisting of transducers and a simplified TBCs structure was established and discretized with space domain FEM and time domain difference scenario. In practice, a Rayleigh wave EMAT consisting of two parts was considered, i.e., (i) a permanent magnet to provide bias magnetic field
To investigate the propagation features of Rayleigh wave in a TBCs system, ultrasonic vibration in the TBCs model shown in Fig. 1 is considered using our EMAT simulation code. To cope with specimens of different thicknesses, the excitation frequency f for EMAT is set as different values between 0.5 MHz to 2.5 MHz. As the wavelength 𝜆 of the Rayleigh wave depends on the wave velocity and frequency as shown in Eq. (2), a proper interval of the meander coil segments s has to be selected carefully as the half of the wavelength (see Eq. (3)) to generate a Rayleigh wave in the top coating of TBCs with a relatively large amplitude.
In the numerical model illustrated in Fig. 1, the TBCs system is modeled as a 3-layered plate of 200 mm length along the wave propagation direction and of infinite length in the other direction, i.e., a 2-dimensional model is adopted to simulate the Rayleigh wave EMAT approximately. As the meander coil is of a large length, this approximation is reasonable. The thickness of the substrate layer simulating the blade body is set to be 30 mm of relatively larger value than the wavelengths of the Rayleigh wave in the interested excitation frequency range. A large substrate thickness is selected to make the influence of reflected bulk waves from the bottom of the substrate negligible when the frequency is large. The thicknesses of the bonding coating and top coating are set as 100 μm and 300 μm respectively referring to the typical cases of TBCs system used in heavy-duty gas turbine blades. As for the FEM mesh division, 8 node cuboid elements of 0.1 mm size in substrate plate length direction, 0.02 mm and 0.1 mm for TC+BC region and the substrate region respectively in the coating thickness direction are adopted. On the other hand, the thickness of delamination is selected as 20 μm, i.e., one-layer elements in TBCs are set of air material in both the simulation of eddy current and ultrasonic wave propagation. The length d of the delamination defect along the wave direction (x direction in Fig. 1) is set between 1 mm and 20 mm in simulation to check the detectability of the surface wave EMAT for delamination defect in TBCs. The material properties of TC, BC, and blade substrate used are set as those shown in Table 1 referring to practical materials.

Simulation model of TBCs and EMAT.
Material properties of the TBCs system used in simulation modeling
With the use of the numerical model described above and our FEM-based numerical code for EMAT simulation, the bias magnetic field, transient eddy current, and ultrasonic wave field at different time instants can be calculated numerically. As for the receiving signal of the EMAT pickup unit, it is obtained from the vibration wave field and the bias magnetic field based on the principle of motion-induced eddy current and its secondary magnetic flux in the pickup unit. In practice, the motion-induced eddy current in the TBCs system is calculated from the ultrasonic vibration and the simulated pickup bias-magnetic field based on the formulation of the motion-induced electric field and the Ohms law. The magnetic motive force of the pickup coil due to the secondary magnetic field of motion-induced eddy current can be then calculated based the Biot-Savart’s law and the Faraday induction law.
Because of the mechanism of EMAT, its receiving unit can only pick up the signal due to the vibration of the conductive substrate in the bias-magnetic field. Therefore, the A-scan (time domain) signal of the Rayleigh wave EMAT is taken as the vibration of the nodes at the upper surface of the substrate in numerical simulation. To compare with signals received by using a piezoelectric UT transducer (PZT), the vibration of the nodes at the surface of the top coating is calculated as the A-scan pickup signal of PZT.
To study the influence of the coatings on the structure of the Rayleigh wave, the EMAT signals for specimen plate of only substrate material, i.e., without coatings, and signals for specimen of full TBCs system are calculated respectively. Figure 2 shows the out-of-plane (OP) vibration velocity distribution of the wave at t = 15 μs. As shown in Fig. 2(a), the Rayleigh wave energy is mainly concentrated in one wavelength skin region for the substrate-only case. For the multi-layered TBCs specimen, however, most of the Rayleigh wave energy is concentrated in the top coating layer as shown in Fig. 2(b) due to the relatively low density of the BC and the ceramic TC layers.
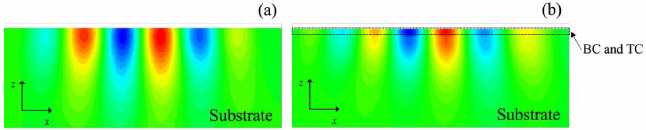
OP velocity contour of Rayleigh wave at time t = 15 μs for the model of (a) substrate only; (b) TBCs system.
Figure 3(a–d) show the wave structure of the simulated Rayleigh wave under different excitation frequencies, i.e., distribution along the thickness direction of the Rayleigh wave velocity. Figure 3(a) and (c) show the in-plane (IP) and OP velocity of the substrate-only model, and Fig. 3(b) and (d) show the results of the full TBCs model. One can find from the figures that the wave structure in the TBCs specimen is very different from that of the substrate-only specimen. Figure 3(e) gives the dependence of the signal amplitudes on the excitation frequency for the IP and OP signals of the two models respectively. When the excitation frequency is under 1.5 MHz, the IP velocity amplitude in TBCs is slightly higher than that of the substrate-only case, while the OP velocity amplitude in TBCs is slightly lower. On the other hand, the OP velocity amplitude of the TBCs model is much smaller than those of the no-coating model when the frequency is larger than 1.5 MHz, indicating that a drastic reduction of wave energy in the substrate region may occur. This means a high-frequency EMAT is not suitable for TBCs inspection.
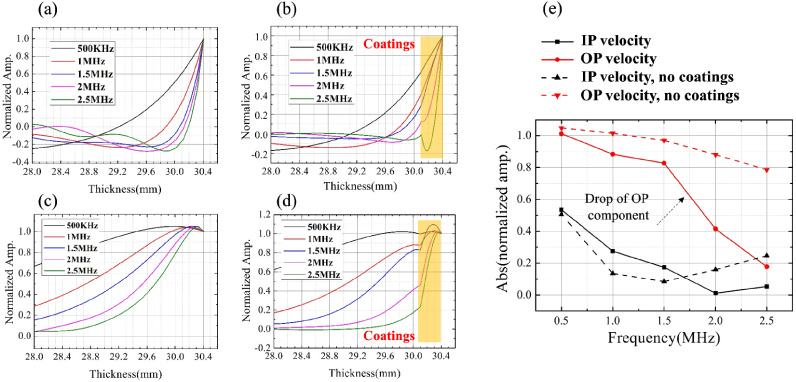
The wave structure of Rayleigh wave and amplitude of Rayleigh wave under different excitation frequencies: (a) IP velocity distribution in the single-layered substrate; (b) IP velocity distribution in TBCs; (c) OP velocity distribution in the single-layered substrate; (d) OP velocity distribution in TBCs; (e) the velocity amplitude of Rayleigh wave at the upper surface of the substrate.
Next, the dispersion property of the Rayleigh wave in multi-layered TBCs structure is studied. Figure 4(a) shows a theoretical result of the dispersion curve of the Rayleigh wave in TBCs obtained using the global matrix method [9]. The phase velocity decreases nonlinearly with the increasing excitation frequency. In the case of 300 μm top coating thickness and 1 MHz excitation frequency, the phase velocity is 2600 m/s in TBCs according to the solid line of Fig. 4(a), while the velocity of the Rayleigh wave in the substrate-only model is 2800 m/s and without significant change with the excitation frequency.
Figure 4(b) and (c) show the B-scan (t − x) image of OP ultrasonic vibration at the top surface of TC of 1 MHz and 2 MHz excitation frequency respectively. Compared with the results of 1 MHz, the wave image of the 2 MHz frequency has obvious distortion in the wave packet, which indicates a severe dispersion of the Rayleigh wave. Therefore, from the viewpoint of low dispersion and better signal imaging, a relatively low excitation frequency, such as 1 MHz, is preferred for the TBCs inspection.

Typical results of (a) theoretical dispersion curve of Rayleigh wave in TBCs, (b) B-scan wave image under 1 MHz and (c) 2 MHz excitation frequency.
The mode conversion of the Rayleigh wave at the delamination defect is studied by observing the calculated wave field results before, when, and after the Rayleigh wave propagates through the delamination defect. Ultrasonic wave fields at some typical time instants are shown in Fig. 5. When Rayleigh wave (R) propagates and encounters the delamination defect, part of the incident wave is transmitted as Lamb wave (S0 and A0 mode) at the leading edge of the delamination and then travels in the TC of the TBCs. The phase velocity of the S0 mode is slightly faster than that of the A0 mode. The rest part of the Rayleigh wave (R ′ ) will travel in the BC and substrate under the delamination defect. Since the mechanical properties of BC are very near to those of the substrate and its thickness is small, BC was regarded as part of the substrate in the full TBCs model. The phase velocity of the R ′ wave is faster than the A0 mode and slower than the S0 mode in the TC. From Fig. 5, one can find that part of the Lamb wave in the TC and the Rayleigh wave (R ′ ) is reflected at the trailing edge of the delamination defect, while the rest of the Lamb wave and Rayleigh wave (R ′ ) combine again after the delamination defect and travel in the TBCs system then as Rayleigh wave.
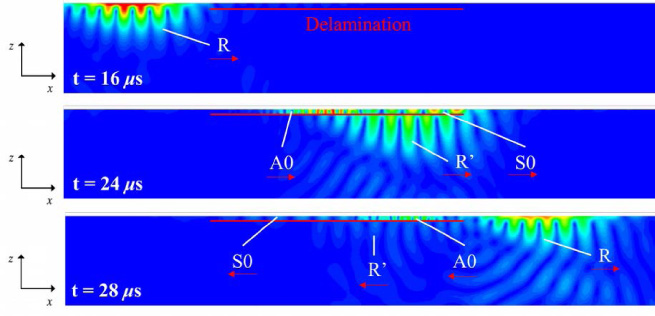
Rayleigh wave velocity contour at different time instants.
Figure 6(a) and (b) show the B-scan image of the Rayleigh wave received by using a PZT (the vibration at the top surface of the substrate) and an EMAT pickup coil (vibration signal at the TC top surface) respectively. The difference between the signals of these two kinds of receiving sensors is mainly the mode conversion at delamination defect. Since the PZT sensor measures the ultrasonic wave at the top surface of TC, the propagation and reflection of both the S0 and A0 mode wave in the top coating at the delamination defect can be observed in the B-scan image. On the other hand, as the EMAT pickup sensor receives the ultrasonic wave signal in the conductive substrate, one can see that the conversion of the Rayleigh wave from R to R ′ and the reflection of R ′ occurred at delamination in Fig. 6(b). The phase velocity is also different when the Rayleigh wave propagates in TBCs from that in the substrate (Fig. 4(a)). The velocities of Rayleigh wave in TBCs and substrate-only plate correspond to the slope of wave packets in the B-scan images shown in Fig. 6. The phase velocity v calculated from Fig. 6 is about 2601 m/s in TC and 2839 m/s in the substrate, which are consistent with the theoretical results shown in Fig. 4(a). From the results of mode conversion and phase velocity, it can be found that there is a good possibility to detect the delamination defect also with the phase velocity information of the Rayleigh wave.
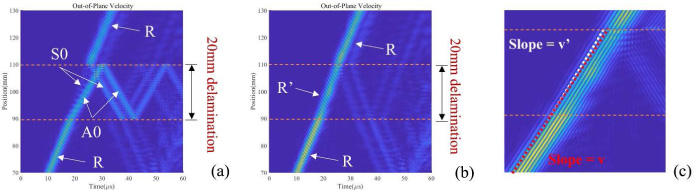
B-scan (t − x) image of Rayleigh wave propagating: (a) on the upper surface of top coating; (b) on the upper surface of the substrate; (c) calculation of the Rayleigh wave phase velocity from the B-scan image.
To further study the mode conversion of the Rayleigh wave, time domain signals have been extracted at three different positions as shown in Fig. 7. Figure 8(a) and (b) show the A-scan signals received by the EMAT pickup unit. The A-scan signals of the PZT sensor are similar to the Rayleigh wave in different depths and should have identical wave patterns. In Fig. 8(a), the reflected Rayleigh wave from the trailing edge of the delamination defect can be recognized. The first and the second echo are those of the S0 and A0 mode reflection respectively. An obvious signal attenuation due to the defect can be found in Fig. 8(b). This is because that part of the Rayleigh wave is reflected by the defect in the form of S0 and A0 waves in TC and the Rayleigh wave in the substrate. The Rayleigh wave arrivals early at a position after the defect, e.g., x = 120 mm, because (i) the Rayleigh wave in substrate travels faster than that in TBCs and (ii) the S0 mode Lamb wave in TC travels faster than the Rayleigh wave in TBCs system. At the trailing edge of delamination, Rayleigh wave (R ′ ) in the substrate and S0 mode in TC joints together again and its waveform shows an early arrival feature. Figure 8(c) and (d) show the time domain signal received by the PZT and EMAT pickup sensor at the position of the delamination respectively. The S0 and A0 mode Lamb wave can be observed in Fig. 8(c) at time instants of t = 21 μs and t = 24 μs. From the Rayleigh wave arrived at t = 22 μs of no defect case as shown in Fig. 8(d), one can see that the amplitude of the Rayleigh wave decreased significantly compared with the wave in intact TBCs due to the wave reflection. In addition, the arrival time is slightly ahead in the case of delamination defect because of the difference in the phase velocities of the Rayleigh wave in TBCs and substrate. The extent of arrival time shifting also depends on the delamination size.

Pick-up positions of the time domain signals: before, after, and at the delamination (P1, P2, P3).

Time domain signal at different positions: (a) at P1; (b) at P2; (c) at P3 received by PZT; (d) at P3 received by EMAT.
Figure 9 gives the numerical results when the size of delamination is 1 mm. Because the delamination defect size is smaller than the wavelength of the Lamb wave and Rayleigh wave at 1 MHz in this case, the mode conversion at delamination in the B-scan image is not clear. However, the defect still can be identified from the reflection signals of the Lamb wave in Fig. 9(c). Compared with Fig. 8(a), the reflected Rayleigh wave shows only one wave packet instead of two. This is because the small traveling distance in TC at delamination defect is not able to separate the waves of the S0 and A0 modes. Figure 9(d) shows that clear amplitude attenuation can be observed but the arrival time shift is not significant for the case of 1 mm delamination defect because of the small traveling distance in the defect.

Simulation results on the TBCs with delamination of 1 mm size: (a) B-scan image on the upper surface of top coating; (b) B-scan image on the upper surface of the substrate; (c) time domain signal at P1 and (d) time domain signal at P3 received by EMAT.
In this paper, simulation models and numerical analyses of Rayleigh wave EMAT for inspecting delamination in TBCs were conducted to clarify the detection mechanism of the Rayleigh wave EMAT for delamination defects in TBCs. Numerical simulation results reveal that the wave energy in the substrate is significantly reduced by the ceramic TC, i.e., the energy is concentrated in the non-conductive TC layer for a high excitation frequency. It is also found that the excitation frequency has a significant influence on the structure and propagation features of the Rayleigh wave in TBCs. Rayleigh wave in multi-layered TBCs structure is more dispersive, and a lower excitation frequency such as 1 MHz gives a better EMAT signal reception. On the other hand, the delamination defect can perturb the Rayleigh wave propagation and even cause mode conversion. As the major detection mechanism, the delamination defect can be identified from the signal changes due to the reflection, attenuation, and arrival time shifting in the measured Rayleigh wave signals. It is found that a defect as small as 1 mm in size can be detected by using the Rayleigh wave EMAT from the numerical results.
EMAT is a coupling-free and contactless method, in practical situations, the signals received by EMAT would not be easily affected by the rough surface condition of the top coating and EMAT also allows high-speed scanning that will improve the inspection efficiency. Although receiving signals by PZT will bring higher SNR, the dependency on the coupling agent may cause unstable signals during the scanning process. In the future, the EMAT will be further studied in TBCs delamination inspections experimentally.
Footnotes
Acknowledgements
The authors would like to thank the National Natural Science Foundation (No. 11927801), National Major Science and Technology Project (2019-VII-0007-0147) for funding.