
Abstract
Measure of temperature dynamics in induction sealing processes is of paramount importance for the validation of physics-based models. In this work, commonly used commercial tools for temperature measurements, such as thermocouples, pyrometers and thermal cameras, are benchmarked for the characterization of the temperature dynamics occurring in multilayer aluminum foil-based packaging material undergoing relatively fast (i.e., ×100 ms) induction heating transients.
Introduction
Aseptic Packaging Material (PM) is made of a multilayer structure including paperboard (mostly), thin polymer layers and a 6 μm-thick aluminum foil, see Fig. 1(a).
For the sealing of such PM, indirect Induction Heating (IH) is one of the suitable technologies [1]. By means of indirect IH eddy currents are induced on the aluminum foil; the heat generated by Joule effect is thus transferred by conduction to the adjacent polymer layers; when the polymer temperature overcomes the melting point, the layers are pressed together and cooled, and a sealing can occur. A pictorial sketch of an Induction Sealing (IS) system integrated on a tube-filled Filling Machine (FM) is represented Fig. 1(b), where the PM is formed into a cylindrical-like shape and is heated up by an inductor (an aluminum coil) placed closed to the PM area to be sealed. Thanks to the high-power density achievable by IH, modern tube-filled FMs working at a frequency of about 500 kHz can perform sealings with heating time as low as of few hundreds of ms. In the cases presented in this work, the generator is connected to the load through a matching network given by a step-down transformer with a parallel capacitance at its input port. In the framework of FM engineering, physics-based models for the sealing process are under development to further improve and optimize the machine sealing systems. Despite one of the first proposals of exploiting IS (also known as “induction welding”) in the packaging technology dates back to the ‘70s [2], to the Authors best knowledges, extensive scientific literature on IS still lacks. Probably, the first description of the electromagnetics of IS applied to tube-filled FM can be found in ref. [1]. General textbooks on IH technology are also available in literature [3,4].
To this purpose, an in-depth knowledge of the physical properties of the materials integrated in the PM is paramount. In particular, while the electromagnetic properties of the materials used both in the inductors and in the PM are typically well known, the thermal parameters (e.g., thermal conductivity, specific heat, density) of the polymers and the of board require a more complex physical description, and a comprehensive characterization is not always achievable. Therefore, to validate the material heat transfer properties, it is fundamental to perform accurate measurements of the actual temperature reached by the PM during the fast-heating transients. A detailed and thorough discussion of the state of the art of the currently available tools in the broad field of temperature measurements is out-of-the-scope of this paper; nevertheless, a brief and schematic overview on the subject, as well as references to informative literature on this topic, are provided in the next.
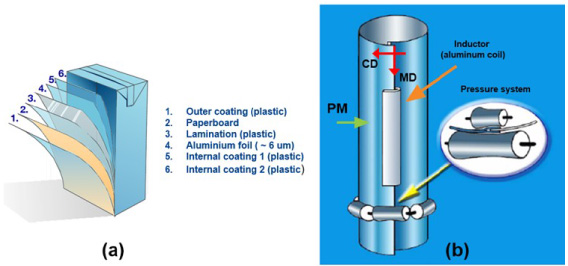
(a) Structure of a paperboard-based aseptic packaging material (PM); (b) Tube-shaped PM formed in the Filling Machine; an inductor (made of an aluminum coil) heats up the material only where sealing should be performed; a pressure application system is also present (CD: Cross Direction, MD: Machine Direction).
A comprehensive and very structured textbook reporting the diverse principles and technologies for temperature measurements, in a wide applications range, is referenced in [5]. In addition, a review on the techniques especially devoted to measure temperature in induction heating applications is presented in [6]. The discussion in [6], considered by the authors of particular interest for the application in-hand, is very roughly summarized in the following. Most common tools for temperature measurement applied in induction heating applications include:
Advantage: inexpensive. Disadvantages: color evaluation, if done by a human, is of course subjective; the indicator must adhere to the hot very part during the whole process; limited accuracy.
Advantages: inexpensive; easy to use; very thin wire (i.e., diameters in range of ∼10 micrometers are possible) can have a relatively small thermal inertia (i.e, small response time). Disadvantages: noise can be induced by the induction field; must stay in contact with the hot part, and wires must be connected from the object to a reader; response time, even for thin wire junctions, might not be small enough for certain application, as in the case reported in this paper.
Advantages: non-contact; when IR response of the object fits the sensor wavelength it can be very precise; low-response time. Disadvantages: sensor-object wavelength must match for good sensitivity; the emitting object must be “seen” by the sensor and must completely fill the “Field Of View” (FOV) of the thermometer to avoid detecting interfering signals; difficult to measure very low 𝜀 (e.g., polished surface metals); can suffer from spurious readout of environmental reflections.
Advantages: no need of line of sight between object and lens Disadvantages: complex installation, expensive
Advantages: provide a temperature “distribution”; can measured virtually all kind of materials (sensor is broadband in IR spectrum and 𝜀 can be tuned based on the target object). Advantages: modern camera based on photodiode with response time in the nanosecond range are very expensive since they require an integrated cooling system; for reliable measurement, 𝜀 of the target object must be known; same considerations as for pyrometers regarding FOV, environmental reflections, and difficulties to measure very low 𝜀.
As we shall see in the following, photodiode-based thermographic cameras featuring response time in the microsecond range are likely the most powerful tool to characterize of fast induction heating transients. A recent review on infrared thermography is also reported in ref. [9]. This work will be focused only on measurements performed, while future works could be made to show how these measurements compare with physics-based modeling.
Induction heating rig
FMs are complex automation systems which perform several operations, like package forming, sterilization, filling, and sealing. Accurate temperature measurements carried out directly on FM sealing systems, where mechanical constraints pose severe requirements on the test setup, are challenging: several noise factors can adversely affect the reliability of the tests. For this reason, a simpler laboratory rig that mimic only the heating function of the sealing system of the FM is devised. The test rig is a relatively simple induction heating system, which consists of a generator, a matching network and a load (i.e., an aluminum coil coupled to the aluminum foil of the PM), in analogy to the equipments installed on the FM. The output of the generator is a single-tone sine wave, with an amplitude such as the current that flows in the load is in the order of ∼100 A. The load, which cross-section in CD is represented in Fig. 2, is made of a simple one-turn coil, appropriately shaped to melt only a limited portion of the PM placed, at 1 mm from the top surface of the active area.
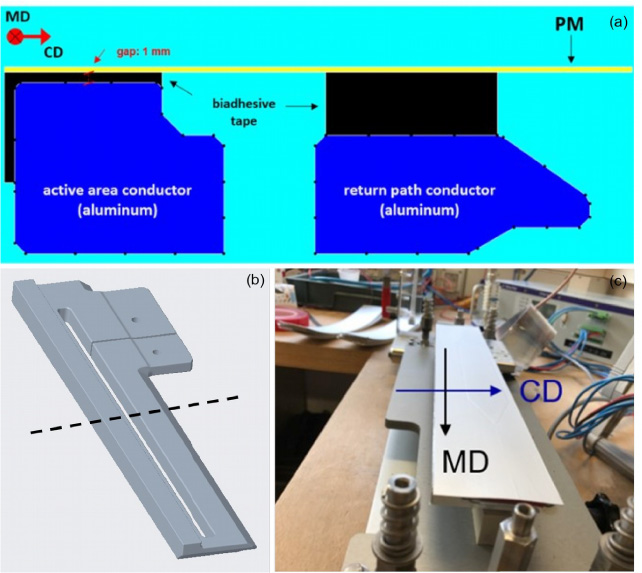
(a) 2-D cross-section (CD) of the test setup load. The coil active area conductor is closer (1 mm distance) to the PM, and differently shaped, with respect to the return path conductor, in order to achieve melting only on a specific portion of PM nearby the active area. PM is hold onto the coil upper surfaces by the means of a biadhesive tape. (b) CAD file of such inductor: the dashed line in CD indicates where the section (a) where taken. (c) Experimental setup with the inductor and the packaging material above, fixed with biadhesive tape.
During pulse, the delivered rms power is kept constant thanks to the generator feedback system which modulates the frequency (typically varied by few kHz around the nominal value) such that the impedance seen by the generator output terminals is always almost purely resistive, since the load is inductive and the matching network has capacitors to reduce the phase as close as possible to zero. The adjustment of the frequency to follow the system resonance compensates for the increment of the electrical resistivity of the heated-up aluminum foil during excitations. No pressure system is present in the test rig: the sample is just heated up by induction and then naturally cools down. Thermographic tools are thus placed above the PM, with thermal cameras at 20 cm and pyrometers at 1 cm, measuring the temperature of the upper surface of the PM inside layer (indicated as “internal coating 2” in Fig. 1), made of LDPE (Low-Density Polyethylene). The full setup is boxed to reduce the impact of the environmental light reflections on the temperature readout, as visible in Fig. 3. Measurements are carried out in consecutive days to have room temperature, around 20 °C, and relative humidity, around 50%.
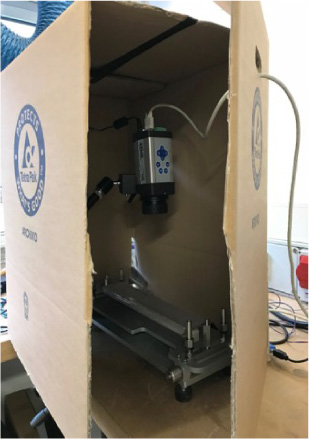
IR signals-based measurements were made inside a box, to avoid external radiation noise and reflection.
The tools for temperature measurements benchmarked in this work are thermographic cameras, pyrometers and thermocouples selected knowing that the expected maximum temperature is around 150 °C. Two families of cameras are investigated: cooled and uncooled. The former is based on photodiodes exploiting the photoelectric effect: incident photons of infrared (IR) wavelengths can promote electrons from valence to conduction band; the photodiode acts then as a photodetector in the IR band. These cameras have a very low response time and a high image quality but are expensive and fragile, due to the integrated cooling system. The cooled camera used in this work is the FLIR X6900sc, which high-quality sensor is a complex semiconductor structure made of a repetitive matrix including InSb and another semiconductor compound chosen to tailor the IR band of the sensor. Structure of this kind are generally referred to as Strained-Layer Superlattice (SLS) photodetectors. The second family, called uncooled or microbolometric, integrates, as temperature sensor, a so-called microbolometer, i.e., a simple resistor made of a material which electrical resistance shows high sensitivity to IR radiation. Microbolometers are cheaper but have higher response time and lower frame rate. The response time, as defined in the product specs, is the time needed for the sensor to reach, starting from room temperature, a steady-state readout of the temperature of the object under test, which is assumed constant during the sensing operation, see Fig. 4.
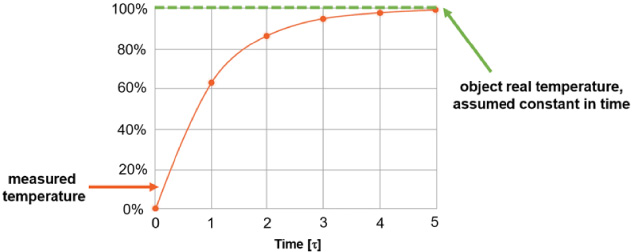
Definition of thermographic tool response time 5𝜏 (typical RC-system response).
The response time parameter is very important, since it sets limits on how fast the temperature of the object under test can change and still be correctly recorded by the sensor. Obviously, if a temperature transient has characteristic time (i.e., the time interval in which a significant change of the temperature occurs) lower than the response time, the temperature read by the instrumentation will be systematically underestimated.
The microbolometric cameras used in this work are the FLIR A20 M and the FLIR A655sc; the A655sc is a more recent model compared to A20M featuring better resolution. For both, the microbolometer is made of Vanadium Oxide (VOX).
Besides, the employed pyrometers are the Optris CT P3, which due to his operating wavelength of 3.43 μm is well suited for temperature measurements of thin plastic films like LDPE, and the Micro-Epsilon CT Fast (operating in the standard 8–14 μm wavelength range), which features a shorter response time of 6 ms. Finally, the K-type (nickel-chromium/nickel-alumel) thermocouple used is an Omega CO-2, chosen for its small wire and junction dimensions of 13 μm, which should prevent any interference with the IH system. The investigated tools are listed, and their main characteristics summarized, in Table 1. It is worth noticing the huge difference in response time -more than 1000×- between the cooled and uncooled camera technologies, with the cooled cameras featuring response time as low as 1 μs.
Benchmarked thermographic tools
For IR measurements a key parameter is the emissivity (𝜀) of the sample under study: it is the parameter that the camera software needs as input to translates the IR signal into a temperature readout. Emissivity describes how much IR radiation can be absorbed or emitted by an object or a surface. It can be expressed as the ratio of the radiant energy W (𝜆) emitted by an object at a temperature T and the radiant energy emitted by a blackbody W
bb
(𝜆) – Planck’s law – at the same temperature, and at the same wavelength 𝜆, that is:
Emissivity is typically considered as the property of a material surface (e.g., it depends on surface roughness), and the interaction with IR radiation for opaque materials typically occurs within some tens of micrometers from the surface. In order to characterize the emissivity of the inside surface of the PM, a dedicated experiment is devised: a sheet of PM is half-covered with a black painting of known emissivity, 𝜀 = 0.95 and is heated-up using an oven, as schematized in Fig. 5. Then, by keeping the temperature of the PM surface constant and monitored by means of a thermocouple, the emissivity of the inside layer is found as the one for which the temperature read by the thermal camera on the black coated and the uncoated material is the same. The extracted parameter is 𝜀 = 0.32 ± 0.02, which is in good agreement with literature [10]. In the tests described in the following, in order to remove the uncertainty related to the LDPE 𝜀, the PM samples characterized are black painted. However, this is not obviously the case for the real FM applications; the above calibration is thus useful to correctly setup the FM models for which heat exchange by radiation on the PM surface must be computed.
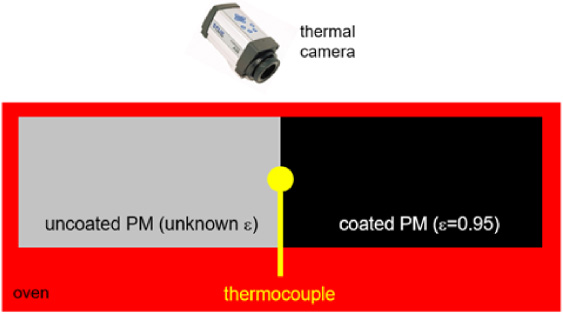
Scheme of test with half-coated (black paint) PM sheets to calibrated LDPE emissivity.
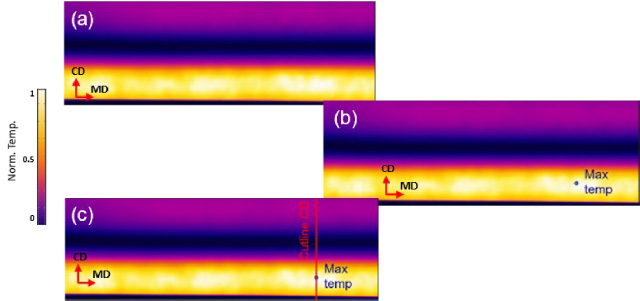
(a) Camera thermal image at the instant corresponding to the IH pulse-end; (b) the maximum temperature value TMAX is identified and (c) a cutline on CD containing TMAX is drawn.
PM samples are cut in a 33 × 6 cm shape and are coated with black paint. Temperature readouts during IH excitations are therefore carried out for two different combination of heating times and powers, i.e., (i) 300 ms–1100 W, and (ii) 600 ms–800 W, averaged out among several PM samples to quantify the variability.
Comparison among thermographic cameras
To compare the temperature recorded with the three thermal cameras, the approach used is the one described in the following (see also Fig. 6): At the time instant corresponding to the IH pulse-end, a cutline in CD is identified such that it contains the maximum temperature value on the whole camera recording window; The maximum temperature (TMAX) on the chosen cutline is then recorded for each time frame; To cope with statistical variability, TMAX is then averaged among different samples; Since the system is not synchronized with a trigger, all the curves are manually aligned in order to have the heating phase starting at the same time.
Comparison between thermographic cameras and pyrometers
To compare thermographic cameras and pyrometers it is important to consider that pyrometers do not measure temperature “pointwise” but that their readout is a result of an average on a circular area (having ∼7 mm of diameter for the pyrometers used this work, see Table 1). Moreover, since all PM samples are measured only once, and are affected by significant spatial variability of their characteristics, the data recorded by the pyrometers are affected by the location set. That is, it might happen that the pyrometer is placed on a global maximum, or on a minimum in the recording window, such that the measure will not be a fair representation of the temperature fingerprint of the whole PM. Therefore, 5 areas of the same dimension of the pyrometer’s spot are identified in the camera measurement window (see Fig. 7), then the temperature is averaged both intra-sample and inter-sample (TAVG). In total, three averages are done: (1) inside the single spot; (2) among the five spots of a PM sheet; (3) among several PM sheets.
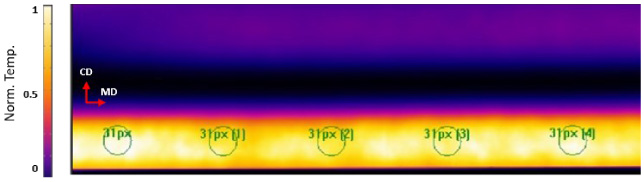
In the thermal image, five spots with diameter equal to the pyrometer’s spot size are identified. Then the mean temperature in each spot is averaged among the five spots (TAVG). Furthermore, another average is performed among different samples.
Comparison among thermographic cameras
For both power-time settings, TMAX vs. time is reported in Fig. 8. In the IH phase, as expected, TMAX rises almost linearly, while the non-linearity is mainly due to the latent heat of fusion of the LDPE, which melting point occurs around 105–110 °C. Then, TMAX drops in the cooldown phase. It can be clearly seen how the temperature profiles show a very similar shape and behavior among all cameras; however, different TMAX values are reached, with the cooled camera showing the highest temperature. With a difference on the peak TMAX of more than 10%, corresponding to ∼20 °C (∼10 °C) for the longer (shorter) pulse, it is clear that cooled camera (X6900sc) record higher temperatures with respect to the bolometric A20M, and the same holds with respect to the more recent bolometric A655sc as well, even though the difference in the TMAX peak is somehow lower in the latter case, i.e., about 10 °C for the longer pulse. It is worth noticing that that temperature differences in this range are not negligible for the induction sealing applications in-hand, since they can lead to a significant error in the estimation of the sealed areas.
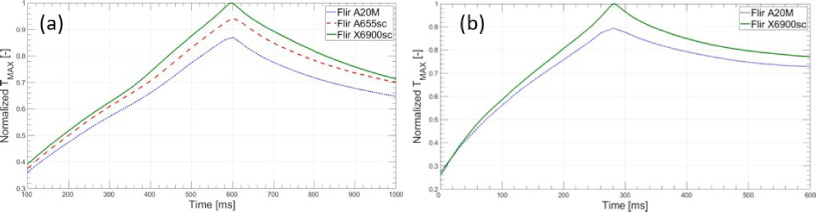
TMAX readout for the thermal cameras: (a) pulse of 600 ms at 800 W, (b) pulse of 300 ms at 1100 W. A20M shows temperature peaks lower than ∼10% compared to X6900.

Comparison of TAVG between pyrometers, thermocouple and thermal cameras (a) pulse of 600 ms at 800 W, (b) pulse of 300 ms at 1100 W. X6900sc shows again the highest temperature.
We believe that the temperature mismatch between cooled and uncooled technology is explained by the huge difference in the response time, which for the cooled camera is more than 1000 times smaller, as discussed before. On the other hand, we assume that the difference between the more recent A655sc and the old A20M, since both camera mount microbolometers, is to be ascribed to the better resolution of the A655sc, which higher number of pixels for a same IR window can lead to “less averaged” recorded values, i.e., higher maxima.
In Fig. 9, a comparison between cameras and pyrometers is provided, following the guidelines explained before, i.e., referring to TAVG. As expected, the cooled camera provides the highest TAVG as well. A20M is better than both pyrometers for the faster transient, while pyrometer CT P3 shows better result for the slower pulse. It can be noticed that CT P3 measures a higher TAVG for both pulse settings compared to CT Fast. This is not coherent with the response time hierarchy, since CT Fast features a lower response time. However, since CT P3 is specifically designed to work at the 𝜆 corresponding to the higher peak of LDPE IR absorption, its better sensitivity might play a role as well, despite the measures are done on PM painted with black matte (which average thickness, investigated with SEM microscopy, is ∼20 μm, about 10 μm lower than the inside layer thickness). Thermocouple instead shows a smoother curve shape for the slower setting and a temporal shift at higher times for the faster one. A possible reason for this remarkable mismatch between thermocouple and the other tools could be the slow data-logging capability of the commercial data logger used for the read out of the thermocouple signal (i.e., the data logger equipped with the thermocouple signal analyser Yokogawa DL850E). Therefore, due to the shown superior performance, from now on, this work is focused on the thermographic cameras results only. To summarize, Table 2 indicates the TAVG for the curves displayed in Fig. 9 at the heating peak (i.e., at the end of IH pulse).
Normalized comparison of measured TAVG at end of IH-pulses
Normalized comparison of measured TAVG at end of IH-pulses
To conclude, we also investigate the variability among the different samples, Fig. 10 reports the averaged TMAX along with its associated error bars, where the error 𝜎 is calculated as
In general, a remarkable sample-to-sample variability in the temperature evolution exists for all cameras. Nevertheless, a trend towards increasing temperature for smaller response time is clearly visible.
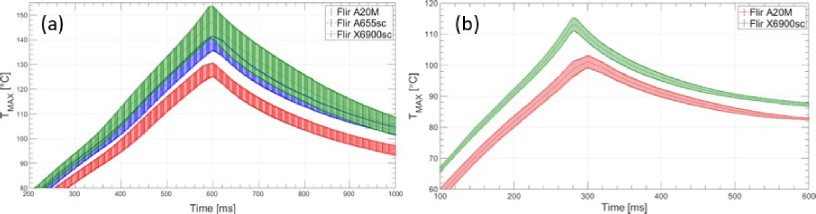
Comparison between thermal cameras taking in consideration the statistical variations: (a) pulse of 600 ms at 800 W, (b) pulse of 300 ms at 1100 W;
Remarkably, by measuring the temperature dynamics of uncoated samples with the X6900sc camera it is also possible to detect PM wrinkles and track their time evolution. Figure 11 shows a comparison between a temperature readout with the A20M and the X6900sc: a wrinkle is clearly visible in the X6900sc readout, but it cannot be detected with the bolometric camera. Wrinkles, which occurs due to a buckling phenomenon that may take place when an air gap is present in the PM structure such that a higher temperature in correspondence to the wrinkle is measured, can have a width of few tenths of mm and a length of several mm. Wrinkles can be an indicator or a precursor for sealing defects hence the ability to detect them could be fundamental for sealing process evaluation.
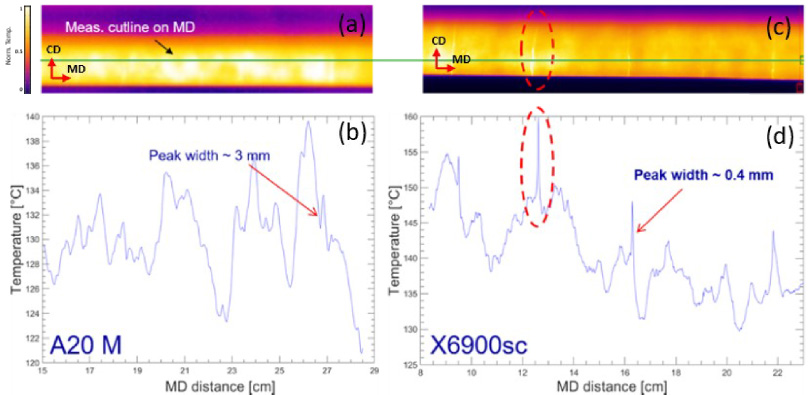
Temperature maps (a) and (c), and MD cutline profiles (b) and (d) acquired with A20M and X6900sc, respectively. In the A20 readout no wrinkles are visible but by visual checking of the sample it is possible to find one of them in correspondence of the highlighted peak Instead, in the X6900sc output wrinkles are clearly visible both in the image and in the cutline plot.
For the investigation of fast (×100 ms) heating transients, camera equipped with photodetectors are more suitable than conventional bolometric due to the reduced response time (i.e., few μs vs. 50–100 ms); with cooled cameras it is also possible to detect wrinkle formation occurring in the packaging material. Nevertheless, the response time is not the only parameter that plays a role in thermographic measurements: pyrometers with operating wavelength calibrated on the LDPE material IR peak (3.43 μm) show more accurate measurements than faster pyrometers working in the standard IR spectrum (8–14 μm).
Footnotes
Acknowledgements
The authors would like to thank F. Messa of TELEDYNE-FLIR for fruitful discussions and comments.