
Abstract
BACKGROUND:
The strawberry is one of the most intensively grown fruits worldwide but faces challenges by several severe diseases, such as powdery mildew (PM) caused by Podosphaera aphanis.
OBJECTIVE:
To understand the disease response process and identify critical defense-related genes which may be utilized for improving disease resistance in the strawberry.
METHODS:
We analyzed differentially expressed genes (DEGs) of the RNA-seq data1 of two F. vesca accessions, Hawaii 4 (HW) and Yellow Wonder 5AF7 (YW), infected by PM and analyzed the differentially expressed genes (DEGs).
RESULTS:
There were 2310 and 1681 DEGs identified in HW and YW, respectively. The less-susceptible HW and the susceptible YW shared 1342 DEGs. More DEGs and higher expression levels of those DEGs were detected in HW than in YW. The DEGs contained 935 and 728 different domains in HW and YW, respectively, and many high-frequency domains were associated with response to abiotic/biotic stimuli. The DEGs have 16 expression profiles in each accession, and four profiles were significantly enriched in the “Plant-pathogen interaction” pathway, having the same degree of confidence in the co-expression network in each accession.
CONCLUSIONS:
These findings provide insight into the global response to a challenging disease, powdery mildew, and contribute to the understanding of PM resistance which will facilitate the molecular breeding of strawberries.
Keywords
Introduction
Strawberry is an important, intensively managed crop worldwide. This fruit constantly faces a series of diseases during its growth and development, such as powdery mildew (Podosphaera aphanis), gray mould (Botrytis cinerea), anthracnose (Colletotrichum spp.), red stele (Phytophthora fragariae), and phytophthora crown rot (Phytophthora catorum) [1–4]. In recent years, powdery mildew has become the most common fungal disease of the strawberry, and specially in protected production facilities, it is becoming a more and more serious issue, as it affects the yield, quality and economic values of strawberries [4, 5].
Plants evolve two defense mechanisms in their immune system to fight disease infections. Pattern recognition receptors (PRRs) recognize the pathogen-associated molecular patterns (PAMPs), such as bacterial flagellin or fungal chitin, which induce the PAMP-triggered immunity (PTI) [6]. Intracellular receptors recognize the pathogen virulence effectors, which induce the effector-triggered immunity (ETI) [6]. The latter one, ETI, often results in hypersensitive response (HR) by using plant resistance proteins encoded by disease resistance genes (R genes), such as NBS-LRR genes, which is the largest class of plant R genes [6, 7]. The former, PTI, is commonly referred to as non-host resistance induced by non-adapted pathogens, while ETI is generally effective against adapted pathogens [7]. As for PTI, the corresponding PRRs must be present in plants. For example, the rice disease-resistant gene, Xa21, and the Arabidopsis receptors, FLS2 and EFR, encode LRR-kinases and are involved in PAMP-mediated signaling of defense responses [8]. Compared to PTI, the R-gene-mediated ETI leads to similar but qualitatively stronger and faster responses, in which the regulations of gene expression are mainly mediated by transcription factors, such as WKRY, Myb, and bZIP [9–11]. Furthermore, it was widely known that both PTI and ETI involved in a series of cellular events, such as activating the mitogen-activated protein kinase (MAPK) signaling pathway and reprogramming the gene expression, which indicates that plant defense is composed by numerous complex processes [6].
The genes involved in response to pathogen defense have been identified in various plants based on diverse molecular and genetic approaches. Next-generation RNA sequencing (RNA-seq), exploring both coding and non-coding RNAs, has been widely used to detect the differential gene expressions in plants after infection with pathogens, like C. gloeosporioides in the cultivated strawberry [12], soybean infected with bacterial leaf pustule [13], peach invaded by Xanthomonas arboricola pv. pruni [14] and wide rice (Oryza meyeriana) against X. oryzae pv. oryzae (Xoo) [15]. According to these RNA-seq data, especially among the different species/ecotypes/cultivars, the differentially expressed genes (DEGs) can be easily identified. Moreover, the Kyoto Encyclopedia of Genes and Genomes (KEGG) enrichments and expression profiles can be employed to further narrow down the candidate genes for detailed characterizations. For instance, plant-pathogen interaction pathway is important for strawberry in response to C. gloeosporioides [12], and phytohormone signaling and phenylpropanoid biosynthesis pathways were enriched in O. meyeriana after Xoo infection [15].
The raw RNA-seq data of two F. vesca accessions, Hawaii 4 (HW) and Yellow Wonder 5AF7 (YW), after powdery mildew infection, have been recently released by Jambagi and Dunwell [16]. This provides an excellent opportunity to gain insights into the global response of the woodland strawberry to powdery mildew infection. In this study, we identified the DEGs of these two accessions, and conducted a series of analyses of the structural domains, gene ontology (GO), KEGG enrichment, and time sequence profiles of the DEGs. Meanwhile, co-expression networks identified the significantly enriched pathway of “Plant-pathogen interaction” in both accessions. These results uncovered the characteristics of DEGs, including the domain preference, the KEGG enrichment tendency and the expression pattern classification of the defense-related genes under different genetic backgrounds, which has not reported previously by Jambagi and Dunwell. These results could further our understanding of the defense processes in the strawberry and help screen candidate defense-related genes for disease-resistance breeding of the strawberry in future studies.
Materials and methods
Identification of differentially expressed genes
The F. vesca genome sequences and annotations were downloaded as the reference genome from the Genome Database for Rosaceae (GDR) (https://www.rosaceae.org/species/fragaria/fragaria_vesca/genome_v1.1). The raw RNA-seq data of two F. vesca accessions, Hawaii 4 (HW) and Yellow Wonder 5AF7 (YW), were downloaded from the European Nucleotide Archive (ENA) (https://www.ebi.ac.uk/ena/data/view/PRJEB4896), including six samples, HW and YW both at 0, 1, and 8 day after infection (dai). The data were filtered using the Q30 threshold of the FASTQ_Quality_Filter tool, and the filtered reads were mapped to the reference genome by using TopHat [17]. The alignment reads of each gene were counted by HTSeq-count, and the expression levels were calculated as the normalized FPKM values (Fragments per Kilobase of transcript per Million mapped fragments). Subsequently, the DEGs were identified by using edgeR package with the thresholds of |logFC|≥2 and FDR≤0.01 (FDR, false discovery rate).
Analysis of differentially expressed genes
All DEGs identified in this study were examined for structural domains using the Pfam database (http://pfam.xfam.org/) with an E-value of 1.0, GO analysis based on the F. vesca annotations, and KEGG enrichment by using Database for Annotation, Visualization and Integrated Discovery (DAVID) v6.8 (https://david.ncifcrf.gov/).
Expression profile of differentially expressed genes
The time sequence profile analysis of the DEGs was processed by Short Time-series Expression Miner (STEM) [18], in which genes were significantly divided into different profiles based on significant results (P < 0.01).
Construction of the co-expression networks
The genes with the most significant profiles involved in “Plant-pathogen interaction” pathway were selected for construction of co-expression networks in HW and YW, respectively. Pearson correlation coefficient (PCC) values were calculated between these genes, and PCC≥0.85 was used as the cutoff threshold of network edges. The co-expression networks were constructed and visualized by Cytoscape software.
Results
Functional preference of differentially expressed genes
There were 943, 1839, and 529 DEGs found in 0 vs. 1 dai, 0 vs. 8 dai, and 1 vs. 8 dai in HW, respectively. In YW, these respective DEGs were 651, 1396, and 402. Therefore, a total of 2310 and 1681 DEGs were detected in HW and YW after infection with powdery mildew, respectively. Among these DEGs, 1342 genes (50.7%) were differentially expressed in both accessions, while 968 (36.5%) were detected in HW and 339 (12.8%) were detected in YW (Fig. 1). For the shared 1342 DEGs between the two accessions, HW had a higher average FPKM value (40.43) than YW (29.78) across all three time points. Moreover, 818, 835, and 982 DEGs showed higher expression levels in HW than in YW at 0 dai, 1 dai, and 8 dai, respectively (Table S1).

The differentially expressed genes (DEGs) in Hawaii 4 (HW) and Yellow Wonder 5AF7 (YW) after infection by powdery mildew.
To reveal the potential functions of the DEGs, their protein domains were examined by using Pfam searches. There were a total of 5405 and 3883 domains in the two accessions, in which 935 and 728 different domains were found in HW- and YW-DEGs, respectively. The accession-specific protein domains were quite low in frequency. For example, 308 different domains occurred only in HW and 101 kinds of them only belonged to YW (Table S2). However, across the shared 626 different domains, some were high-frequency domains (Fig. 2). The prominent protein domains were PPR, LRR, Pkinase, WD40, p450, WRKY and NB-ARC in the up-regulated DEGs in both accessions, and all are important in response to environmental stimuli or biotic stresses. Other highly occurring domains were Ank, GST_N and zf-RING, which are conserved and widespread for growth and development in various organisms.
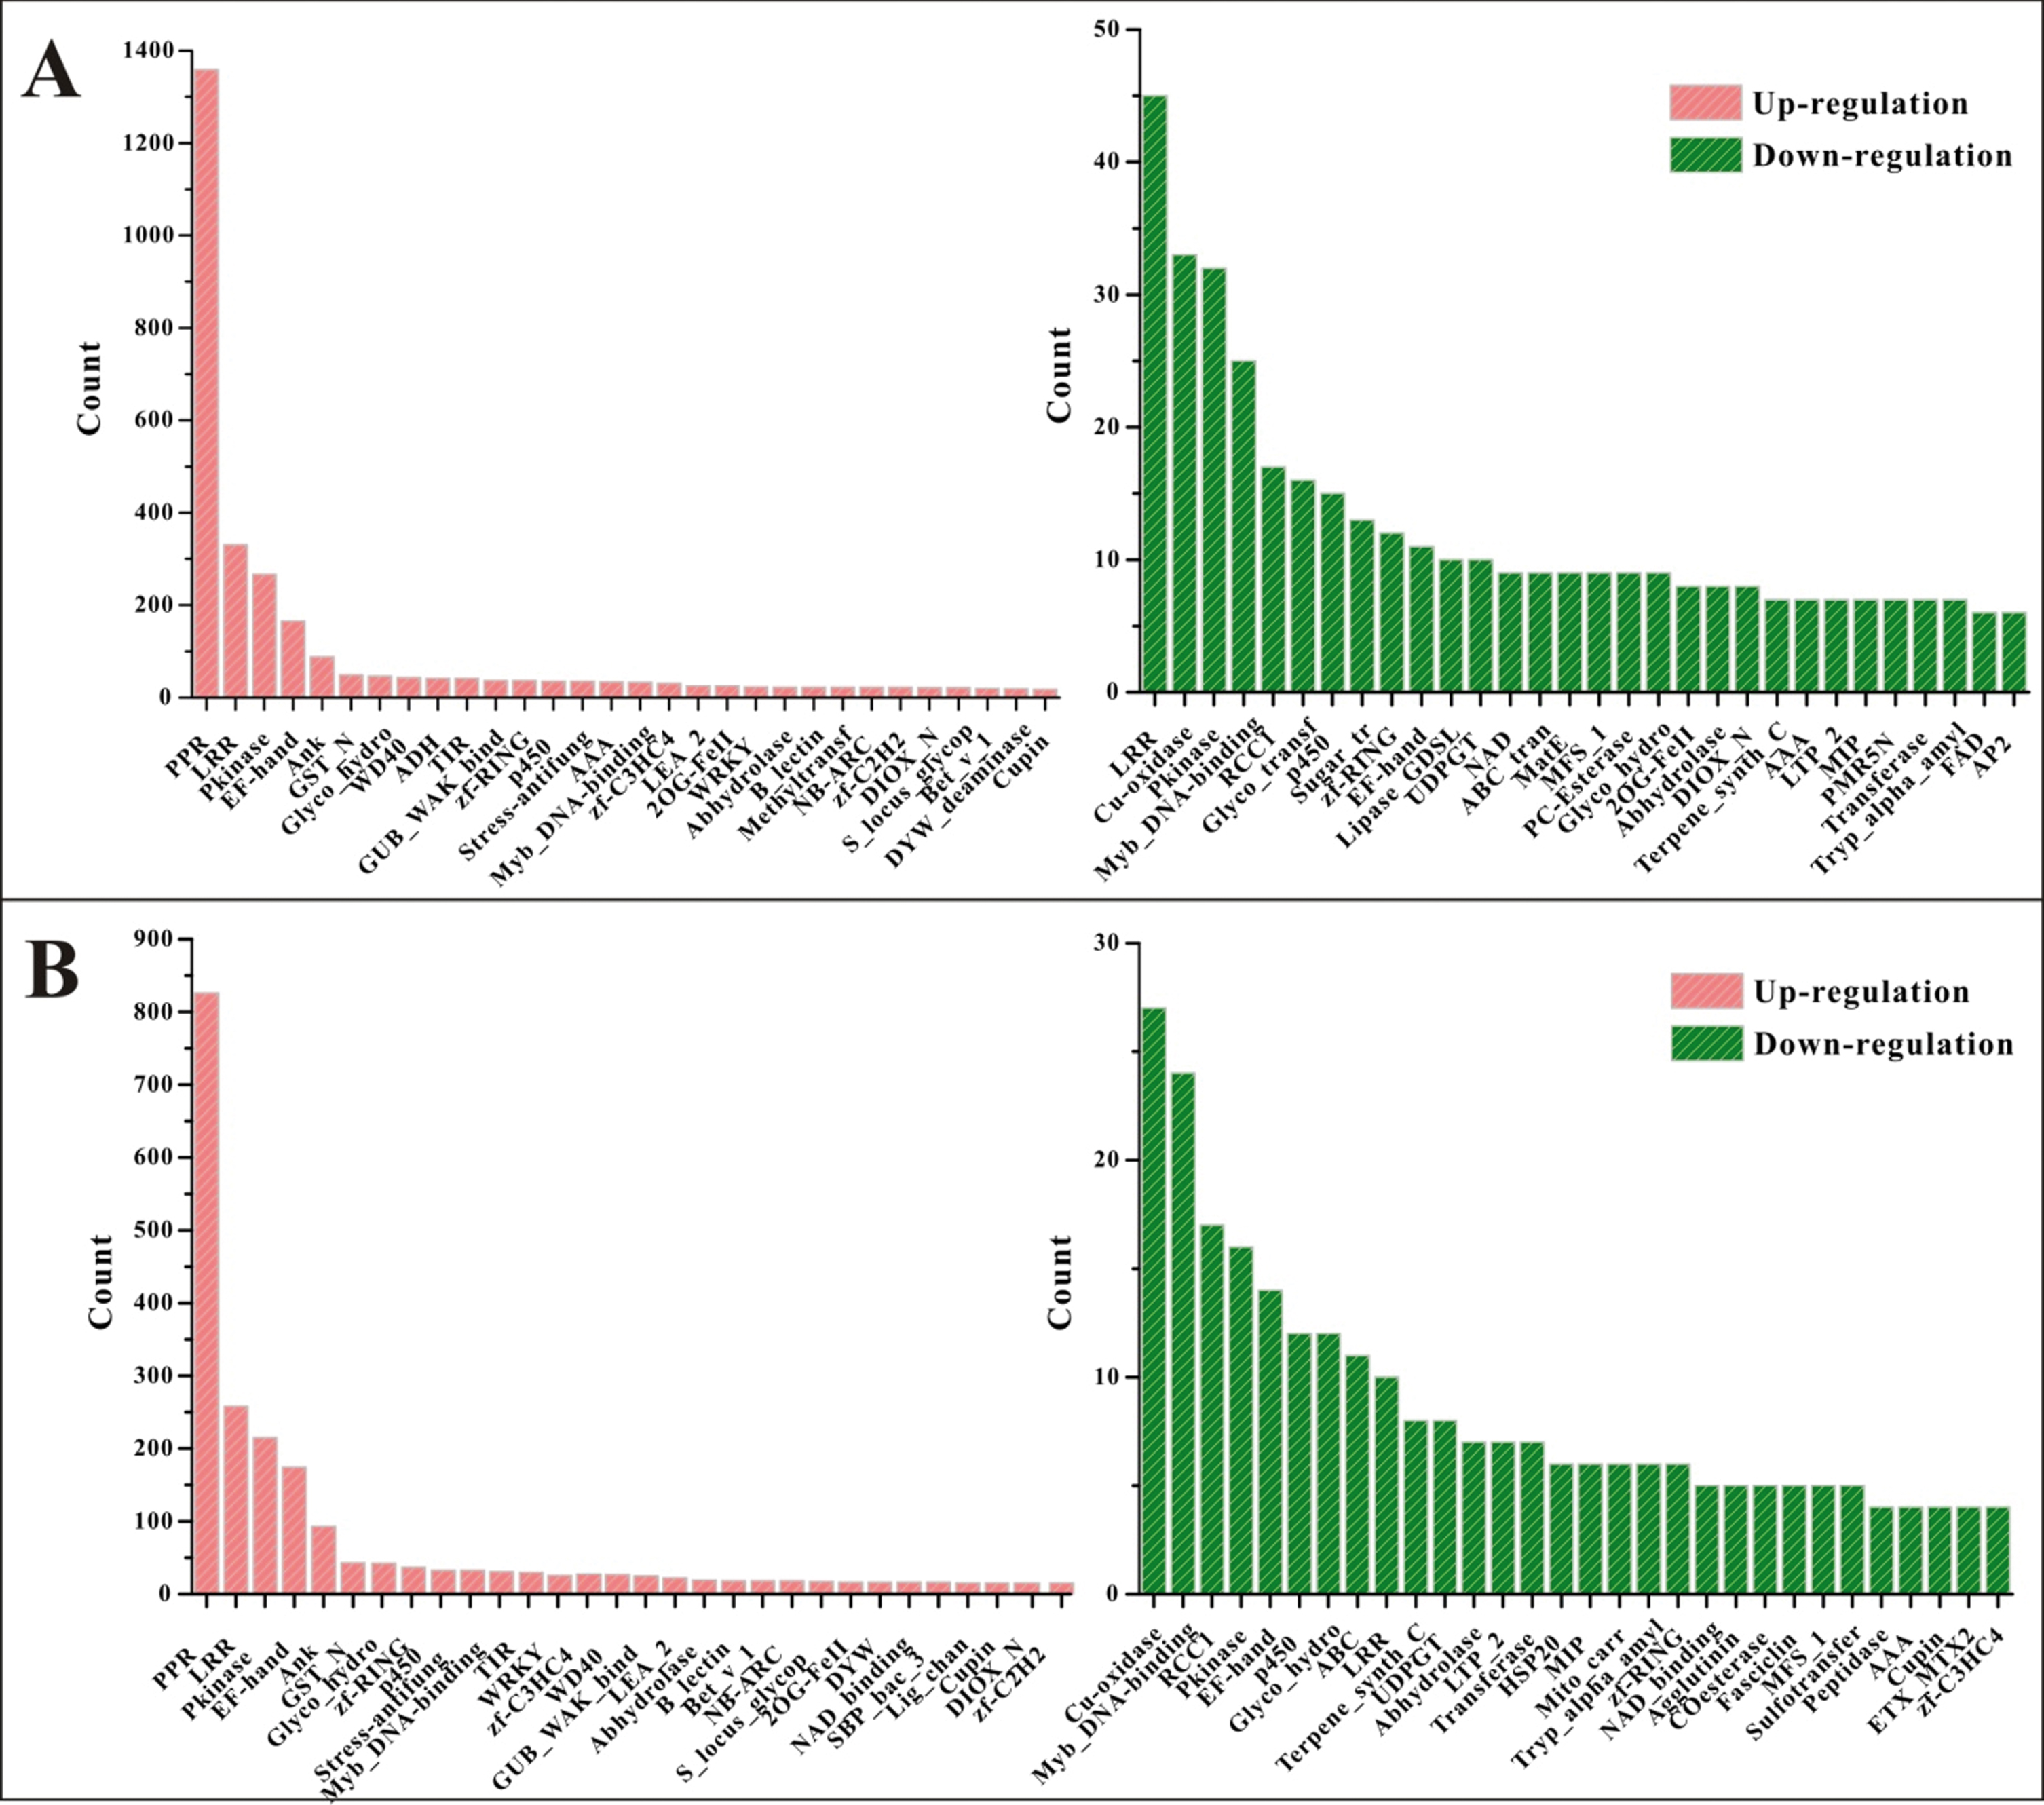
The top 30 protein domains of the DEGs in HW (A) and YW (B). The x-axis represents the number of different domains and the y-axis means the count of the genes encoding the associated protein domain.
The GO analysis revealed a preferential distribution of the DEGs in the two accessions in the three categories, biological process, cellular component and molecular function (Fig. 3). For the biological process, both HW and YW had most genes in the two sub-categories, “metabolic process” and “protein amino acid phosphorylation”. The DEGs are also concentrated in some categories of stress response processes, including “innate immune response”, “defense response” and “response to biotic stimulus”, which occurred quite early in 0 dai vs. 1 dai from the two accessions in the analysis of Jambagi and Dunwell, such as “response to stress” and “defense response” in HW and “response to abiotic stimulus” in YW [16]. Likewise, HW and YW also shared parallel category clustering in the cellular component and molecular function (Fig. 3). HW and YW both had DEGs mostly in the cellular component (“intracellular”, “membrane”, “nucleus”, and “integral to membrane”) and molecular function (“ATP binding”, “protein binding”, “catalytic activity” and “protein kinase activity”). In the category of molecular function, the top four aforementioned sub-categories accompany with “protein serine/threonine kinase activity” and “nucleotide binding”, showed the molecular response of plants to ecological stresses or pathogens.
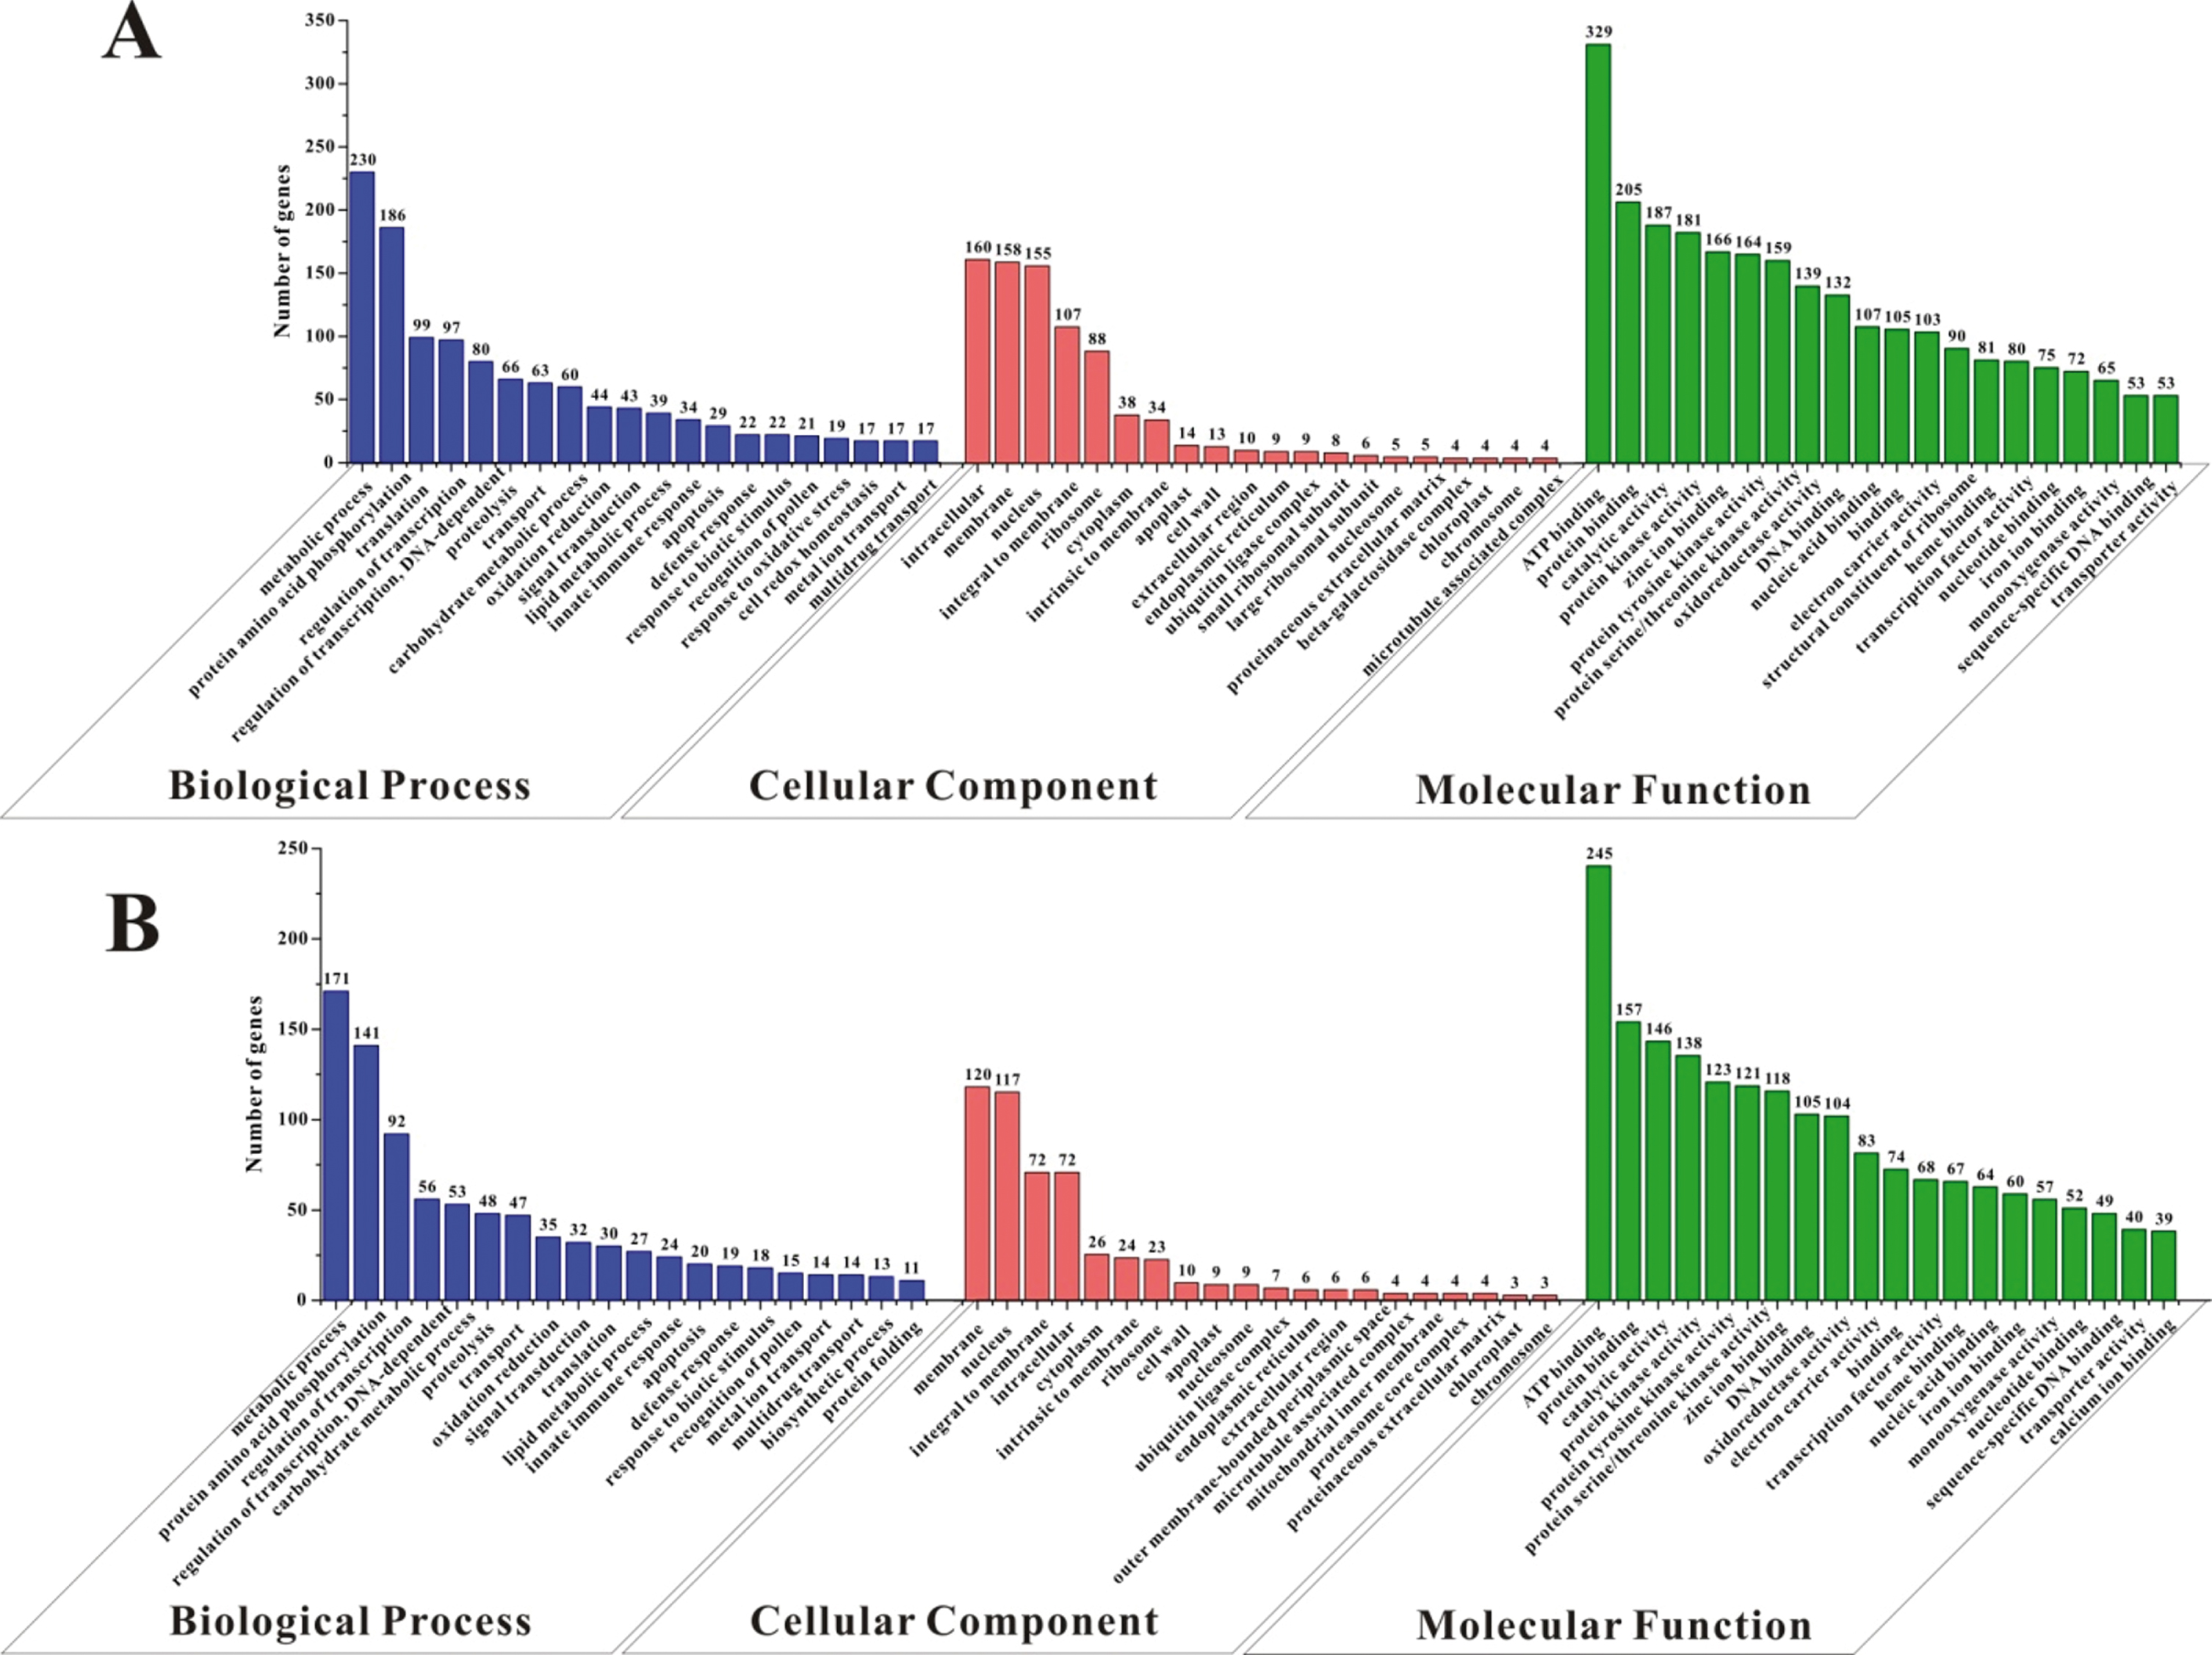
The gene ontology (GO) of the DEGs in HW (A) and YW (B). The number above the column means the gene number involved in the corresponding sub-category of GO analysis.
The DEGs in both HW and YW infected with PM pathogen were enriched in some KEGG pathways according to DAVID website (P < 0.05). The HW DEGs were enriched in eight KEGG pathways (Fig. 4A). The largest number of genes (105) was found in the “Biosynthesis of secondary metabolites” (5.29%). Additionally, the “Sesquiterpenoid and triterpenoid biosynthesis” pathway had eight genes (0.40%) and “Cyanoamino acid metabolism” pathway had ten genes (0.50%). The “Ribosome” (53 genes; 2.67%) and “Ribosome biogenesis in eukaryotes” (24 genes; 1.21%) had highest confidence levels of P < 0.0001, and the “Phenylpropanoid biosynthesis” (31 genes; 1.56%) and “Plant-pathogen interaction” (27 genes; 1.36%) had high degree of confidence with P < 0.001. Among the eight pathways, the “Cyanoamino acid metabolism”, “Ribosome” and “Ribosome biogenesis in eukaryotes” pathways were specific to HW and were not found in YW.
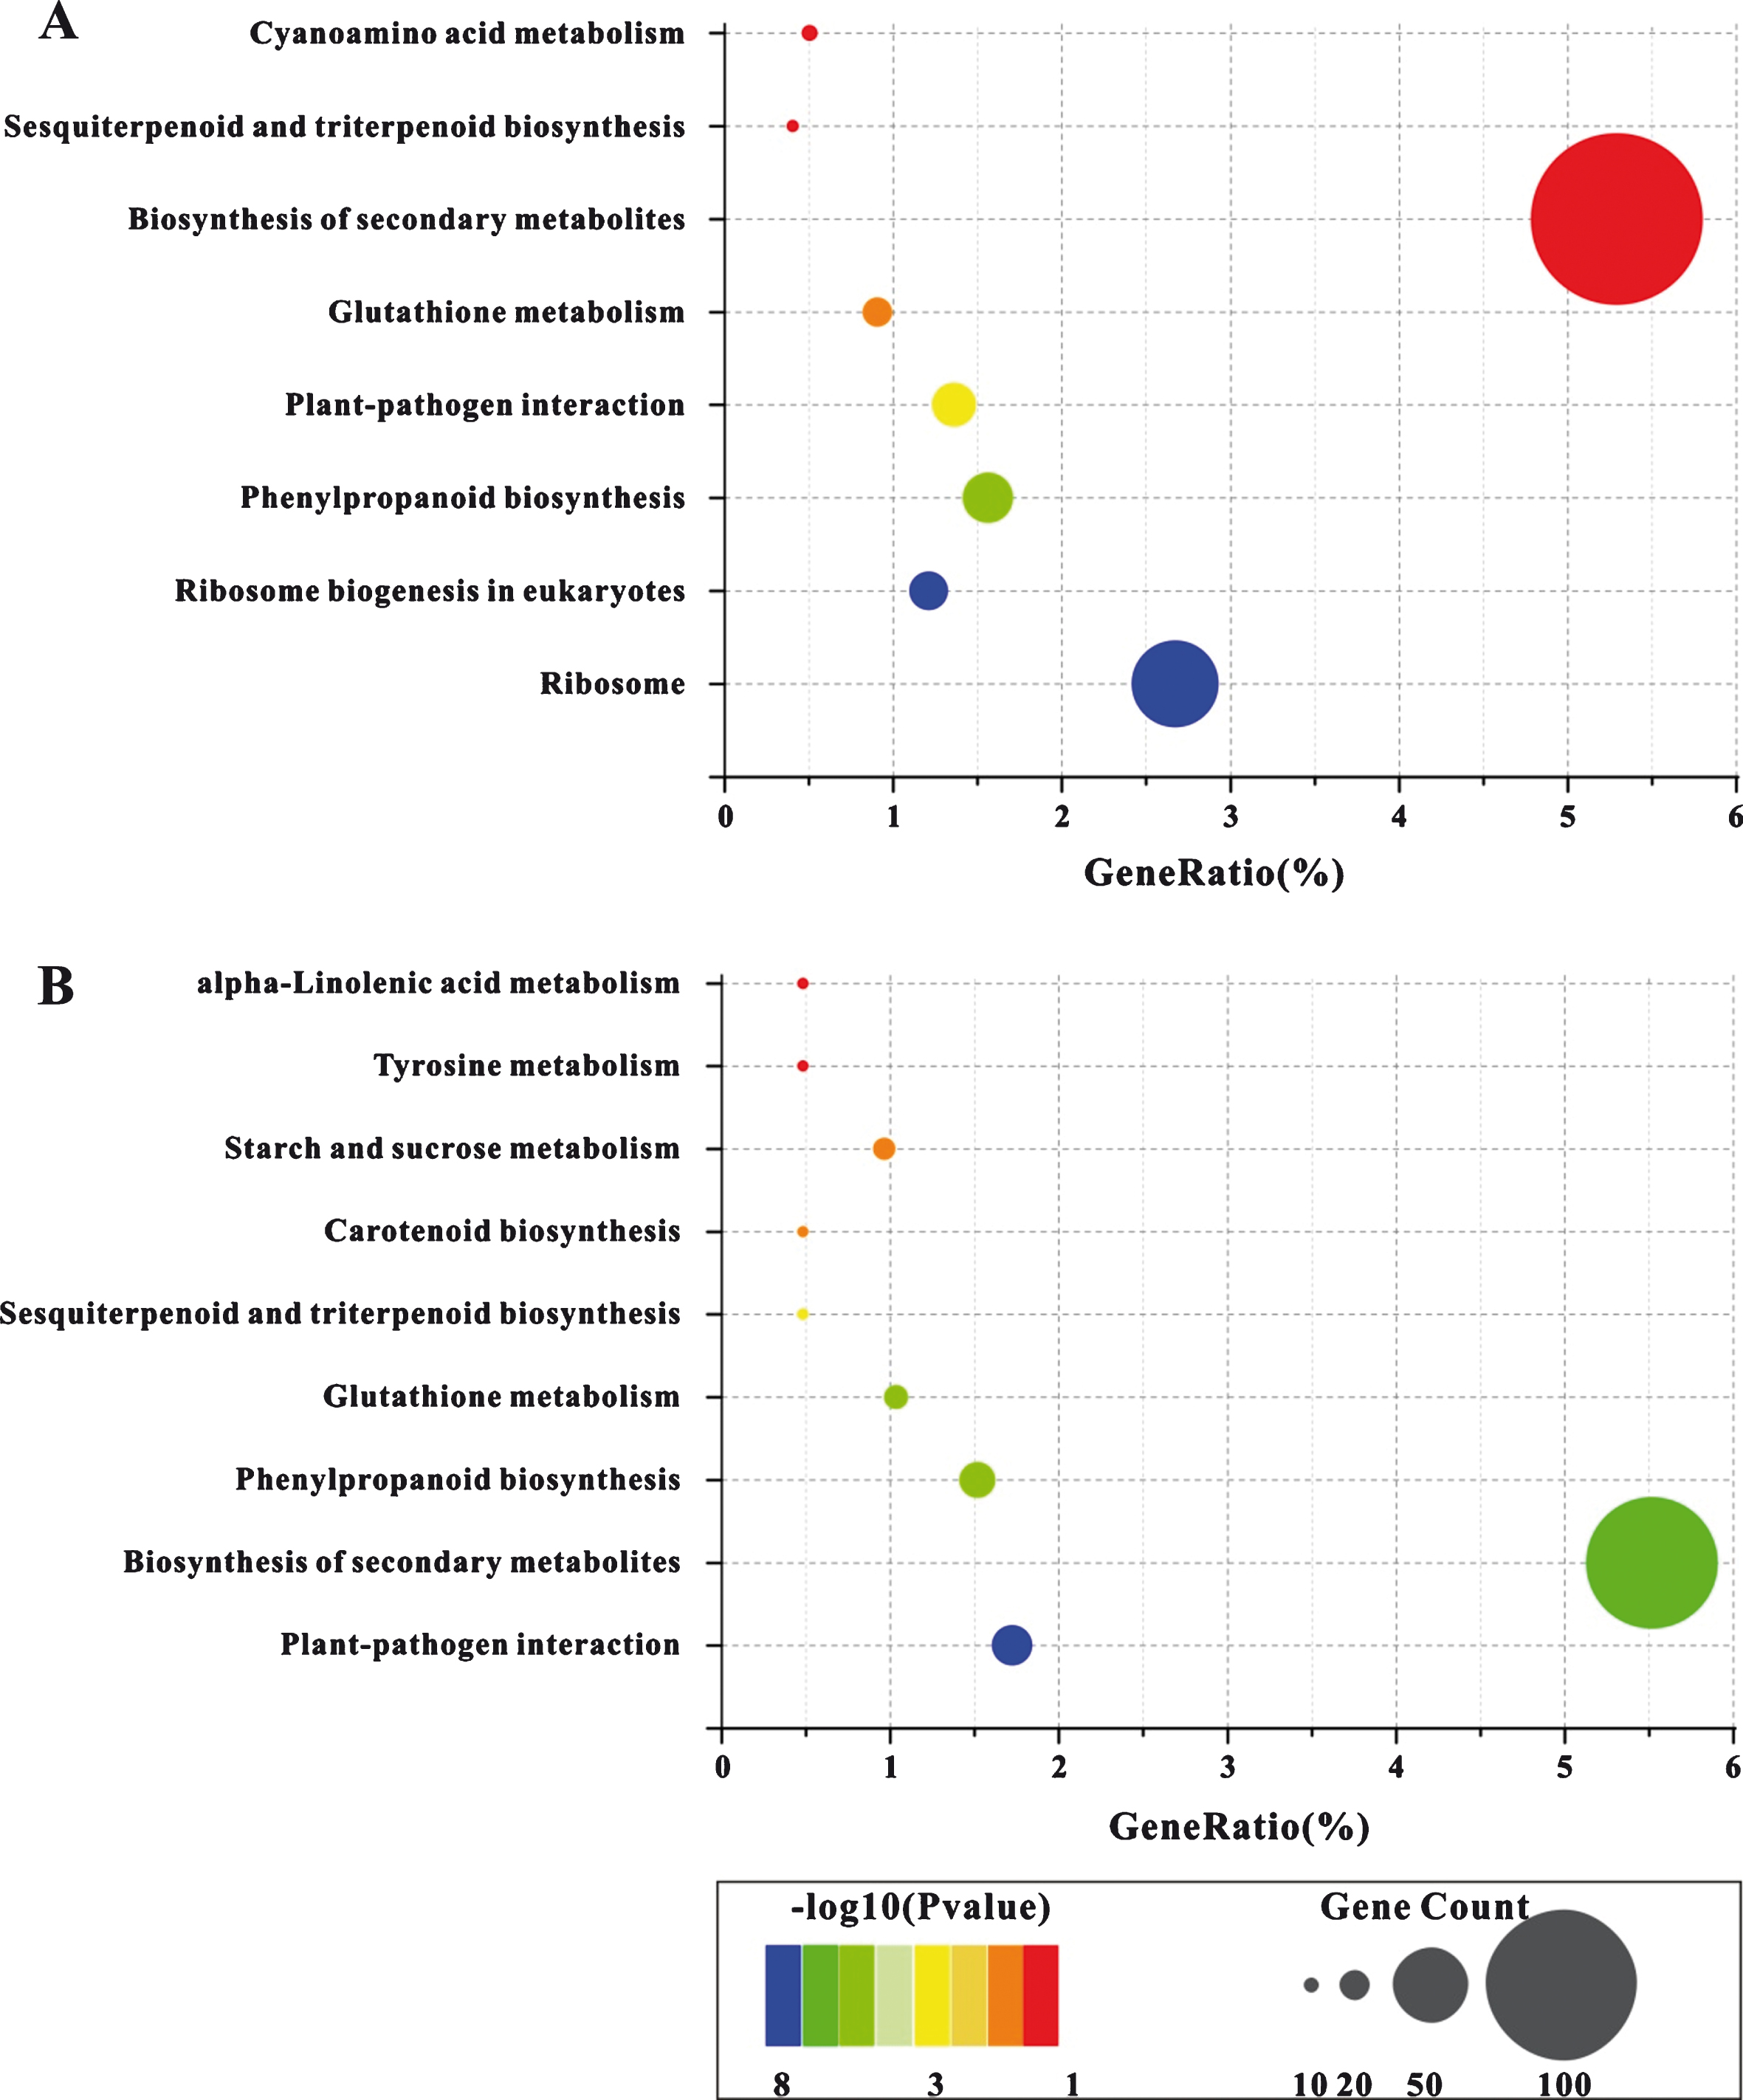
The KEGG enrichment pathways of the DEGs in HW (A) and YW (B). The circle size indicates number of genes. The larger the circle, the more genes related to the corresponding pathway.
In YW, nine pathways were enriched with 7 to 80 DEGs, in which the YW-only enriched pathways were the “alpha-Linolenic acid metabolism”, “Tyrosine metabolism”, “Starch and sucrose metabolism” and “Carotenoid biosynthesis” (Fig. 4B). The other five pathways, “Sesquiterpenoid and triterpenoid biosynthesis”, “Carotenoid biosynthesis”, “Tyrosine metabolism”, and “alpha-Linolenic acid metabolism”, each had 7 genes (0.48%), whereas the most enriched genes (80) were found in the “Biosynthesis of secondary metabolites” (5.52%); and the “Plant-pathogen interaction” with 25 enriched genes (1.72%) had the highest confidence level with P < 0.0001, compared to those in HW.
After infection with the PM pathogen, expressions patterns of the DEGs in HW and YW were analyzed. For HW, the DEGs were divided into 16 expression patterns based on their expression levels at the three time points (0 dai, 1 dai, and 8 dai), in which five profiles had P < 0.01 (Fig. 5). The profile-0 contained 110 genes and showed down-regulation. However, profile-11, 12, 13, and 15 owned 267, 363, 291, and 275 genes, respectively, all exhibiting up-regulation with the most significant p-value, and representing different patterns of up-regulation (Fig. 5A; Table S3). Profile-11 increased first then remained unchanged profile-12 displayed continuously increasing expression, profile-13 up-regulated slowly at first followed by fast up-regulation, and profile-15 up-regulated quickly at first and slowly increased afterward. It is noteworthy that seven and ten genes in profile-13 and -15, respectively, were significantly enriched in “Plant-pathogen interaction” pathway with P < 0.05 (Table 1), indicating that these genes may be involved in response to pathogens.
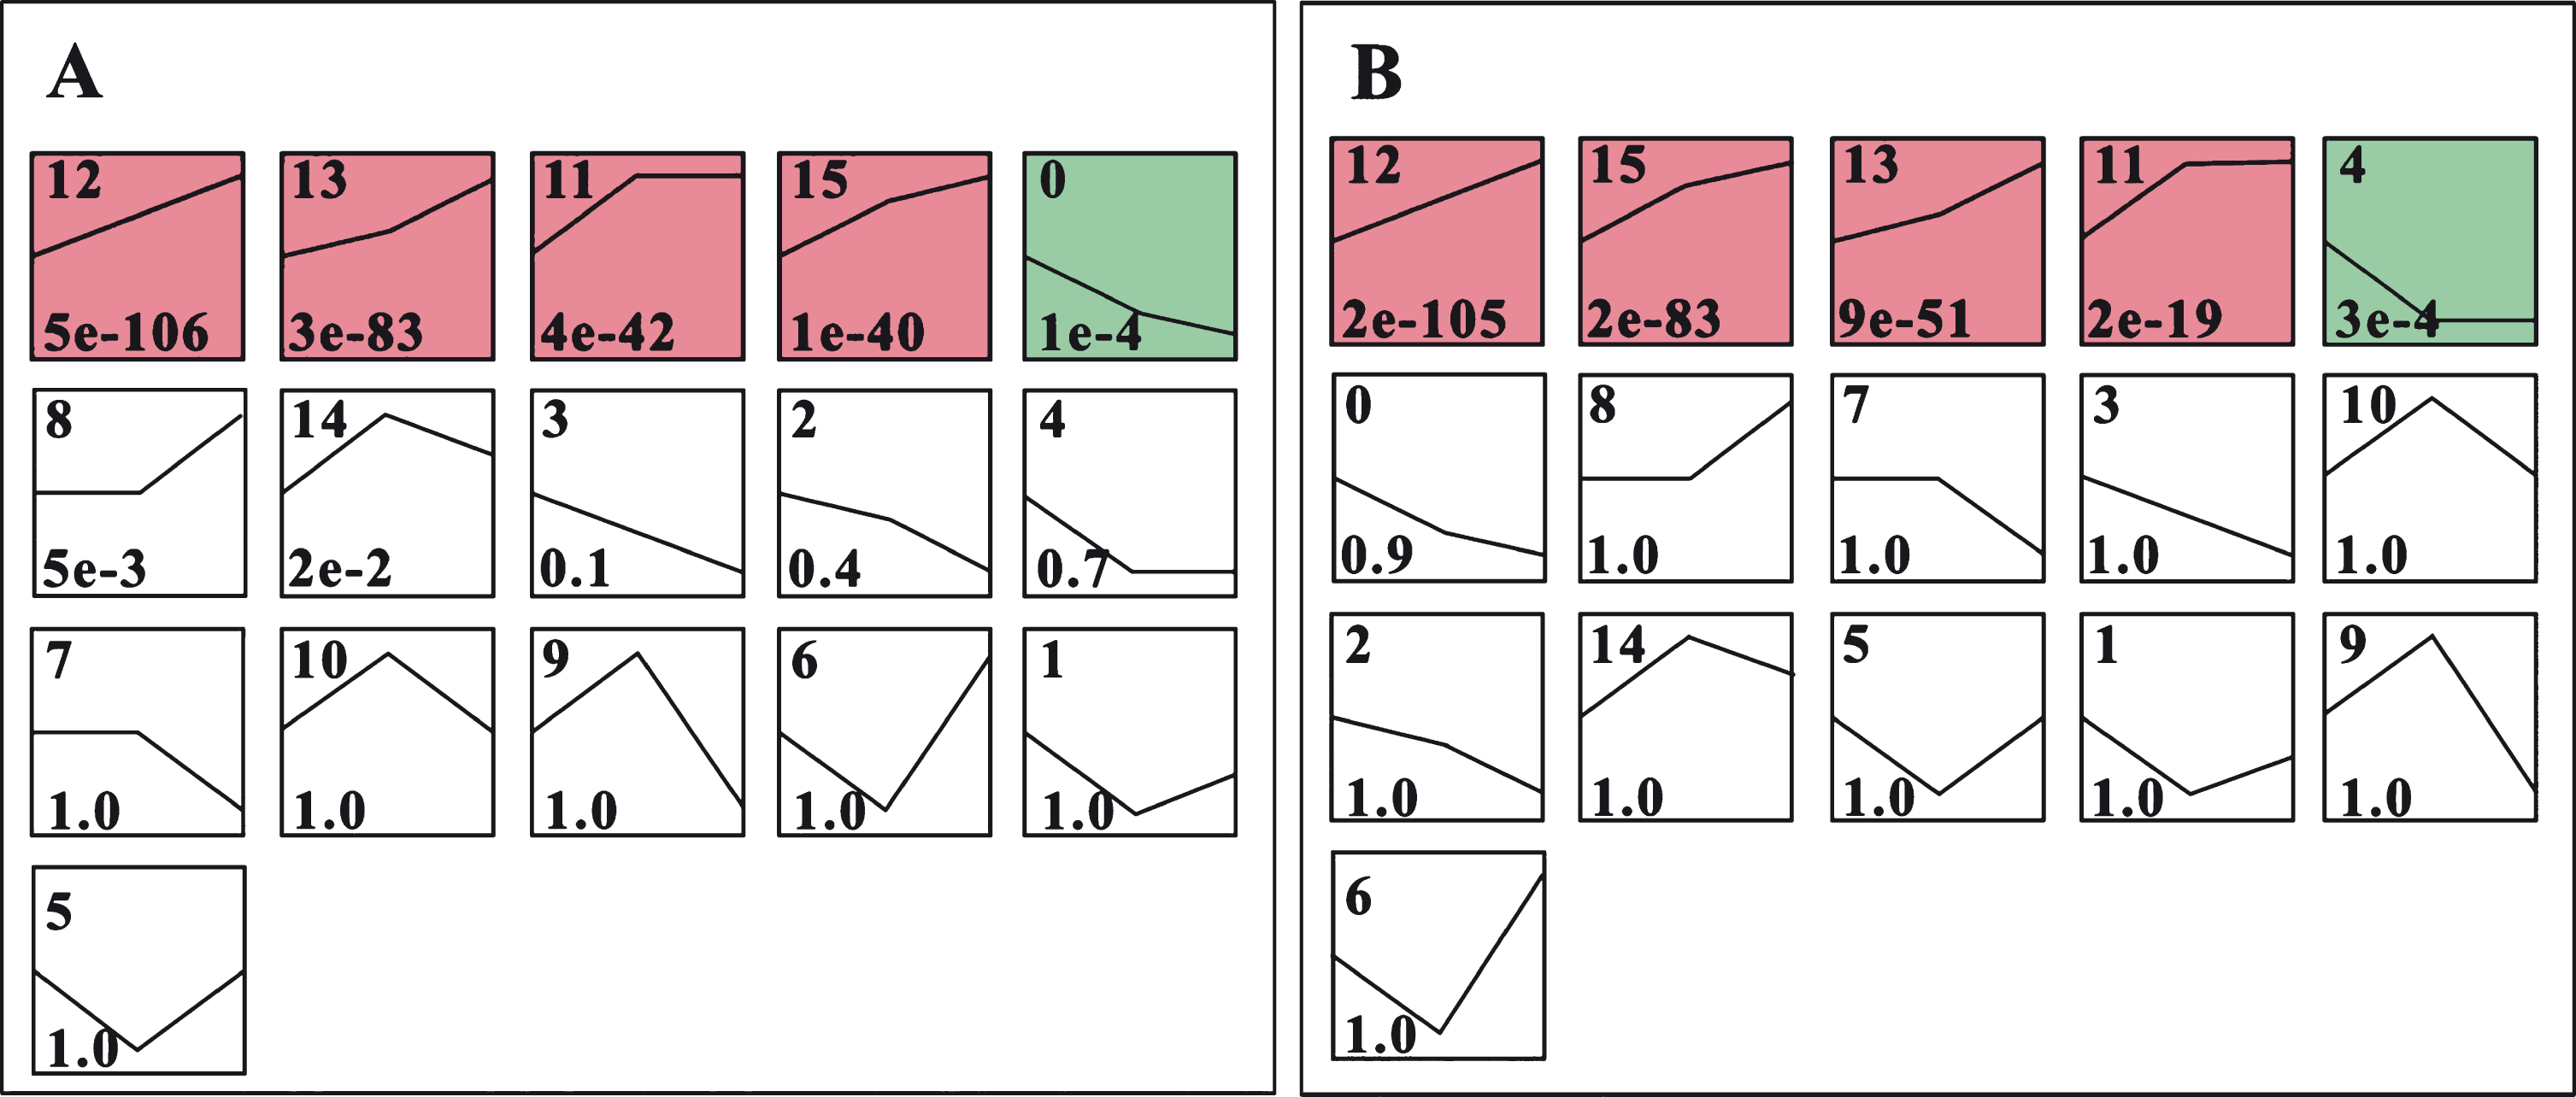
The expression profiles of the DEGs in HW (A) and YW (B). The number in the upper left corner of the box is profile No. and the number in lower left corner of the box is the P-value of the corresponding profile.
The KEGG pathway enrichment of genes in each significant profile
Similarly, 16 expression patterns were found in YW DEGs, with five parallel expression profiles compared to HW (Fig. 5B). Profile-4 had 78 genes exhibiting down-regulation at first, then the expression level was constant. Four profiles that were up-regulated with the highest confidence levels were profile-11, 12, 13, and 15 with 165, 299, 192, and 292 genes, respectively (Fig. 5B & Table S3). Although these four profiles possessed different gene numbers compared to HW, similar expression patterns were observed between the two accessions. Namely, similar patterns were observed in YW-profile-12 vs. HW-profile-12, YW-profile-15 vs. HW-profile-15, YW-profile-13 vs. HW-profile-13, and YW-profile-11 vs. HW-profile-11 (Fig. 5A and B). As expected, the YW-profile-12 and -15 both had seven genes significantly located in the “Plant-pathogen interaction” pathway with P < 0.05 (Table 1).
Co-expression networks were constructed based on the FPKM values of DEGs involved in the “Plant-pathogen interaction” pathway in four profiles: HW-profile-13, HW-profile-15, YW-profile-12, and YW-profile-15 (Table S4). In HW, the network contained 17 nodes and 136 edges, and all nodes had the same degree value of 16 (Fig. 6). In YW, there were 14 nodes and 91 edges in the network, and all nodes had the same degree value of 13 (Fig. 7). Therefore, it can be inferred that these defense-related genes are of equal importance in these networks.
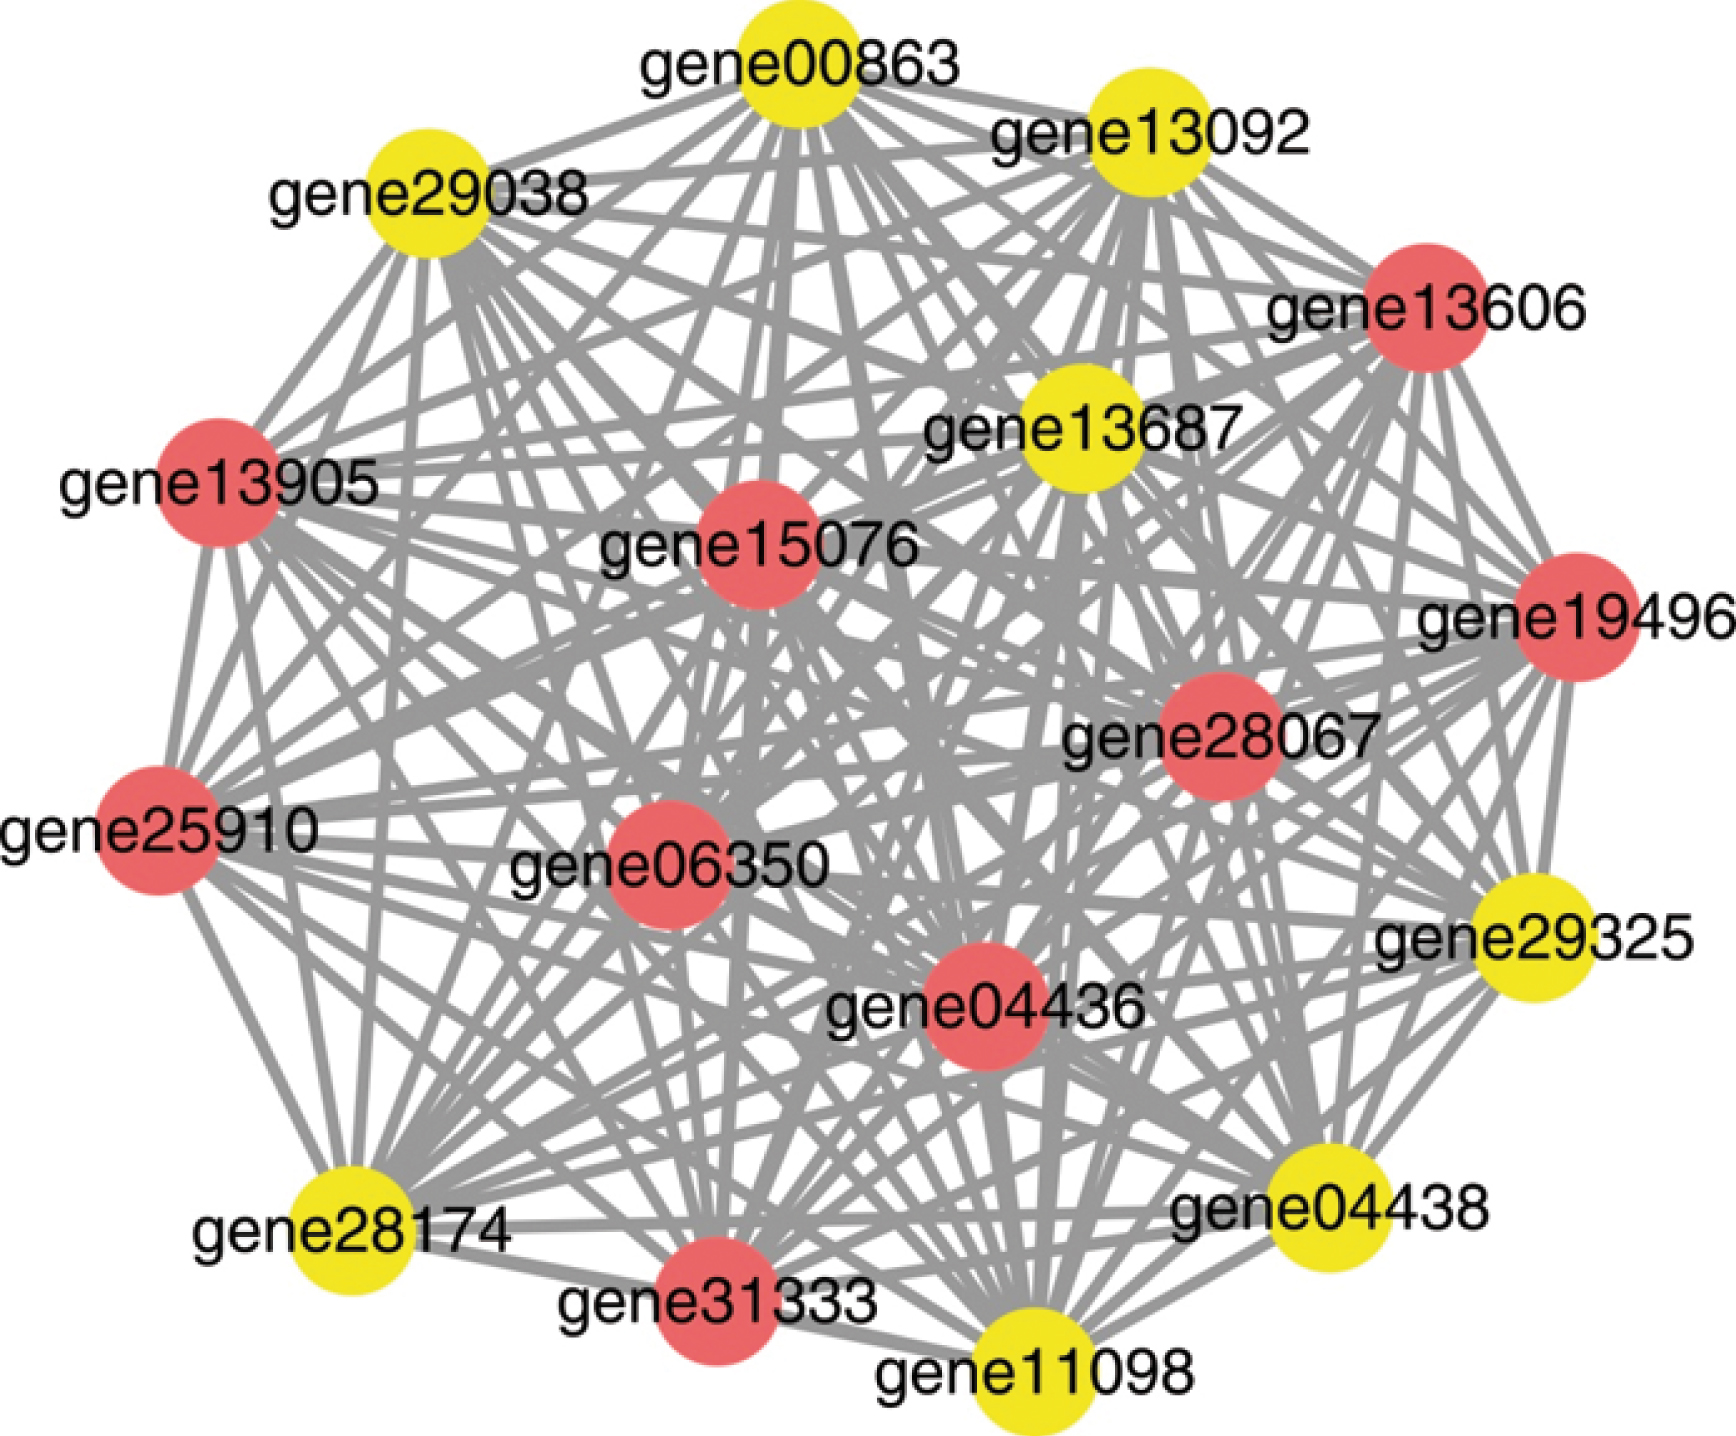
The co-expression network of genes in the “Plant-pathogen interaction” pathway from HW. The circle is a node representing a gene, and the line is an edge representing the interaction relationship between two nodes.
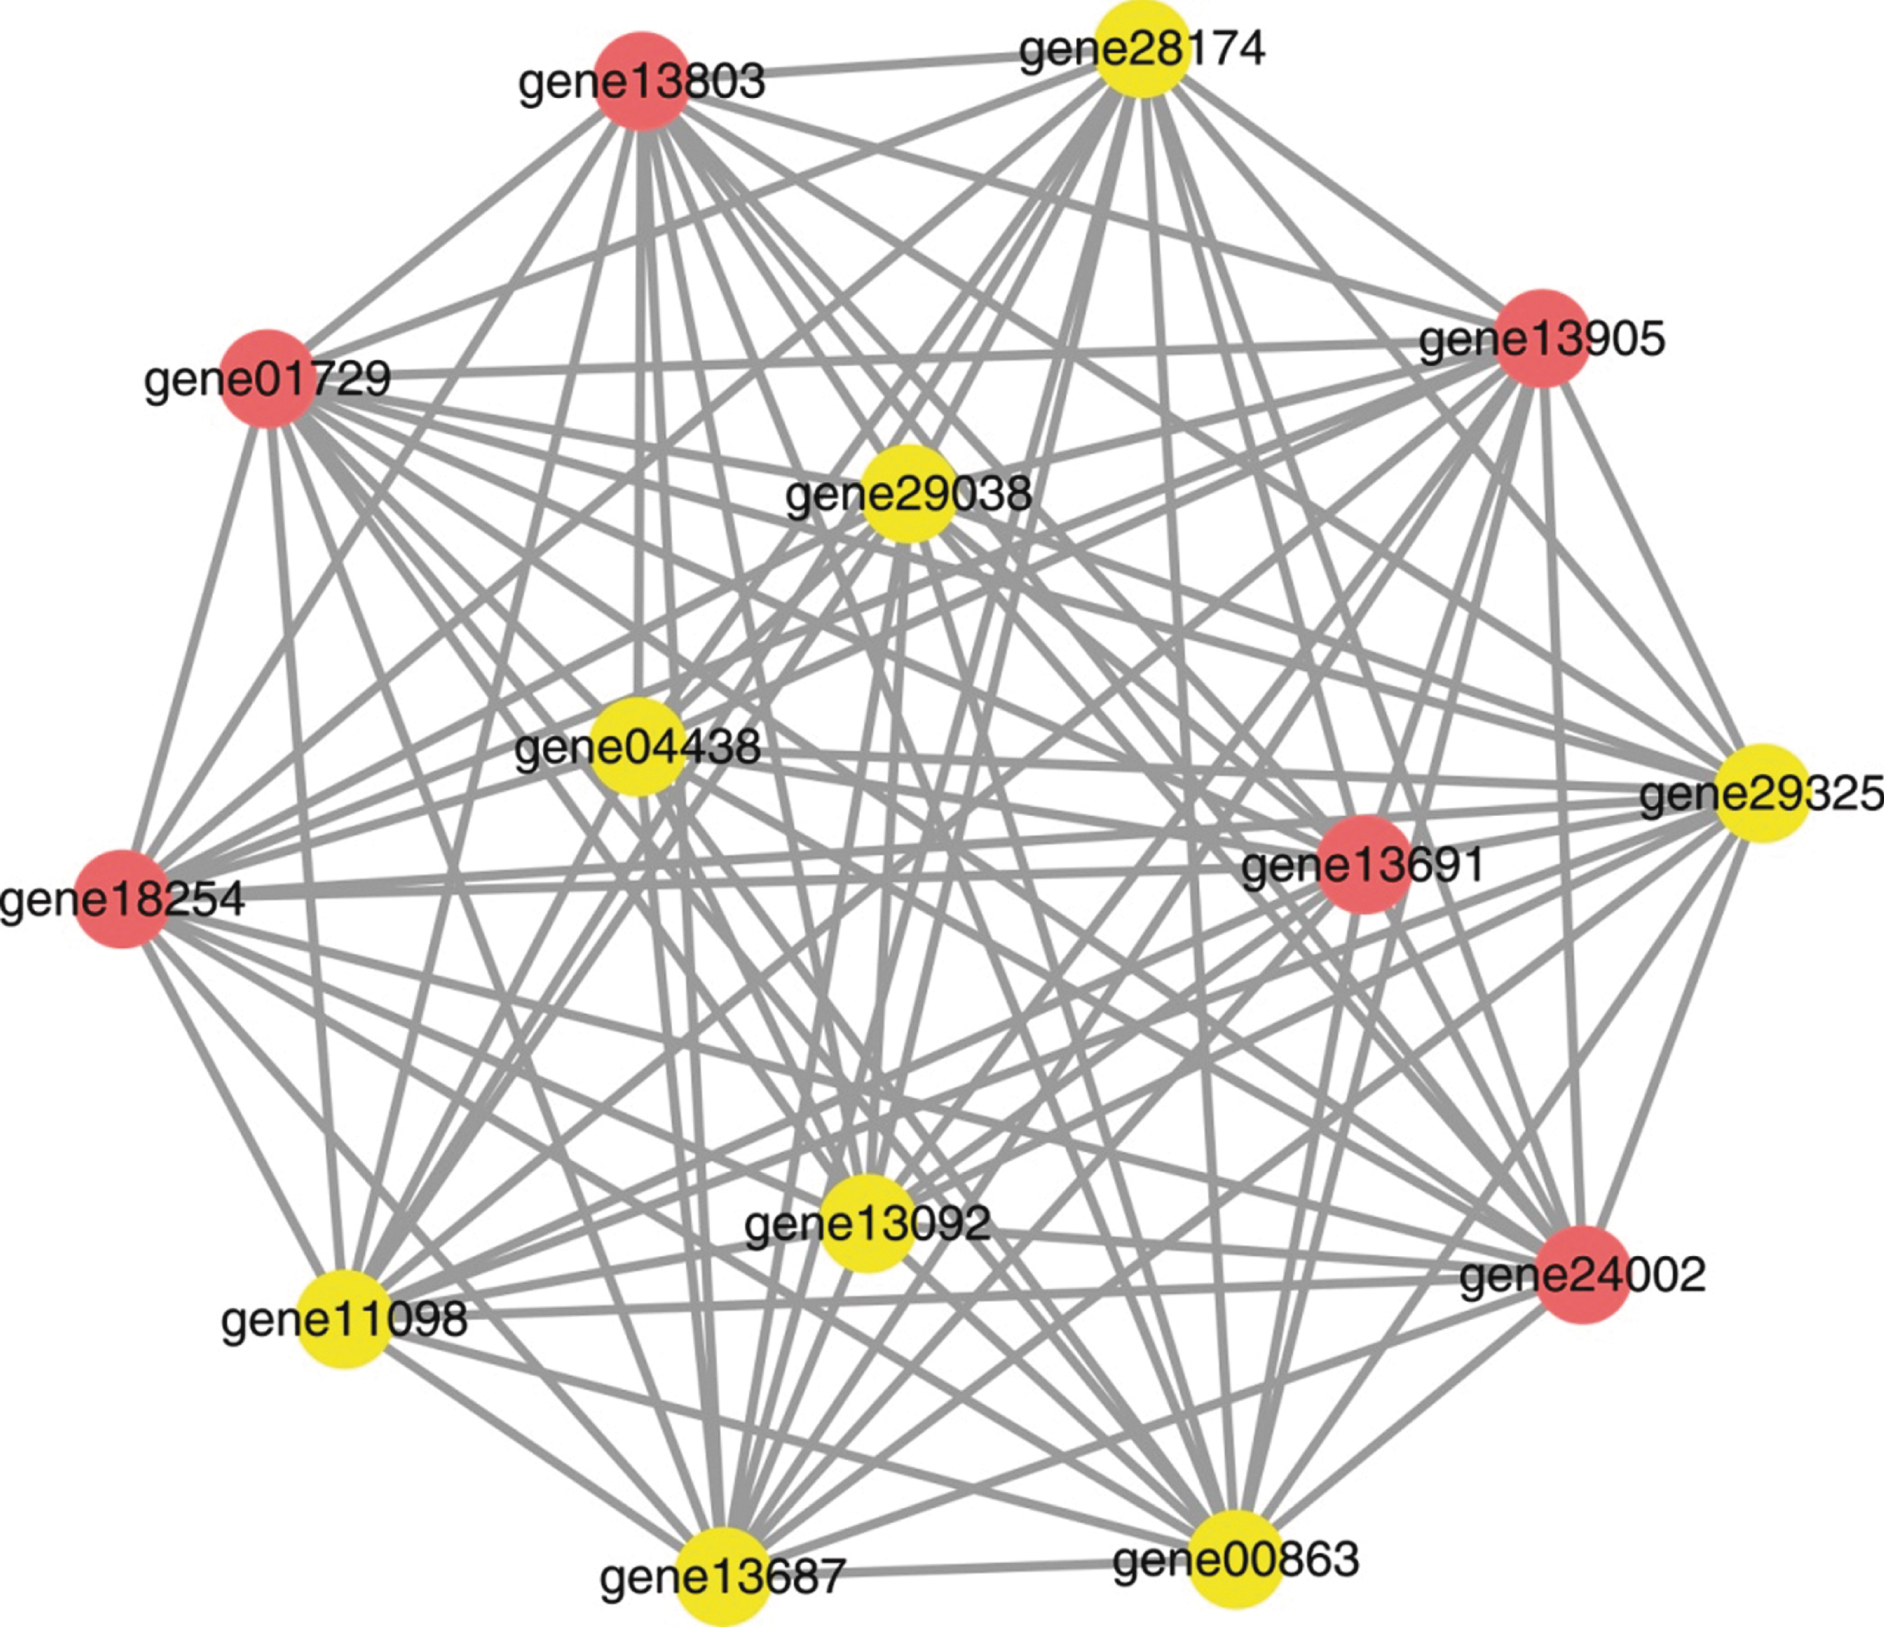
The co-expression network of genes in the “Plant-pathogen interaction” pathway from YW. The circle is a node representing a gene, and the line is an edge representing the interaction relationship between two nodes.
The susceptibility of different strawberries to pathogens can be determined according to the expression profiles of genes at the transcriptional level. Although two F. vesca accessions, HW and YW, were reported to be susceptible to PM pathogens, HW exhibited less-susceptibility than YW. After infection of P. aphanis, and the HW had later and slower spreading of white mycelia than the YW [16]. More DEGs were detected in the less-susceptible HW than in the susceptible YW. These results were also found in the study conducted by Jambagi and Dunwell. The different number of DEGs compared to the present study in the two accessions may be due to the unused threshold of FDR in the previous study [16]. Additionally, the expression levels of DEGs in HW were higher than those in YW among the HW-YW shared DEGs at different time points. These results indicate that both accessions responded to the PM pathogens in difference ways.
Similar types of differential transcriptome data were also found in two strawberry cultivars, ‘Yanli’ and ‘Benihoppe’, that were infected with C. gloeosporioides, where the resistant cultivar ‘Yanli’ had more DEGs than the susceptible ‘Benihoppe’ [12]. Similarly, the gene expression levels of the moderately resistant strawberry cultivar, ‘Andana’, responded quicker and more intensely than the very susceptible ‘Camarosa’ after their leaf tissues were infected by C. acutatum. After inoculation with C. gloeosporioides, NBS-LRR genes were more sensitive and had a notable hike in expression levels in the less-susceptible cultivar ‘Sweet Charlie’ than in the more susceptible cultivar ‘Jiuxiang’ [20]. The phenomena of cultivar- or accession- dependent gene expressions in response to pathogen infection have also been widely demonstrated in other crop plants. For example, after infection with the downy mildew pathogen, the resistant species Vitis riparia responded quickly by higher expressions of modulated genes than the susceptible species V. vinifera [21]. In rice, a larger number of DEGs were detected in the transgenic line 9804-Rxo1 carrying a non-host maize R gene than in the recipient line 9804, when infected with X. oryzae pv. oryzae [22].
One initiative in characterizing these DEGs is to determine what the shared characteristics are between the different accessions. In this study, we found that HW and YW shared DEGs occurring with high frequency when encoding protein domains of PPR, Pkinase, Ank, NB-ARC, Myb_DNA_binding, WRKY and zf-RING. Interestingly, these DEGs are involved in different aspects of the growth, development and environmental response.
The pentatricopeptide repeat (PPR) is a degenerate 35 amino acid motif, tandemly arranged with 2 to 26 copies in a PPR protein, which has experienced extreme expansions in plant genomes [23, 24]. Despite the large size of the PPR gene family, it has been shown to be involved in a broad spectrum of functions with little or no redundancy, such as post-transcriptional regulation (RNA processing and translation) in mitochondria and chloroplasts [24]. For example, a mitochondrial PPR protein, PPR40, plays a role in mitochondrial electron transport for oxidative respiration, which is closely associated with stress and hormonal responses in the environmental adaptation of A. thaliana [25]. After the infection of X. oryzae pv. oryzae, a large set of PPR genes in the transgenic rice line 9804-Rxo1 were up-regulated, possibly functioning in post-transcriptional processes to participate in the JA-mediated disease responses with a maize NBS-LRR gene [22]. Therefore, the evolutionary expansions of PPR genes in plants have lead to some of these genes experiencing a “birth-and-death” process, as disease resistance genes are under selective pressure [26].
Another protein domain shared between the HW- and YW-DEGs was the protein kinase domain (Pkinase). Pkinase is a conserved structural domain of eukaryotic protein kinases, which comprise one of the largest superfamilies holding a rich diversity of structures, regulation modes, and substrates [27]. There are two broad classes within the superfamily, the serine/threonine kinases and tyrosine protein kinases [28]. These superfamily members play important roles in diverse cellular processes like metabolism, transcription, cell cycle progression, cytoskeletal rearrangement and cell movement, apoptosis and differentiation, especially the disease resistance in plants [27, 30]. The rice Xa21 gene, encodes a leucine-rich repeat (LRR) motif and a serine/threonine kinase-like domain, conferring high levels of resistance to X. oryzae pv. oryzae [31]. The Pto gene in tomato that displays resistance to races of Pseudomonas syringae also belongs to serine/threonine protein kinases [32].
It is not surprising that LRR and NB-ARC domains were found in these DEGs with high frequency, as NBS-LRR is one of the largest plant R gene classes [33]. The functional NBS-LRR resistance genes have been identified in various species, such as the rice blast resistance genes Pi37 and Pi9, the potato late blight resistance gene R1, and the apple scab resistance gene Rvil5/Vr2 [34–37]. Furthermore, the ankyrin repeat (Ank) is a motif involved in protein recognition, and ankyrin repeat-containing proteins take part in antioxidation metabolism and disease resistance in plants [38, 39].
Other noteworthy domains found in these DEGs were structural compositions of transcription factors (Myb_DNA_binding, WRKY and zf-RING), which play crucial roles in plant responses to diverse biotic or abiotic stresses via the transduction networks to control development processes and stress reaction [40]. The WRKY genes are greatly induced or depressed by pathogen infection in plants; take for example the strawberry response to C. gloeosporioides infection, tomato response to yellow leaf curl virus, and rice response to Magnaporthe oryzae infection [12, 42]. Similarly, Myb-related genes were also highly represented after plant-pathogen interactions, such as, strawberry under C. acutatum infection, wild peanut challenged with Cercosporidium personatum, and watermelon inoculated by cucumber green mottle mosaic virus (CGMMV) [43, 44].
The significantly enriched KEGG pathways of DEGs showed that some biological processes are influenced by PM infection. The most affected pathway, shared by HW and YW, is the metabolism-related process, including “Sesquiterpenoid and triterpenoid biosynthesis”, “Biosynthesis of secondary metabolites”, “Phenylpropanoid biosynthesis”, and “Glutathione metabolism”. Another significant biological process is “Plant-pathogen interaction” during the PM infection of strawberry. These Sesquiterpenoid and Triterpenoid biosynthesis pathways were significantly found in the DEGs of systemic acquired resistance of Nicotiana tabacum, which were induced by 3-Acetonyl-3-hydroxyoxindole (AHO) [45]. The specialized triterpenoids are the major components of the wax layer and cuticle of Artemisia annua, which may assist the plant against the environmental stress [46]. The phenylpropanoid biosynthesis pathway is one of the most pivotal pathways in secondary metabolism pathways, and has been shown to play a key role in plant defense. The genes related to these pathways were widely enriched in the DEGs of O. meyeriana in response to rice bacterial blight infection and banana to Fusarium oxysporum f. sp. cubense infection [15, 48]. Another pathway product, glutathione, participates in redox reactions of many physiological processes, and are significantly involved in defense-related signaling events, as well as stress-related gene expression [49]. The activation of glutathione metabolic pathway was previously reported in resistant wheat plants but not in susceptible plants after infection with Hessian fly, suggesting that glutathione may mediate resistance to pathogens or insect infection [50]. It is worth paying attention to the plant-pathogen interaction pathway, in which HW and YW shared DEGs encoding WRKY, EF-hand, Pkinase, NBS-LRR genes and HSP90 (Table S4). These genes were all involved in plant defense processes and may provide the opportunity for effective screening of candidate genes in strawberry disease-resistance breeding.
Funding
The authors report no funding.
Conflict of interest
The authors have no conflict of interest to report.
Footnotes
Acknowledgments
This study was supported by the Fundamental Research Funds for the Central Universities (SYSB201804), the National Natural Science Foundation of China (31501737), partly supported by the open funds of the State Key Laboratory of Crop Genetics and Germplasm Enhancement (ZW201711), and the Fundamental Research Funds for the Central Universities (KJQN201655).