



Abstract
BACKGROUND:
Excessive production of grape is valorized by traditional drying and homemade jam production in some regions of Algeria.
OBJECTIVE:
This study aims to investigate the changes in antioxidant activity, phenolic compounds and their bioaccessibility in two grape varieties (Cardinal and Dabouki or Sabel) as a result of traditional sun drying and homemade jam processes.
METHODS:
Fresh and dried grapes, as well as jam samples were subjected to a series of spectrophotometric analyses including total phenolics, flavonoids, and antioxidant activity. Individual phenolic compounds were identified and quantified by HPLC-DAD-MS-QTOF. An in vitro gastrointestinal digestion was applied to evaluate the bioaccessibility.
RESULTS:
Both traditional processes led to considerable losses in the levels of some phenolic compounds and their antioxidant activities. However, an increase in the content of other phenolic acids was also observed after processing. Total phenolics, total flavonoids and total antioxidant capacity recovery values of the dialysable fraction of processed samples were higher than those of fresh grapes for both varieties.
CONCLUSIONS:
Traditional raisins and homemade jams could be considered as good sources of natural antioxidants, although a modification of some critical steps that may negatively affect their antioxidant properties is suggested in the light of this study.
Introduction
Fruits (fresh or processed) are valuable sources of nutrients and secondary metabolites or “bioactive compounds” including polyphenols, which are one of the top current topics of recent studies investigating their health benefits [1, 2]. This particular interest is due to the fact that in recent years consumers have started to reorient themselves towards the consumption of natural products and ingredients instead of the synthetic ones as a result of some health concerns [3]. Among the fruits, grapes (Vitis vinifera) are one of the world’s most commonly produced fruit crops, with approximately 75 million tonnes produced every year. It is also one of the most abundant fruits, and almost 50% of grapes are used to make wine, one third is consumed as fresh fruit and the rest is consumed as processed products, such as raisins, jam, juice, jelly, grape seed extract, vinegar and grape seed oil [4].
The importance of grapes (red or white varieties) is not only related to their nutritional composition but also to their protective role against degenerative diseases resulting from oxidative stress prevented generally by the contents of health-promoting polyphenols [5, 6]. Grape phenolics could be arbitrarily categorised into single-ring phenolic acids, bisphenols including stilbenes, tricyclic phenols (flavonoids) and their subclasses (flavans, flavonols, etc.), oligomeric and polymeric species, the proanthocyanidins and anthocyanidins [7]. Flavonoids and stilbenes, including resveratrol with its analogs and conjugates, have been reported to havea preventative and possibly therapeutic value in atherosclerosis, certain neoplastic and inflammatory effect besides their antioxidant potential and neuropharmacological activities [8].
The demand from the Algerian market of fruits and their products, including raisins and grape jams is increasing year by year. One of the main reasons that induced this growth is the increasing use of fruits as essential ingredients in many traditional dishes, particularly those popular with households during the period of family celebrations and traditional practices [9].
It has been reportedthat in the region of Tadmait in Algeria, grapes are processed into raisins and jam by traditional practices (sun drying and homemade jam processing) to valorize thegrapes of low market value and preserve the excess of the production [10]. Processing fruits into various products by heat treatments, including drying and jam processing may have significant impacts on the quantity and quality of the phenolic compounds occurring in the end-product. In this context, Fabani et al. [11] and Rein [12] reported that sun drying of fresh grapes resulted in a thermodegradation (40– 45°C) of certain phenolic compounds such as flavan-3-ols and anthocyanins. In another study, Amakura et al. [13] investigated the impact of processing red berries into jam, and they recorded a slight increase in polyphenol content. Moreover, Cilla et al. [14] reported that food processing is one of the main determinants of nutrients and bioactive compounds bioaccessibility.
To our knowledge, studies on the impact of traditional processes such as sun drying and domestic heat treatments in general (cooking for homemade jam production) on the quantity and quality of grape polyphenols and their bioaccessibility are limited and their data are rather contradictory. Therefore, changes in phenolic compounds, in vitro antioxidant capacity and their bioaccessibility are invsestigated in this study. Two varieties of grapes (Cardinal, early red variety and Sabel, late white variety) growing in the location of Tadmait, Algeria during sun drying raisins and homemade jam production are herefore investigated.
Materials and methods
Grape material
Fresh grape samples (Cardinal and Sabel varieties) were collected in summer 2016, from the location of Tadmait (Algeria). Both early (Cardinal) and late (Sabel) varieties were processed into traditional dried grapes (sun drying) and homemade jams following the flow charts shown in Fig. 1. The sun drying was carried out by direct exposure of grape bunches to the sun. For the Cardinal variety, drying process ended after 3 weeks of exposure (starting from mid-July) at temperatures of 40– 48°C. However, for the Sabel variety, drying process continued for 4 weeks (starting from mid-September) at temperatures of 35– 40°C. Dried products are called raisins or dried grapes, both names were used in the text. “Jam wastes” means the solid part (composed of seeds and skins) retained after mixing and filtration of cooked grapes.

Flow diagrams of traditional sun-dried raisins (left) and homemade jam (right) from two varieties of red grapes (early variety: Cardinal) and white (late variety: Sabel).
Moisture content was determined by drying 5 g of each sample in a ventilated oven (HERAEUS T-6060, Germany) at 103±2°C (
Extract preparation
All extracts (fresh samples, dried samples, jams and jam wastes) were prepared in triplicate from lyophilized samples (– 50°C, 0.1×10⁻³ Mbar). Samples were frozen in liquid nitrogen and immediately ground into a fine powder with a pre-cooled grinder (IKA A11, Germany). For each sample, 10 mL of aqueous acidified methanol (75%, 0.1% formic acid) was added to 1 g of powder. The mixture was sonicated for 15 min at 4°C, and then centrifuged at 2500 rpm for 10 min. The upper layer was separated and the same extraction procedure was repeated three times. The resulting supernatant was used as the crude extract for total phenolics, total flavonoids, antioxidant capacity assays and chromatographic analysis [15, 16].
Spectrophotometric measurements
The total phenolic content was determined (at 765 nm) using the Folin-Ciocalteu reagent (FC). Briefly, the reaction mixture consisted of: 100μl of crude extract, 900μl of pure water and 5 mL of 0.2 N FC and 4 mL of 20% sodium carbonate solution (Spanos & Wrolstad, 1990). The results were expressed in mg gallic acid (GA) equivalent/100 g Dry Weight (DW) according to a calibration curve prepared with different concentrations of 0.01– 0.2 mg/mL of gallic acid.
Total flavonoid content was measured (at 510 nm) using aluminium chloride and sodium nitrite as reagents [17]. Catechin was used as standard at different concentrations of 0.01– 0.4 mg/ml and data was expressed as mg catechin equivalent (mg CA/100 g DW).
Total monomeric anthocyanin (TMA) content was determined using the pH differential method [18]. The results were expressed in terms of cyanidin-3-O-glucoside equivalent (mg C3GE/100 g DW).
Total antioxidant activity (TAC) was evaluated by four different in vitro methods: ABTS (2,2-azinobis-3-ethylbenzothiazoline-6-sulphonic acid diammonium salt) method, DPPH (1,1-diphenyl-2- picrylhydrazyl) method, FRAP (ferric reducing antioxidant power) method and CUPRAC (cupric ion reducing antioxidant capacity) method as described by [19, 22], respectively. Trolox was used as a reference for all tests and the results were expressed in terms of mg trolox equivalent antioxidant capacity (TE) per 100 g DW.
Quantitative HPLC-DAD and LC-MS-QTOF analysis
The separation and quantification of phenolic compounds were performed on an HPLC system (1200 Series; Agilent Technologies Inc., Palo Alto, CA, USA), following the protocol of Capanoglu et al. [16], with slight modifications. Briefly, the methanolic extracts of the two fresh varieties and their products (traditional raisins and homemade jams) were filtered through a 0.2μm membrane filter. After injection, the separation of phenolics was performed on a reverse phase (RP) C18 column (PLRP-S; 250×4.6 mm, 5μm particle size, 100 Å pore size; Varian, Palo Alto, CA, US) at 25°C. The gradient of the mobile phase A (MQ water with 0.1% formic acid) and the mobile phase B (acetonitrile with 0.1% formic acid) was used at a flow rate of 0.8 mL min–1. The gradient profile was set as follows; 0 min, 95% solvent A, 5% solvent B; at 60 min, 71% solvent A, 29% solvent B; at 62 min, 25% solvent A, 75% solvent B, and at 69 min the conditions were restored to the initial setting (95% solvent A, 5% solvent B. Calibration curves with the representative standards of each class of phenolic compounds were used to quantify the individual compounds at an appropriate wavelength, including 280 nm (hydroxybenzoic acid and flavanol-3-ol), 312 nm (hydroxycinnamic acids), 360 nm (flavonols) and 520 nm (anthocyanins). The standards used were gallic acid, caffeic acid, catechin, quercetin and cyanidin-3-O-glucoside. The content of each compound was expressed as mg equivalent appropriate standard/100 g of dry weight (mg/100 g DW).
The LC-MS-QTOF procedure applied was slightly modified from that described by Carrillo et al. [23]. The analyses were performed in both positive (for anthocyanins) and negative (for non-coloured phenolics) ionization mode using an Agilent 1260 Infinity ultra-high performance-liquid chromatography system coupled to 6545 accurate-mass QTOF Mass, with Jet Stream Ionization source. Chromatography was performed exactly under the same conditions as those of HPLC-DAD (described above). QTOF conditions were as: gas nitrogen flow rate 10 L/min at 400°C; drying gas nitrogen flow rate 8 L/min at 350°C; nebulizer pressure 50 psi, nozzle voltage 1 kV, capillary voltage 3.5 kV. Signals in the m/z 100– 1200 range were recorded.
In vitro digestion procedure
In vitro digestion was performed according to Minekus et al. [24], with slight modifications. Three stages of digestion were taken into consideration, namely: oral phase fraction-released from matrix in mouth, stomach phase fraction-released from matrix in stomach, and intestinal phase fraction-released from matrix by the small intestine was separated into two fractions including (IN) representing the material that entered the serum (Dialysis membrane filled with 4% NaHCO3); the dialyzable fraction and (OUT) representing the material that remained in the gastrointestinal (GI) tract; the undialyzable fraction.
In the procedure, one gram of each sample was weighed into centrifuge tubes and mixed with 3.5 mL of simulated saliva fluid (SSF), then human salivary α-amylase solution (1500 U/ml, Sigma-Aldrich A1031) was added into the sample tubes. The mixture was then adjusted to pH 7.0 and incubated at 37°C in a shaker at 100 rpm for 2 min. For oral phase, 2 mL aliquots were collected for each sample. Afterwards, oral bolus was mixed with 7.5 mL of simulated gastric fluid (SGF). Later, porcine pepsin solution (25 000 U/ml, Sigma-Aldrich P7012) was added. The mixture was then adjusted to pH 3 and incubated at 37°C in a shaker at 100 rpm for 2 h. For stomach phase, 2 mL aliquots were collected for each sample. Finally, 20 mL of gastric cyme was mixed with 11 mL of simulated intestinal (SIF), pancreatin solution (800 U/ml, Sigma-Aldrich P7545), and bile solution (160 mM), respectively. pH was adjusted to 7.0 and the samples were incubated at 37°C in a shaker at 100 rpm for 2 h. After the intestinal phase, samples were collected to be stored at – 20°C until further centrifugation at 18,000 rpm and analysis concerning TPC, TFC contents, and TAC were performed for each stage; Oral (Mouth fraction), PG, IN and OUT fractions using spectrophotometric methods as described above. The mean recovery values expressed as percentages were calculated by dividing the average values obtained for the IN fraction to the average initial values (prior to digestion).
Statistical analysis
All analyses were performed in triplicate. Data were statistically analyzed using (XL-STAT 2009, 1.01, Addinsoft Inc Long Island, USA) for the analysis of variance (ANOVA) for n = 3 processing events. Tukey’s New Multiple Range Test (P≤0.05) was applied for post hoc tests.
Results
Moisture content
Drying and homemade jam processing led to considerable water loss for both grape varieties. The losses reached 59% and 64% for red and white sun-dried raisins, respectively. During the homemade jam process, water losses reached 49% and 57% for the red and white varieties, respectively.
A significant difference (P < 0.05) was detected between the moisture of the two fresh varieties and their homemade jams. However, no significant differences were observed between the raisin types.
Effect on total phenolics, total flavonoids and total monomeric anthocyanins
According to the results shown in Table 1, levels of total phenolics, total flavonoids, and monomeric anthocyanins were higher in fresh grapes compared to raisins and jams for both varieties. For the Cardinal variety, total phenolics decreased by 67%, 70% and 39% for raisins, jam and its waste, and by 66%, 70%, 46% for the Sabel variety, respectively.
Moisture, total phenolics, total flavonoids, total monomeric anthocyanin contents of samples
Moisture, total phenolics, total flavonoids, total monomeric anthocyanin contents of samples
TPC: Total Phenolic Content (mg GAE/100 g dry weight); TFC: Total Flavonoids Content (mg Catechin equivalent/100 g dry weight); TMA: Total Monomeric Anthocyanins Contents (mg cyanidin-3-glucoside/100 g dry weight). The values are means±standard deviation. All values are expressed by mg/100 g dry weight with the exception of moisture which is expressed by %. Different lowercase letters in each columns represent statistically significant differences (p < 0.05). Jam waste consists of skin and seeds that are retained after grinding of cooked grape berries.
The level of total flavonoids also decreased significantly in raisins, jams and their wastes by 68%, 61%, 41% for the Cardinal variety, and 52%, 49%, 33% for the Sabel variety, respectively. It is important to notice that high amounts of TPC and TFC were retained in the red and white jam wastes which are composed of fruit skin and seeds.
The monomeric anthocyanins in the red grapes were also highly affected by sun drying and homemade jam processes. Hence, decreases of 99%, 98% and 96% were observed for raisin, homemade jam and jam waste, respectively.
The contents of total phenolics and total flavonoids were higher in the red variety than the white variety for fresh samples. However, it should be noticed that no significant difference was recorded between the two traditional processes for the two varieties studied.
It is clearly observed that for the different assays (DPPH, CUPRAC, ABTS and FRAP), both traditional processes induced significant losses of antioxidant capacity, ranging from 37% to 65% and from 45% to 76% during sun drying and homemade jam processes for both varieties, respectively (Table 2). In addition, in homemade jam process, the separation and removal of jam waste seemed to be in turn, a reason for the losses in antioxidant capacity for both varieties.
Levels of total antioxidant capacity using three different methods (mgTAC/100 g dry weight)
Levels of total antioxidant capacity using three different methods (mgTAC/100 g dry weight)
Different lowercase letters in each columns represent statistically significant differences (p < 0.05).
Concerning the variety influence, the antioxidant capacity of fresh red grapes was significantly higher (P < 0.05) than fresh white grapes for the DPPH, CUPRAC and FRAP assays with the exception of the ABTS test, which gave similar activities for both varieties (P > 0.05). For processed grapes, no significant difference was recorded (P > 0.05) in the antioxidant activity tested by DPPH and CUPRAC methods for raisins of both varieties, compared to ABTS and FRAP tests which indicated a significant difference (P < 0.05) between the red and white raisins with higher levels for red raisins.
However, the antioxidant activities of homemade jams tested by DPPH, ABTS and FRAP methods were significantly higher in red jam, with the exception of CUPRAC test, where we observed similar TAC values for both jams. Furthermore, DPPH and CUPRAC tests indicated that both jam wastes preserved similar levels of antioxidant activities compared to ABTS and FRAP tests, which showed a significant difference (P < 0.05) between the two wastes with higher values in the red waste.
According to the results of identification and quantification of phenolic compounds presented in Table 3 and Fig. 2, a distinct composition in terms of individual phenolic constituents was recorded for both varieties of fresh grapes. In total, 22 compounds were identified and quantified namely: 8 flavan-3-ols, 3 flavonols and 4 phenolic acids for the white variety, while the compounds for the red variety were 7 flavan-3-ols, 4 flavonols, 4 phenolic acids and 5 anthocyanins.
List of phenolic compounds identified and quantified in red (Cardinal) and white (Sabel) grapes
List of phenolic compounds identified and quantified in red (Cardinal) and white (Sabel) grapes
FRG: Fresh Red Grape, RD: Red Dried Grape, RJ: Red Jam, FWG: Fresh white grape, WDG: White Dried Grape, WJ: White Jam. The peak no 14 is composed of two flavonols (quercetin-3-O-glucoside and quercetin-3-O-glucuronide), but only quercetin-3-O-glucuronide was quantifiable. nd: not detected for the compounds which were under detection limit. Different lowercase letters in each column represent statistically significant differences (p < 0.05). Anthocyanins were obtained in the positive ion mode ([M + H]+(m/z)).
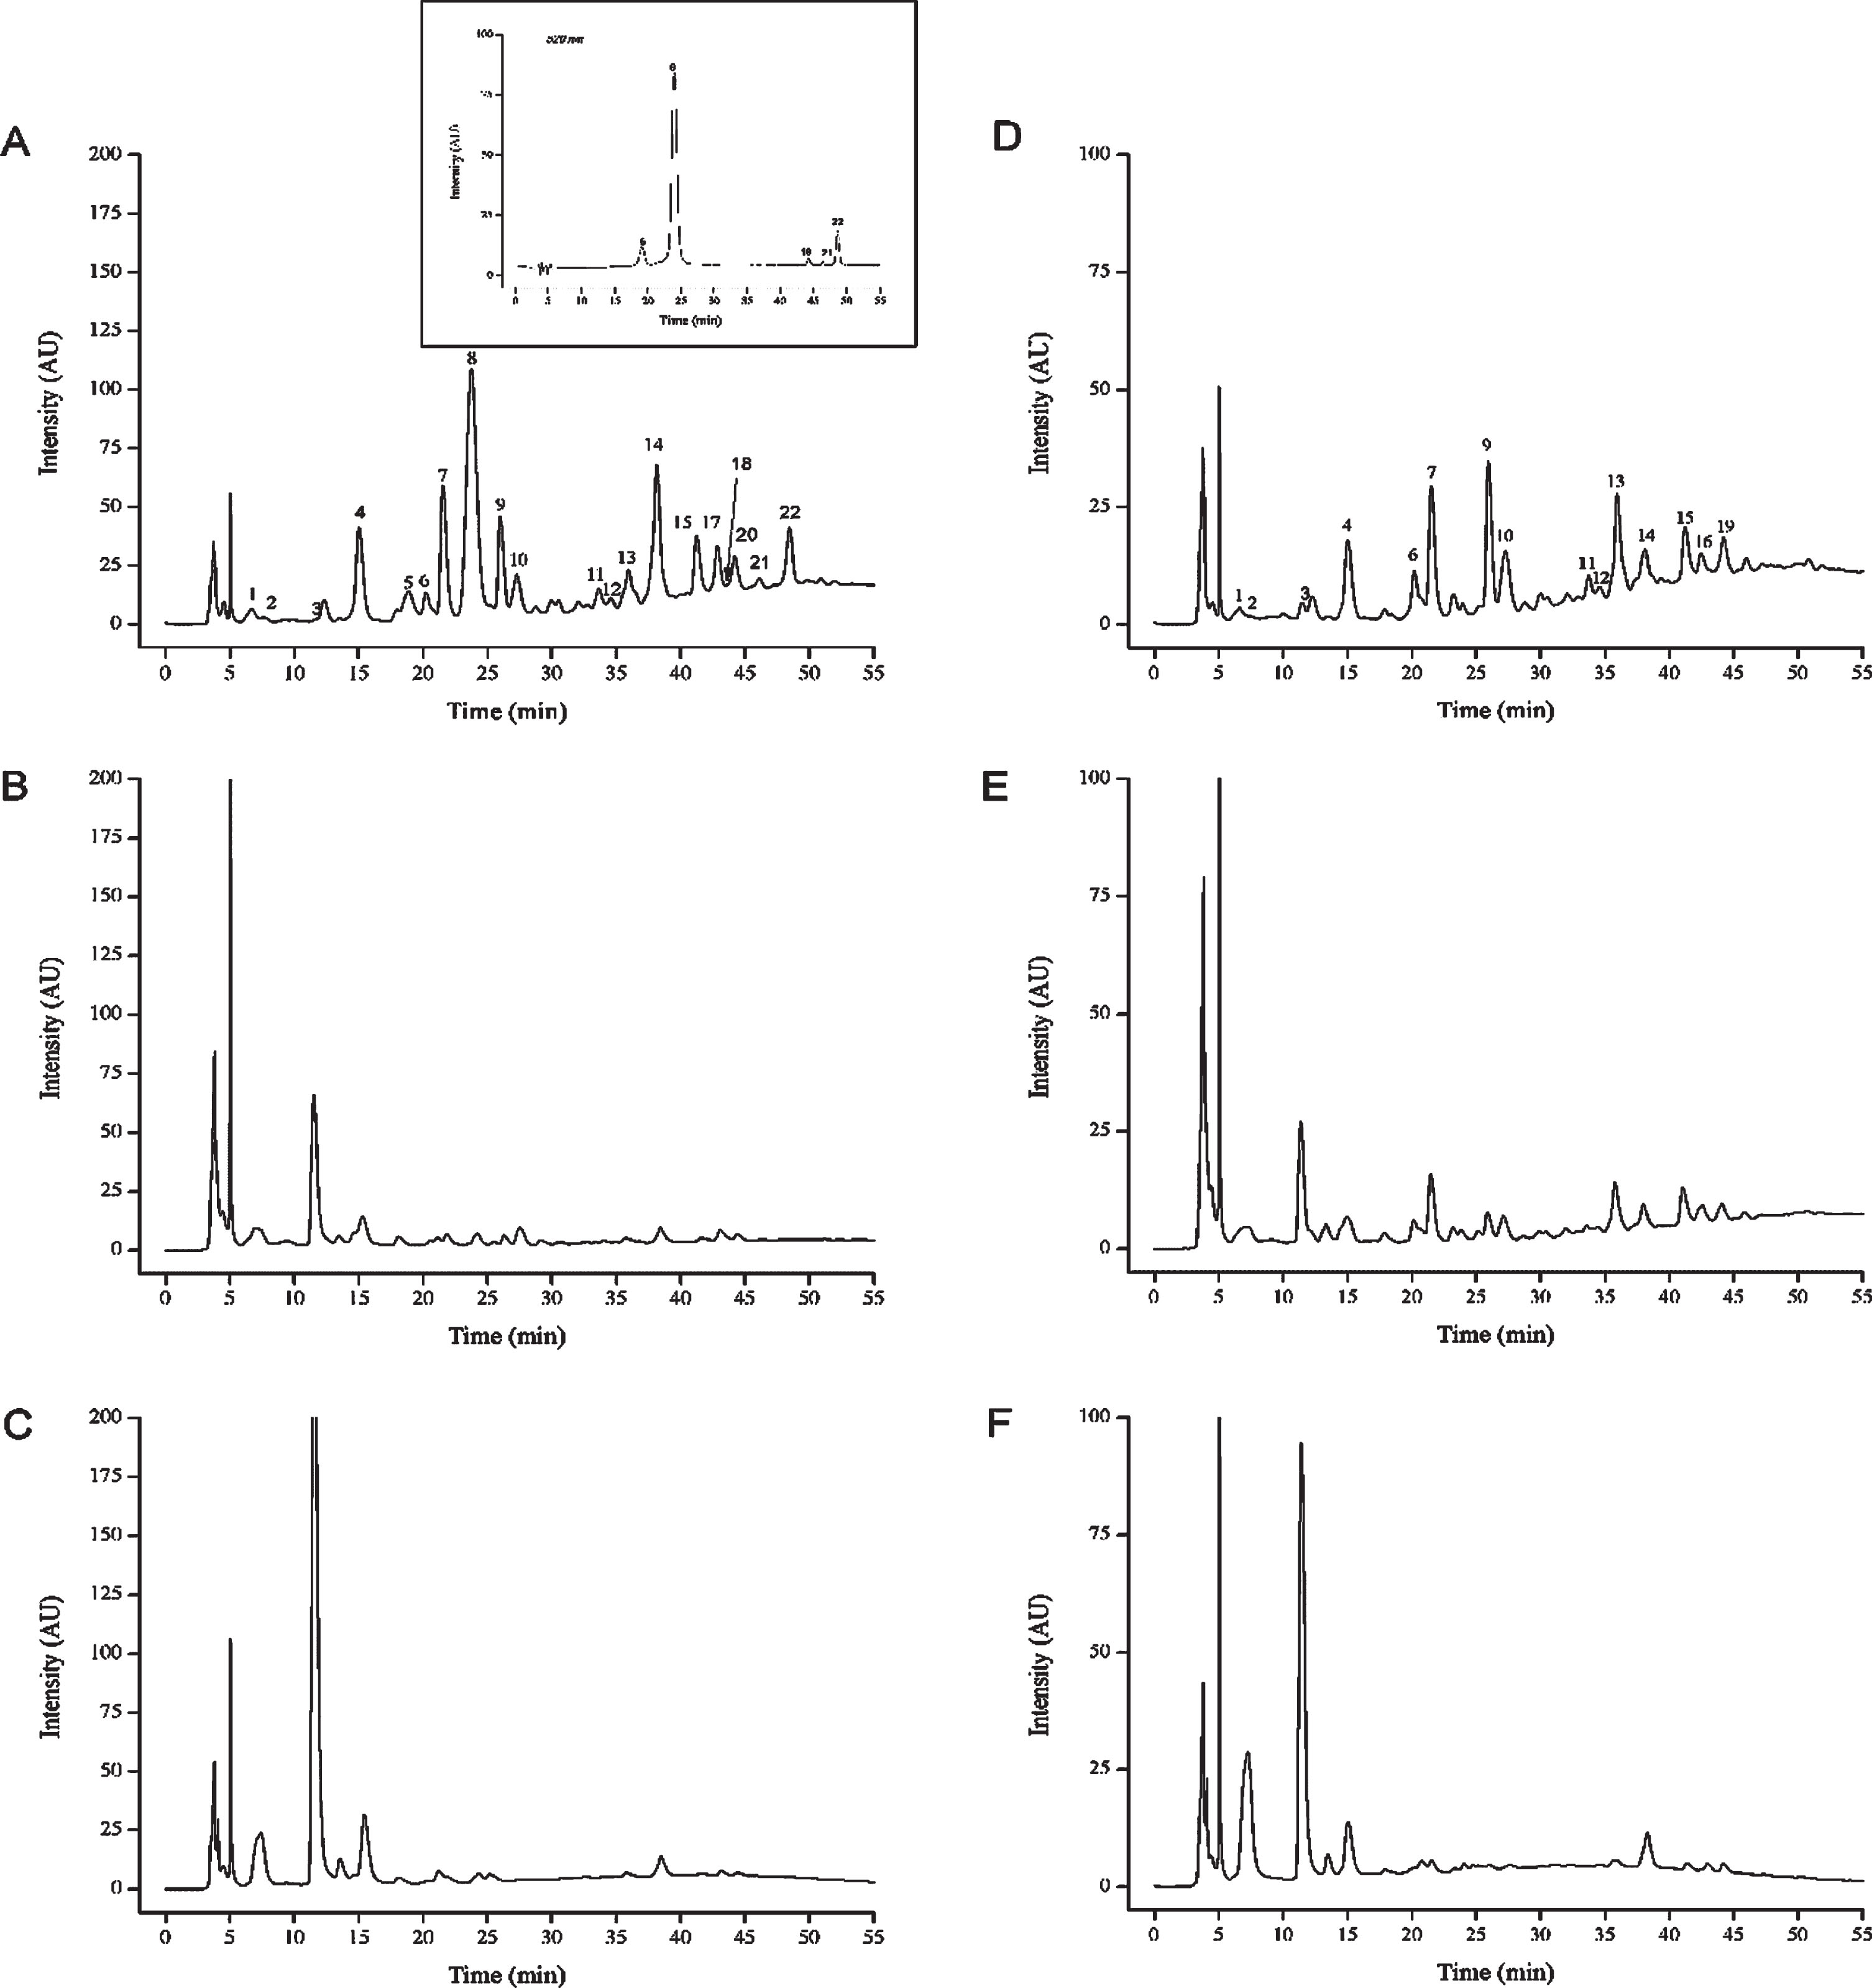
HPLC-PDA chromatograms of fresh red grape (A), red dried grape (B), red jam (C), fresh white grape (D), white dried grapes (E) and white jam (F) at 280 nm. The chromatogram inserted at 520 nm is to show the anthocyanins of fresh red grape, that were not detected after sun drying and homemade jam processes. Numbered peaks are listed in Table 3 in the same RT order.
The most abundant anthocyanin found in Cardinal variety was peonidin-3-O-glucoside followed respectively by cyanidin-3-O-glucoside, peonidin-3-O-(6”-p-coumaroyl)-glucoside, delphinidin-3-O-glucoside and petunidin-3-O-gluside.
The flavonoid profile of both varieties differed in the flavan-3-ols group with the presence of catechin-3-O-gallate only in white variety, as well as in the class of flavonols with the presence of quercetin-3-O-rhamnoside in the white variety but kaempferol-3-O-glucoside and isorhamnetin-3-O-glucoside in the red one. For the two varieties, the majority of flavonoids is predominated by flavan-3-ols monomers, where (+)-catechin was the most abundant, followed by (–)-epicatechin, their gallic esters and procyanidins dimers. The red variety seemed to have the highest amount of flavan-3-ols, in terms of total flavan-3-ols content compared to the white variety. For the group of flavonols and in terms of total amount, the red variety contained more flavonols than the white variety (38.78 vs 6.23 mg/100 g DW, respectively), with a predominance of quercetin-3-O-glucuronide, for both varieties. Regarding the phenolic acids, caftaric acid (an hydroxybenzoic acid) was the most abundant phenolic acid, followed by gallic acid and protocatechuic acid -O-hexoside, for both varieties.
Traditional drying and homemade processes caused a decrease in the amount of most phenolic compounds for both varieties. However, contents of gallic acid hexose and protocatechuic acid-hexoside were increased after both processes for red grape and only after homemade jam process for white grape.
In addition, both processes led to a total loss of anthocyanins that were not detected neither in sun-dried raisins nor in homemade jam. On one hand, the sun drying process had no significant effect (P > 0.05) on certain polyphenols of the white grape, including gallic acid hexose, protocatechuic acid-O-hexoside, epicatechin-3-O-gallate, catechin-3-O-gallate and quercetin-3-O-glucuronide. On the other hand, caftaric acid was also stable after homemade jam process for both varieties, and flavonols after homemade white grape jam process.
Changes in total phenolic and total flavonoid levels and their antioxidant activity during gastrointestinal digestion were determined by spectrophotometric analyses performed on different fractions of the digestion samples, namely; the oral or mouth fraction (MF), post gastric fraction, IN fraction (serum-available), Out fraction (colon-available) that were collected for each sample during the digestion process (Table 4).
Levels of TPC, TFC and TAC of fresh grapes and final dried grapes and jam during in vitro gastrointestinal digestion
Levels of TPC, TFC and TAC of fresh grapes and final dried grapes and jam during in vitro gastrointestinal digestion
MF: Mouth fraction, PG: Post gastric fraction, IN: Dialysable Intestinal fraction, OUT: Undialysable Instestinal Fraction. Different letters in the columns represent statistically significant differences for each assay.
TPC, TFC and TAC recoveries increased significantly for processed grapes (dried grapes and jams) compared to their intial levels, with the exception of red dried grapes and white jam, which showed similar recoveries compared to the initial state, for antioxidant activity (ABTS) and TFC, respectively. Statistical analysis revealed no significant difference (P > 0.05) between the recoveries of TPC, TFC and TAC for the two varieties in the initial state (prior to digestion).
With respect to the Sabel variety, no significant difference was recorded between sun drying and jam processing for the recoveries of TPC, TFC (except for white jam) and TAC (CUPRAC and FRAP). However, two processes were significantly different (P < 0.05) for Sabel variety, in terms of TFC recoveries and TAC values (DPPH and ABTS) for white jam except for the dried grapes and jams of both varieties in which TAC recoveries (DPPH and ABTS, respectively) were similar.
The results showed that sun drying and jam processing of both varieties caused significant losses in TPC, TFC TFC as well as TAC. These results are consistent with those reported by Panceri et al. [25], who found a decrease in the levels of phenolic compounds at the end of drying for Cabernet Sauvignon and Merlot varieties. Capanoglu et al. [16] also reported a considerable loss in phenolics during the processing of grape juice concentrate.
Phenolic compounds are mainly located in the skin and are well preserved from the oxidation in the intact vacuole. However, drying conditions are able to produce a significant damage in the membrane of the tissue which leads to the exposure of phenolic compounds to oxygen and oxidation enzymes such as polyphenol oxidase (PPO). This may cause significant losses in phenolic compounds [26]. In addition, the decrease in phenolic compounds can be related also to non-enzymatic browning reactions such as Maillard reaction which occurs slowly at room temperature causing browning of dried grapes [27].
On the other hand, drying did not only cause losses in some phenolic compounds but also caused conversion to some other compounds [28]. The combination of HPLC-DAD and MS-QTOF led to a good characterization for both grape varieties after separation and identification of a wide range of different phenolic compounds, 17 of which were non-coloured phenolics and 5 were anthocyanins, which are specific to the red variety. The method allowed the characterization of glycosylated derivatives, gallate ester of certain phenolic compounds, such as protocatechuic acid hexoside, gallic acid hexose, catechin-gallate, epicatechin-gallate and anthocyanin glucoside. These results were in agreement with previous studies on different varieties of Vitis vinifera.
Regarding phenolic acids, a common composition for both varieties was recorded with some hydroxybenzoic acids, including gallic acid, gallic acid hexose, protocatechuic-O-hexoside and caftaric acid. This was also reported by several authors studying different cultivars of Vitis Vinifira [32, 34].
For the flavonoids, all the compounds identified in both varieties and their order of elution was in agreement with those found in the literature [29, 30]. The differences observed in the flavan-3-ols and flavonols between the two varieties may be attributed to environmental conditions and varietal influence, since these factors determine the flavanol biosynthesis, concentration, distribution and accumulation of polyphenols in grapes [35, 36].
Qualitatively and quantitatively, the red variety contained significantly more phenolic compounds than the white variety (P < 0.05). This is mainly due to the anthocyanins and flavonols. These results are in accordance with previous studies reporting that the type and content of some flavonols, such as quercetin and kaempferol derivatives, were more variable in red-skinned than in white or pink grapes [37, 34].
In regard to the effect of both sun drying and homemade jam processes on individual phenolic compounds, the results showed significant losses (up to 99.9%) for all anthocyanins. This confirmed the sensitivity of anthocyanins toward thermal traditional processing (sun drying carried out at 40– 48°C during 3 weeks and cooking at 90– 100°C). These results are in agreement with those reported by Mencarelli et al. [38] who found a decrease in anthocyanins after dehydration of Aleatico grapes at 30°C. On the other hand, Çoklar and M. Akbulut [39] showed a considerable degradation of anthocyanins after sun drying of the black grape (Ekşikara) variety. Similarly, Ozela et al., Rhim, and Cemeroglu et al. [40, 42] reported an increase in the degradation of anthocyanin pigment during jam processing in the presence of light with increased temperature and longer heating times.
For the flavonoids, the flavanols-3-ol in both varieties (except (–)-epicatechin-3-O-gallate) decreased by 62% and 84% after obtaining white and red sun-dried raisins, respectively, and by 94% and 96% for white and red grape jam, respectively. These results are in agreement with those expressed in the literature for other grapes [43].
In addition, the statistical analysis revealed a highly significant difference (P < 0.05) for all flavonols of the Cardinal variety after sun-drying and homemade jam processes which caused considerable losses for these compounds. This may be due to the effect of temperature on these heat-labile compounds [38]. The flavonols of Sabel variety presented a variable behavior with respect to both traditional processes with a significant decrease in the amount of quercetin-3-rutinoside and quercetin-3-rhamnoside under the effect of sun-drying unlike quercetin-3-O-glucuronide, which remained stable. The stability of these three flavonols after homemade jam process can be attributed to polyphenol oxidase inactivation and/or the added sugars protecting flavonols during the cooking process [44].
Among phenolic acids, only gallic acid became non-detectable after both traditional processes for the two varieties. These results are in agreement with those of Panceri et al. [25] who studied dehydration process on phenolic compounds of Merlot grapes. On the other hand, caftaric acid was decreased by 64% and 96% in red and white dried raisins, respectively, but this acid remained stable after homemade jam processes for both varieties.
An increase of 98-99% only in the amount of gallic acid hexose and protocatechuic acid hexoside in red sun-dried raisins and homemade jam was observed. For the white variety, homemade jam process led to an increase of 92% and 79% in the amount of gallic acid hexose and protocatechuic acid-O-hexoside, respectively. These results are consistent with those published by Fabani et al. [11] who studied the production of raisins from white varieties: ‘Arizul’, ‘Sultanina and ‘Superior’; red variety: ‘Flame’. Several authors reported that the increase in the content of individual phenolics during drying process is mainly due to the concentration effect (by the loss in the moisture content) and /or the cultivar [11, 46].
In general, traditional sun drying and homemade jam processes had variable effects on the phenolics compounds of both varieties. This can be related to the cultivar itself and/or drying conditions that were carried out in different periods and durations. On the other hand, the decrease in the phenolic compounds in the homemade jam process may be related not only to the oxidation and thermal degradation, but also to the losses appeared during the removal of the skin and seeds, which are known to contain high amounts of these compounds [47].
Regarding the TAC evaluated by four different tests (DPPH, CUPRAC, ABTS and FRAP), the fresh grapes presented the greatest TAC, in the order of CUPRAC>DPPH>ABTS>FRAP, for the two varieties, followed by jam wastes, raisins and finally jams, with the lowest antioxidant activity. The results were in agreement with those reported by El-kassas et al. [48], who studied two Egyptian varieties of seedless grapes.
The pearson’s correlation was significantly high (P > 0.05) between TPC, TFC and the TAC for both varieties, as well as between the monomeric anthocyanins and the TAC of the red grape variety. These results are in agreement with those reported by Panceri et al. [25]. However, our findings do not match with the results proclaimed by Fabani et al. [11] for raisins, by Moreno-Montoro et al. [49] for Spanish commercial juices and by Iacopini et al. [50] for the skin and seed of Vitis Vinifera varieties who indicated that the antioxidant activity could not be predicted only by the levels of bioactive compounds because it also depends on several other factors.
The effect of in vitro gastrointestinal (GI) digestion was also studied for the two grape varieties (Cardinal and Sabel) and their products (sun-dried grapes and jams). Cilla et al. [14] reported that bioaccessibility after food processing would better be determined because it can either increase or decrease the bioavailability of nutrients and bioactive compounds. Our results showed that bioaccessibility recoveries of TPC, TFC and TAC significantly increased compared to the fresh matrices. Our results are consistent with those of Zhyang et al. [51] for grape juice; Guldiken et al. [52], for dried red beetroot and jam flavonoids and TAC; as well as the values for the total antioxidant capacity of black carrot and marmalade jam reported by Kamiloglu et al. [53]. The increase in the recoveries has been explained by the fact that heat treatments (cooking and other treatment methods) destroy the integrity of the cell wall and membrane of organelles preserving bioactive compounds in a manner that facilitate and have a more efficient functioning of digestion enzymes in the release of bioactive compounds [54]. On the other hand, the positive effect of the processes on the bioaccessibility of TPC, TFC, and TAC has been previously explained by the improvement of phenolic compounds’ extractability by high temperatures [14]. However, [51, 55] reported a negative effect on the in vitro bioaccessibility of total phenolics and total antioxidant capacity in pickled red beetroot, plum and cabbage, respectively.
Although a significant increase in the bioaccesibility recoveries of TPC, TFC and TAC were recorded in processed grapes, this improvement compared to fresh matrices can not be linked exclusively to the positive effects of traditional drying and jam processes, considering that factors governing the bioaccessibility of bioactive compounds are not only the vegetable source and the domestic or industrial processes but also the structure and composition of the food matrices [56, 57].
In addition, it should be taken into account that the effect of processing on the bioaccessibility of bioactive compounds depends on several factors including the type of processing, type of bioactive compounds, and the presence of components that may affect absorption efficiency [58]. Morever, despite the increase in the bioaccessibility recoveries, it should be highlighted that the absorption of micronutrients and other bioactive components can not be considered as completely ingested as a relative percentage of the amount ingested remains unabsorbed [59, 60].
During GI digestion, the bioaccessibility recoveries of TAC evaluated by CUPRAC and FRAP methods was positively affected for both traditional dried grapes and jams without any significant difference between the two treatments (P > 0.05), while DPPH and ABTS methods showed a significant difference (P < 0.05) between the two treatments. However, contradictory results were reported by Tomas et al. of [61] who reported different recoveries of TAC without any statistically significant difference between fresh black mulberry and its juice.
In fact, the study of the bioaccessibility by in vitro models may not thoroughly reflect the in vivo situation. Thus, standardization and improvement of these in vitro methods are required. It is also important that before drawing any conclusions or validating any information on the results obtained by a single in vitro digestion model, the passage through the adaptation and validation of the latter compared to in vivo studies is an imperative and essential step.
Conclusion
Despite the concentration of certain phenolic acids (gallic acid hexose and protocatechuic acid hexoside) in both raisins and jams, the results indicated that both sun drying and homemade jam processes) had more or less negative impacts in terms of the content of some bioactive compounds and their antioxidant activity, since potential losses in most compounds were observed. The losses in phenolic compounds or antioxidant activity in jams could be avoided when the skin and seed elimination step is modified/eliminated during processing since considerable quantities of these compounds with a good antioxidant activity are lost in the waste.
In terms of bioaccessibility, both treatments showed a positive effect by increasing the recoveries. However, further studies are still necessary in order to elucidate the fate of phenolic compounds and antioxidants during the digestion process, which determines their bioaccessibility, bioavailability, and bioactivity. In future studies, in vitro fermentation, in vivo tests and in vitro cellular models such as Caco-2, could also be carried out in order to support the findings of the present study.
In this perspective, the present study can be carried further to consider traditional raisins and homemade jams as good sources of natural antioxidants while trying to modify and improve the critical steps of different processes that can negatively affect the antioxidant properties.
Conflict of Interest
The authors have no conflict of interest to report.
Funding
The authors report no funding.
Footnotes
Acknowledgements
The authors are grateful for the Algerian Ministry of higher education and INATAA institute for the financial support.