



Abstract
BACKGROUND:
The Berberis microphylla (calafate) is an evergreen shrub considered a non-timber product from the Patagonian forest, relevant for the diversification of agrifood production, particularly interesting since its black–blue fruits are extremely rich in phenolic compounds.
OBJECTIVE:
The main objectives were to: (1) quantify the variability of fruit traits, anthocyanin content, efficiency of the reproductive shoots and leaf nutrient content within the set of 34 B. microphylla wild accessions from Tierra del Fuego Island, Argentina, (2) calculate the coefficients of correlation between variables and (3) detect relationships between the genotypes.
METHODS:
Plants growing near Ushuaia city (n = 12), bordering Fagnano lake (n = 12) and central area of the Tierra del Fuego Island (n = 10) were selected.
RESULTS:
A significant variability in fruit traits, anthocyanin content and the efficiency of reproductive shoots among and within the three populations was assessed, a result with great relevance for breeding purposes. Phenotypic plasticity was related with the environmental conditions, i.e. air temperatures for each population during the three monitored growing seasons.
CONCLUSIONS:
Overall, results indicate that yearly environmental factors play a relevant role in phenotypic variation of both individual plants and populations, thus confirming the complexity of wild species evolution and domestication processes.
Introduction
The conservation of genetic resources has received increasing attention over the last decades. Therefore, the estimation of plant diversity is crucial for preservation and breeding programs. The availability and informative value of plant germplasm are becoming more and more critical for the future use of sustainable genetic resources [1].
Proper domestication requires the identification of relevant traits for the intended use that can be further improved through selection. The selection depends largely on phenotypic variations that occur among the populations. Variation is defined as the occurrence of differences among individuals of the same species, attributable to their genetic composition or their growth environment. Thus, understanding of species variation at provenance level is a required starting input for any domestication and/or breeding program [2]. In situ methods are foreseen as the main component of conservation strategies and the first step in avoiding the disappearance of these genes from various growing and cultivation zones [1].
Latin America is home to dramatically diverse agroecological regions that harbor a high concentration of underutilized plant species. Most of these fruit species’ genetic resources hold the potential to contribute to challenges such as sustainable agricultural development, food security and sovereignty, and climate change [3]. Also, wild species (which include those used as food directly or as well as wider biodiversity that supports ecosystem services) give the resilience for the food production systems in the face of global change [4].
Berberis microphylla G. Forst. (calafate) is an evergreen and spiny shrub, with a reproductive pattern based on seedling recruitment and clonal development by rhizomes [5]. It often grows in differentiated environments in Tierra del Fuego such as coastal scrubs, Nothofagus forest margins and clearings, wetland areas in grass steppes, and along streams and rivers [6]. It is considered a minor or underutilized fruit tree species but it is important for diversification of agrifood production. Also, it is classified as a non-timber forest product [7], since its black–blue fruits are rich in phenolic compounds [8–12] and can be consumed fresh and processed in marmalades and jams, in non-alcoholic beverages and ice creams. Commercial barberry orchards are being planned due to their economic potential related to fruit flavor, taste and nutraceutical properties. Local rural pop-ulations also use this species as fuelwood [13]. Some aspects of the phenological phases, leaf nutrient and pigment contents, flower anatomy, fruit composition, production and postharvest, and the annual cycle as well as vegetative morphological variations were previously studied in natural populations of this species [14–27].
Since fruit trait characterization continues to be the first step for the description and classification of germplasm, some characteristics among B. microphylla accessions from the Magellan’s region were studied. Thus, the phenotypic diversity for functional purposes, such as phenological stages, fruit yield, fruit size, fruit seed and total anthocyanin concentration were evaluated [28]. Besides, shrub growing characteristics and microclimatic conditions, floral traits and reproductive success, reproductive shoots concerning the floral bud development and the fruit set are considered important traits for the variability assessment among B. microphylla accessions from Tierra del Fuego [24, 29], as well as genetic diversity [30]. However, variability in fruit traits and anthocyanin content among and within populations of B. microphylla in Tierra del Fuego has not been previously evaluated.
The main objectives of the current study were to: (1) quantify and characterize the variability of fruit traits, anthocyanin content, efficiency of the shoots and leaf nutrient content within a set of 34 wild Berberis microphylla G. Forst. accessions from Tierra del Fuego island, (2) calculate the coefficients of correlation between studied variables and (3) detect relationships between the genotypes.
Materials and methods
Plant material and growing conditions
Wild Berberis microphylla G. Forst. plants growing near Ushuaia city (US) (plants identified as 109; 110; 111; 121; 122; 123; 124; 125; 126; 149; 200, and 202), bordering Fagnano lake (FL) (plants identified as 81; 82; 83; 84; 85; 86; 87; 146; 148; 172; 183, and 184) and in the central area of the Tierra del Fuego island (CI) (plants identified as 72; 73; 74; 77; 78; 150; 171; 180; 181, and 182) were selected in 2014. Geographical position and shrub characteristics were described in a previous work by Arena et al. [29]. Daily air temperatures, environmental relative humidity and cumulative rainfall were also recorded on every site from October to March for 2014-2015, 2015-2016 and 2016-2017 growing seasons.
Sampling and measurements
Fruit traits
Three samples of 25–50 fruits each were hand-harvested from each shrub (34 total shrubs) at 98 days from full flower phenological phase in February 2015, 2016 and 2017. The following parameters were evaluated in twelve fruits (four from each sample): fruit fresh weight (using an Ohaus Pioneer PX 0.001 g precision balance), fruit dry weight (fruits were dried in an oven at 50°C for 7 to 10 days until constant weight), fruit dry weight as percentage of fresh weight (dry matter), fruit equatorial and polar diameters (using a digital caliper Mitutoyo Model 500-196 (0 to 6"/0 to 150 mm measuring range, 0.0005"/0.01 mm resolution), seed number, seed dry weight and seed dry weight/fruit dry weight.
Anthocyanin content
Anthocyanin quantitation (n = 3) was performed by the pH differential method of Giusti and Wrolstad [31]. Samples (5 g) of frozen fruit were extracted for 24 h in 50 ml 0.1%HCl–MeOH solution at 4°C. Then, aliquots were diluted from 1:5 to 1:80 with either a 0.025 M KCl (pH 1.0) or 0.4 M sodium acetate (pH 4.5) buffer. The absorbance of the solutions was measured at 510 and 700 nm with a Shimadzu 1203 UV–vis. Spectrophotometer (Shimadzu Corporation, Japan). Anthocyanin content was calculated by using a molar extinction coefficient of 26,900 L mol–1 cm–1 and a molecular weight of 449.2 for cyanidin 3-glucoside. Values were expressed in mg 100 g–1 on fresh weight basis.
Efficiency of reproductive shoots and leaf nutrient content
Eight one-year-old shoots in spring of 2014, 2015 and 2016 from the North, East, South and West orientations (two shoots from each direction) were randomly selected of each plant. The following parameters were measured and/or calculated: shoot length, fruit number/shoot, fruit number/shoot length, fruit fresh weight/shoot length and fruit dry weight/shoot length. The leaves from 2016 shoots were taken in February 2017 and used for the total leaf organic carbon (considered as half of the ash-free dry mass that is the total organic matter) [32], total leaf nitrogen by a standard Kjeldahl acid-digestion procedure [33], and the total leaf carbon/nitrogen relation.
Statistical analysis
Data for each population and each growing season were analyzed by ANOVA and Tukey Test (p < 0.05). Correlations between the variables fruit-fruit, fruit-leaf nutrient, flower-leaf nutrient, and flower-fruit were also made. For the flower variables, parameters previously published by Arena et al. [29] such as: flower dry weight, gynoecium area, pollen grain number, ovule number, pollen grain number/ovule number ratio and pollen grain size were used.
A Principal Component Analysis (PCA) was conducted using ClustVis (BIIT Research Group, https://biit.cs.ut.ee/) [34] to explore multivariate relations between all plants of each population at the three growing seasons. The following ten variables were evaluated: fruit fresh weight, fruit dry weight, fruit dry weight as percentage of fruit fresh weight, fruit equatorial diameter, fruit polar diameter, seed number, seed dry weight, seed dry weight/fruit dry weight, fruit fresh weight/shoot length and anthocyanin content. Also, using 1 to 3 rating scales, additional plant variables previously reported by Arena et al. [29] were used as explanatory variables:
Proximity to other plants (PR; relative values where highest values mean highest proximity) where 1 = 0.25 to 0.65; 2 = 0.66 to 1.05; 3 > 1.05.
Shade percentage (SD; %) where 1 = 0.00 to 30.00; 2 = 31.00 to 60.00; 3 > 60.00.
Plant height (H; m) where 1 < 1.45; 2 = 1.46 to 1.95; 3 > 1.95).
Maximum plant diameter (MD; m) where 1 < 3.9; 2 = 3.9 to 6.2; 3 > 6.2.
Productive area (PA; %) where 1 < 35.0; 2 = 35.0 to 60.0; 3 > 60.0.
Total leaf carbon (C; %) where 1 < 43.9; 2 = 43.9 to 46.2; 3 > 46.2.
Total leaf nitrogen (N; %) where 1 < 1.52; 2 = 1.52 to 1.80; 3 > 1.80.
A heatmap for the three growing seasons was also generated using ClustVis, adopting the same variables above mentioned and defining sample groups related to N, C, PA, MD, H, SD, PR, and Year.
Results
Growing conditions
On average, in the 2014-2015 and 2015-2016 growing seasons, from October to March, the FL site presented higher temperatures (8.6°C and 8.1°C, respectively) compared to the CI (8.0°C for 2014-2015 and 2015-2016 growing seasons) and the US sites (8.1 and 7.9°C for 2014-2015 and 2015-2016 growing seasons, respectively) (Table 1). Also, average temperatures in the 2016-2017 growing season, from October to March, in the three sites were higher (8.7°C) than in the 2014-2015 and 2015-2016 growing seasons (8.2°C and 8.0°C, respectively). The warmest month in the three sites was January for the 2014-2015 and 2015-2016 growing seasons, while in 2016-2017 growing season, the warmest month was February, with daily air temperatures of 10.7, 11.2 and 9.8°C for the US, FL and CI sites, respectively. Accumulated rainfalls from October to March were higher in the US site (280.7, 240.9, and 235.4 mm for 2014-2015, 2015-2016 and 2016-2017, respectively) than in the FL (172.7, 104.4 and 130.4, mm, respectively) and in the CI sites (75.4, 127.6, and 122.2, respectively).
Averages for daily air temperatures (T;°C), environmental relative humidity (RH; %) and cumulative rainfall (R; mm) from October to March during the 2014–2015, 2015–2016 and 2016–2017 growing seasons recorded on the sites of Ushuaia, Fagnano Lake and central area of the Tierra del Fuego island
Averages for daily air temperatures (T;°C), environmental relative humidity (RH; %) and cumulative rainfall (R; mm) from October to March during the 2014–2015, 2015–2016 and 2016–2017 growing seasons recorded on the sites of Ushuaia, Fagnano Lake and central area of the Tierra del Fuego island
Data of Ushuaia were recorded by a Meteorological Station located at the Centro Austral de Investigaciones Científicas (CONICET, Argentina); data of the Fagnano Lake and central area of the Tierra del Fuego island were recorded by a Meteorological Station located on both sites by Tierra del Fuego province.
Population significantly affected fruit fresh weight, fruit dry weight, fruit dry weight as percentage of fruit fresh weight, fruit equatorial diameter, seed number, seed dry weight, seed dry weight/fruit dry weight, and anthocyanin content (Table 2). Fruit dry weight (108.2 mg), fruit equatorial diameter (8.7 mm), seed number (6.4), and seed dry weight (50.8 mg), from FL fruits were significantly higher than in Cl and US fruits. However, fruit fresh weight (353.5 mg), fruit dry weight as percentage of fruit fresh weight (31.3%), and seed dry weight/fruit dry weight (0.49) of FL fruits were only significantly higher than US fruits, while anthocyanin content from FL fruits (474.5 mg 100 g–1) was only significantly higher than CI fruits.
ANOVA for fruit fresh weight (FFW; mg), fruit dry weight (FDW; mg), fruit dry weight as percentage of fresh fruit weight (FDW%), fruit equatorial diameter (FED; mm), fruit polar diameter (FPD; mm), seed number (SN; n), seed dry weight (SDW; mg), seed dry weight/ fruit dry weight (SDW/FDW), and anthocyanin concentration (mg cyanidin-3-glucoside 100 g–1 fruit fresh weight) (A) for plants grown in Ushuaia (US), Fagnano Lake (FL) and central area of the Tierra del Fuego island (CI) populations (P) with 2014–2015, 2015–2016 and 2016–2017 growing seasons (GS) as main factors
ANOVA for fruit fresh weight (FFW; mg), fruit dry weight (FDW; mg), fruit dry weight as percentage of fresh fruit weight (FDW%), fruit equatorial diameter (FED; mm), fruit polar diameter (FPD; mm), seed number (SN; n), seed dry weight (SDW; mg), seed dry weight/ fruit dry weight (SDW/FDW), and anthocyanin concentration (mg cyanidin-3-glucoside 100 g–1 fruit fresh weight) (A) for plants grown in Ushuaia (US), Fagnano Lake (FL) and central area of the Tierra del Fuego island (CI) populations (P) with 2014–2015, 2015–2016 and 2016–2017 growing seasons (GS) as main factors
F = Fisher test; p = significance. Different letters at each column indicate significant differences at p < 0.05 using Tukey test.
Growing season significantly affected fruit fresh weight, fruit dry weight, fruit equatorial and polar diameter, seed dry weight/fruit dry weight, and anthocyanin content (Table 2). Fruit fresh and dry weights in 2016-2017 were significantly higher (371.1 and 106.8 mg, respectively) than in 2015-2016 (314.9 and 88.8 mg, respectively) and 2014-2015 (313.3 and 91.8 mg, respectively). The fruit equatorial diameter in 2016-2017 was significantly higher (8.9 mm) than in the remaining seasons (8.1 and 8.4 mm, respectively). However, seed dry weight/fruit dry weight was lower in 2016-2017 (0.4) compared to 2015-2016 and 2014-2015 (0.5 for both growing seasons). Anthocyanin content was higher in 2016-2017 (595 mg 100 g–1) than in 2015-2016 and 2014-2015 (350 and 405 mg 100 g–1, respectively).
Significant interactions were found between factors for most of the variables. Indeed, differential increments were verified in values between the main factors and combinations (Tables 2, 3). Differences in fruit fresh weight among sites were dependent on the growing season (Fig. 1A). FL fruits presented the highest seed dry weight, although, in 2016-2017 the seed dry weight was comparable to CI fruits (Fig. 1B). Differences in anthocyanin content among sites were also dependent on the growing season (Fig. 1C).
ANOVA for fruit fresh weight (FFW; mg), fruit dry weight (FDW; mg), fruit dry weight as percentage of fruit fresh weight (FDW%), fruit equatorial diameter (FED; mm), fruit polar diameter (FPD; mm), seed number (SN; n), seed dry weight (SDW; mg), anthocyanin concentration (mg cyanidin-3-glucoside 100 g–1 fruit fresh weight) (A) for plants grown in Ushuaia (US), Fagnano Lake (FL) and central area of the Tierra del Fuego island (CI) in 2014–2015, 2015–2016 and 2016–2017 growing seasons.
F = Fisher test; p = significance. Different letters at each column indicate significant differences at p < 0.05 using Tukey test.
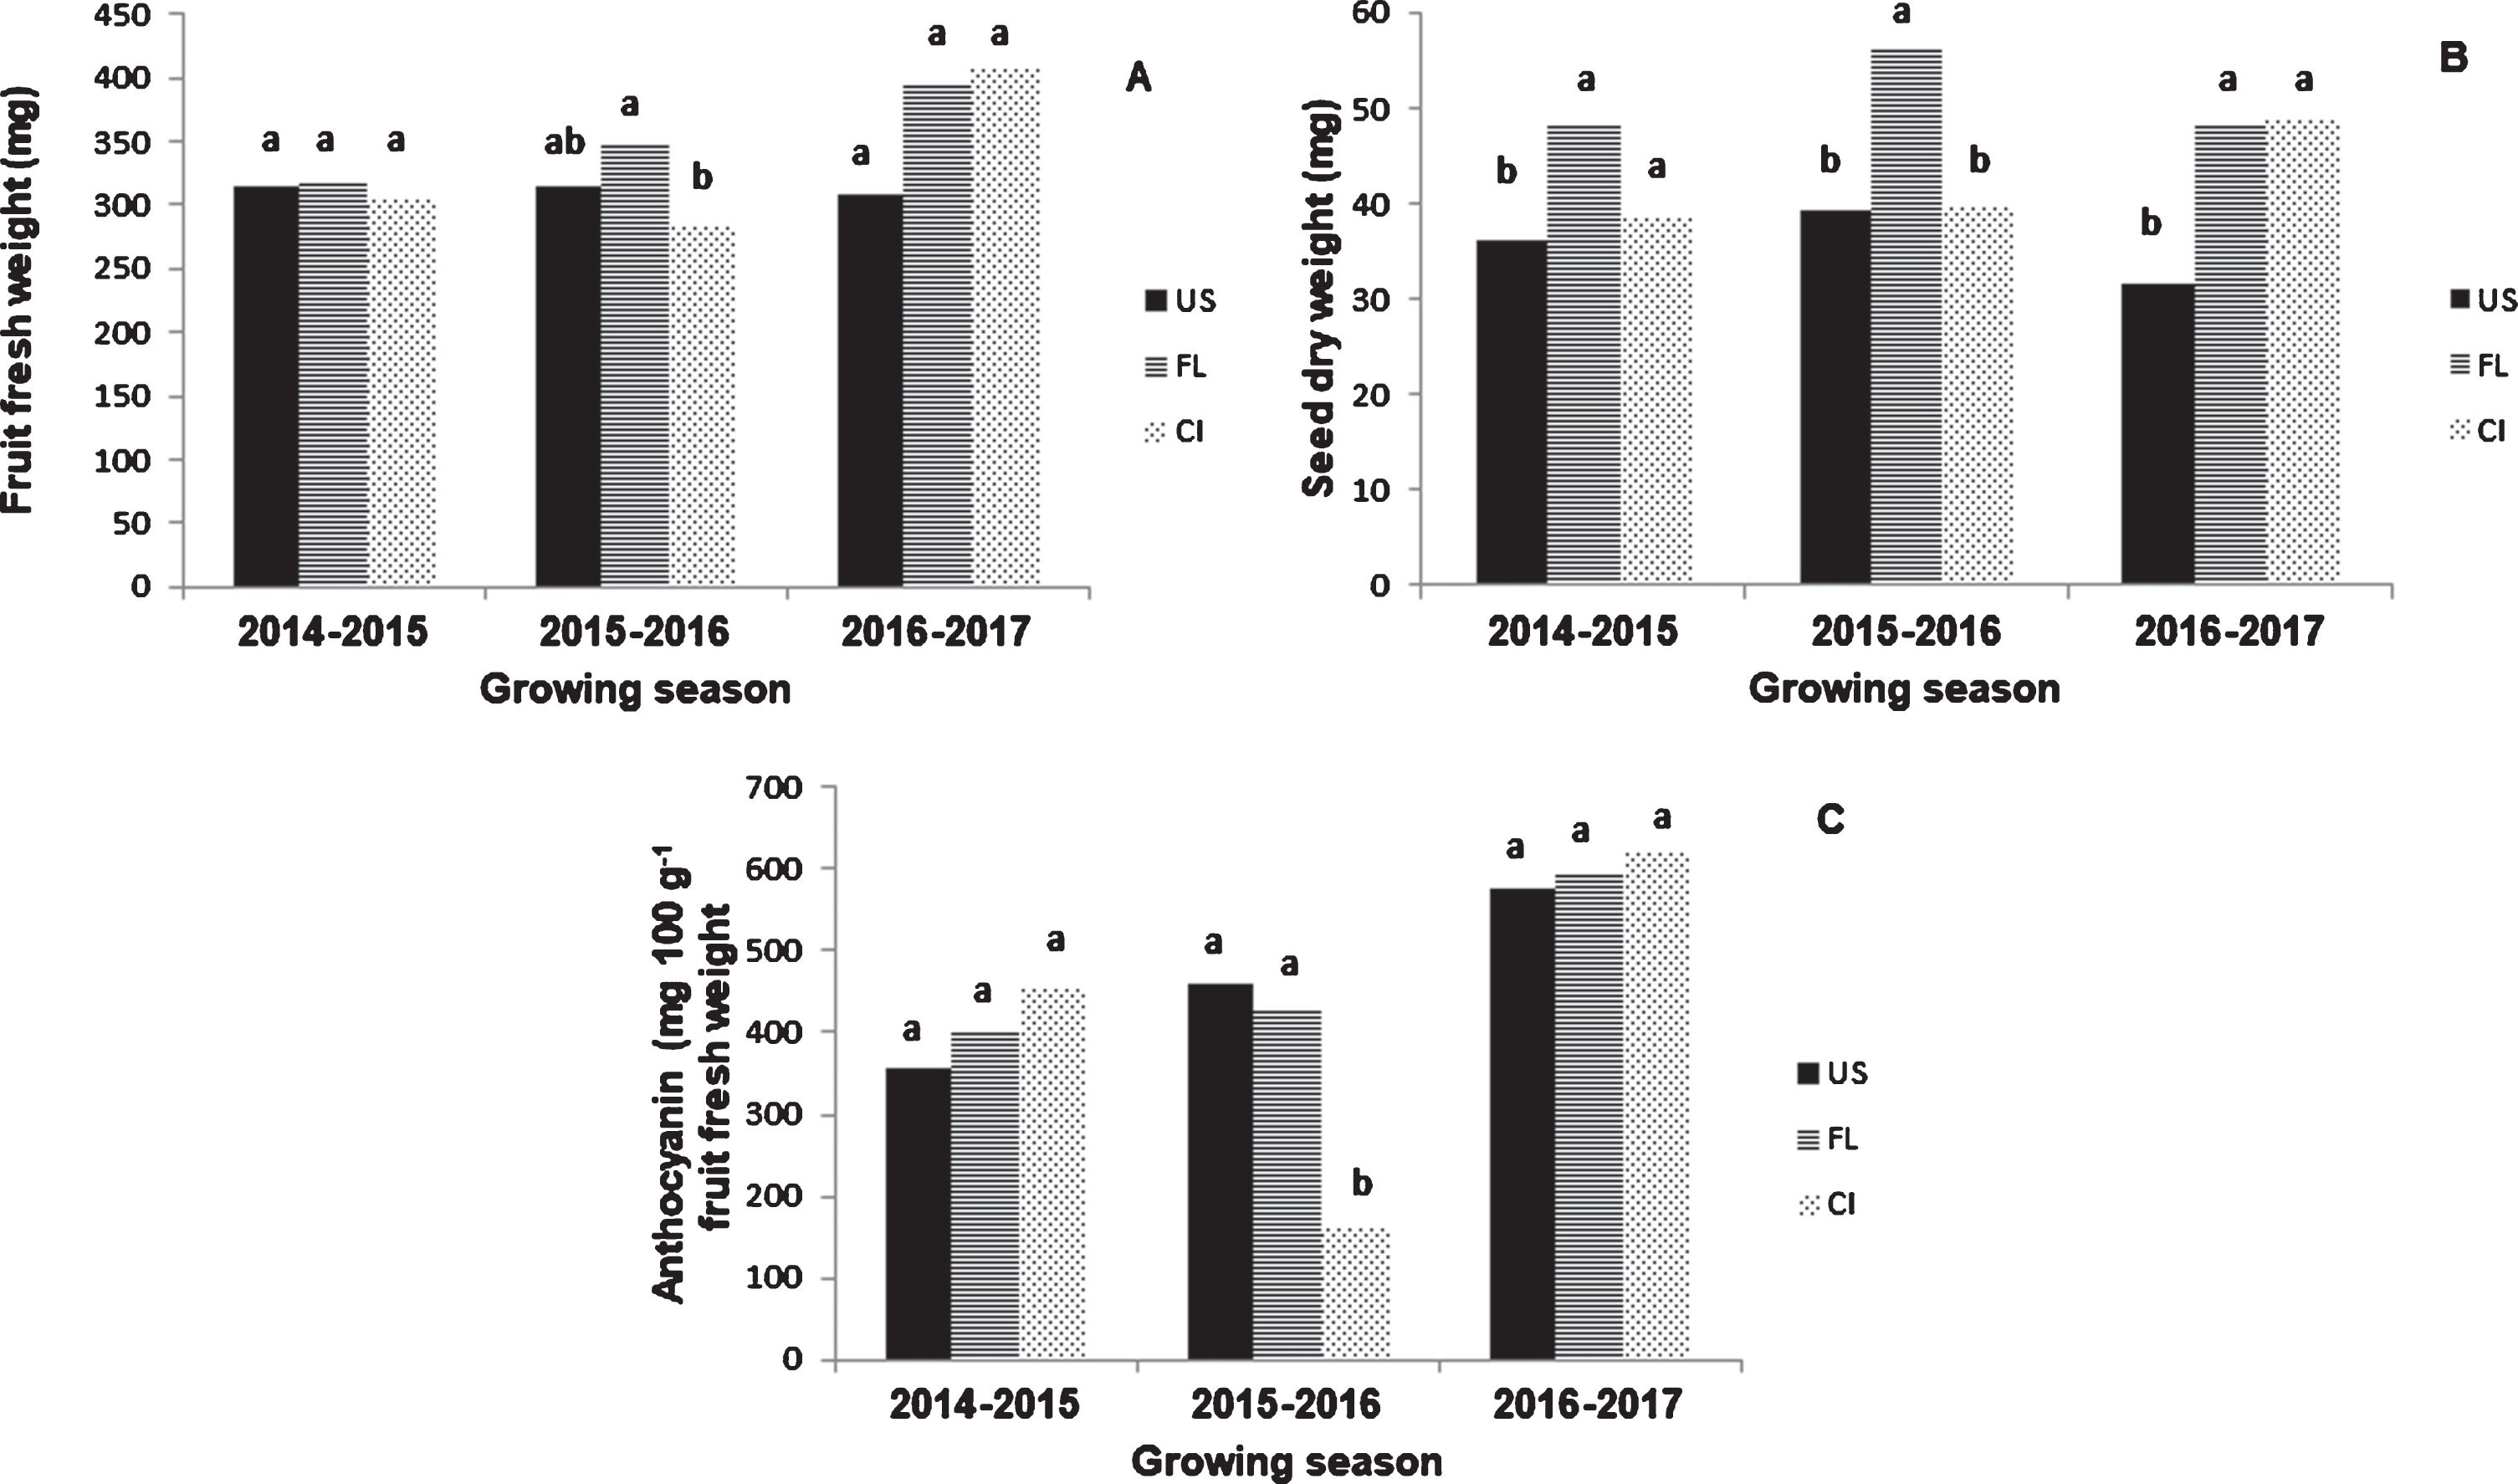
Fruit fresh weight (A), seed dry weight (B) and anthocyanin concentration (C) of barberry plants growing in Ushuaia (US), Fagnano Lake (FL) and central area of the Tierra del Fuego island (CI) during the 2014–2015, 2015–2016 and 2016–2017 growing seasons.
Seed number and seed dry weight presented the highest coefficients of variability (0.51 and 0.54, respectively). Fruit fresh and dry weights had intermediate coefficients of variability of 0.45 and 0.32, respectively. The coefficient of variability of anthocyanin content was 0.17. Fruit equatorial and polar diameters presented the lowest coefficients of variability (0.13 and 0.11, respectively).
Population significantly affected shoot length, fruit number/shoot, fruit number/shoot length, fruit fresh weight/shoot length and fruit dry weight/shoot length (Table 4). Shoot length and fruit number/shoot were significantly higher in FL (18.8 cm and 1.4 fruits, respectively) than in US and CL plants. However, fruit number/shoot length, fruit fresh weight/shoot length and fruit dry weight/shoot length of FL and CL were significantly higher than US plants.
ANOVA for shoot length (SL; cm), fruit number/shoot (FN/S), fruit number/shoot length (FN/SL; number/cm), fruit fresh weight/shoot length (FFW/SL; g/cm), fruit dry weight/shoot length (FDW/SL; g/cm), for plants grown in Ushuaia (US), Fagnano Lake (FL) and central area of the Tierra del Fuego island (CI) with 2014–2015, 2015–2016 and 2016–2017 growing seasons as main factors
ANOVA for shoot length (SL; cm), fruit number/shoot (FN/S), fruit number/shoot length (FN/SL; number/cm), fruit fresh weight/shoot length (FFW/SL; g/cm), fruit dry weight/shoot length (FDW/SL; g/cm), for plants grown in Ushuaia (US), Fagnano Lake (FL) and central area of the Tierra del Fuego island (CI) with 2014–2015, 2015–2016 and 2016–2017 growing seasons as main factors
F = Fisher test; p = significance. Different letters at each column indicate significant differences at p < 0.05 using Tukey test.
Growing season significantly affected shoot length, fruit number/shoot, fruit number/shoot length, fruit fresh weight/shoot length and fruit dry weight/shoot length (Table 4). Shoot length was higher in 2015-2016 (16.7 cm) than in 2016-2017 growing season (14.7 cm). Fruit number/shoot was higher in 2014-2015 and 2015-2016 (1.2 and 1.4 fruits, respectively) compared to 2016-2017 growing season (0.6 fruits). Besides, fruit number/shoot length in 2014-2015 and 2015-2016 were higher (0.8 fruits/cm) than in 2016-2017 growing season (0.05 fruits). Fruit fresh weight/ shoot length and fruit dry weight/ shoot length were significantly higher in 2014-2015 (25.7 and 7.4 g/cm, respectively) than in 2016-2017 growing season (14.7 and 4.1 g/cm, respectively).
Significant interactions were found between factors for fruit number/shoot, fruit number/shoot length and fruit fresh weight/shoot length. Indeed, differential increments were verified in the values between the main factors and combinations (Tables 4, 5). The FL population presented the highest fruit number/shoot length in 2014-2015 and 2015-2016, although in 2016-2017 the highest fruit number/shoot length was found for CI population (Fig. 2A). Fruit fresh weight/shoot length in FL and CL population were the highest in 2014-2015; however, the highest values in 2015-2016 were found in FL population, and 2016-2017 in CI population (Fig. 2B).
ANOVA for shoot length (SL) (cm), fruit number/shoot (FN/S), fruit number/shoot length (FN/SL) (number/cm), fruit fresh weight/shoot length (FFW/SL) (g/cm), fruit dry weight/shoot length (FDW/SL) (g/cm) for plants grown in Ushuaia (US), Fagnano Lake (FL) and central area of the Tierra del Fuego island (CI) in 2014–2015, 2015–2016 and 2016–2017 growing seasons
F = Fisher test; p = significance. Different letters at each column indicate significant differences at p < 0.05 using Tukey test.
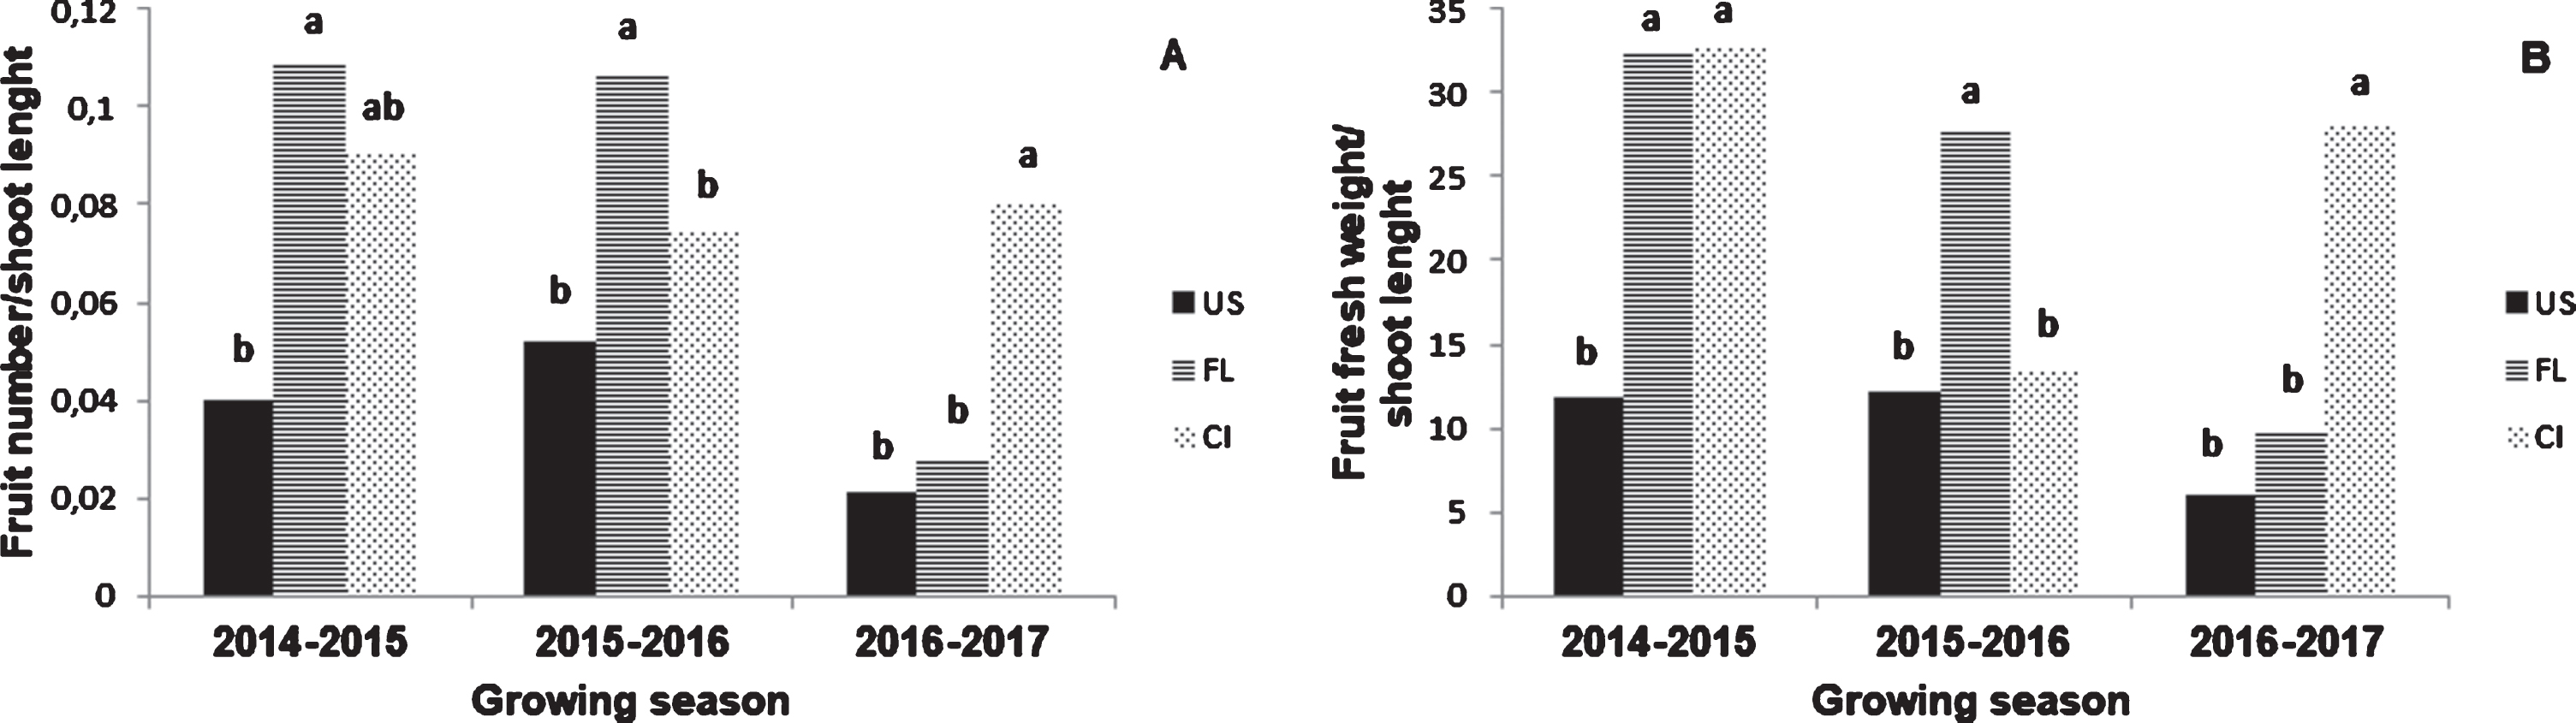
Fruit number/shoot length (A) and fruit fresh weight/shoot length of plants growing at Ushuaia (US), Fagnano Lake (FL) and central area of the Tierra del Fuego island (CI) during the 2014–2015, 2015–2016 and 2016–2017 growing seasons.
Shoot length presented the lowest coefficient of variability (0.28), while fruit number/shoot, fruit number/shoot length, fruit fresh weight/shoot length and fruit dry weight/shoot length were the variables with the highest variability (1.6 to 1.7).
Population significantly affected total leaf organic carbon and nitrogen content (Table 6). Total leaf organic carbon content was significantly higher in US (48.3%) than in Cl population (47.0%), showing the FL population an intermediate value (47.7%). Regarding total leaf nitrogen content, the highest level was observed in the Cl population (1.6%). The carbon/nitrogen ratio varied among 30.3 and 33.1, without significant differences among populations.
ANOVA for total leaf carbon concentration (C; %), total leaf nitrogen concentration (N; %) and total leaf carbon/nitrogen ratio (C/N) for plants grown in Ushuaia (US), Fagnano Lake (FL) and central area of the Tierra del Fuego island (CI) with 2014–2015, 2015–2016 and 2016–2017 growing seasons as main factors
ANOVA for total leaf carbon concentration (C; %), total leaf nitrogen concentration (N; %) and total leaf carbon/nitrogen ratio (C/N) for plants grown in Ushuaia (US), Fagnano Lake (FL) and central area of the Tierra del Fuego island (CI) with 2014–2015, 2015–2016 and 2016–2017 growing seasons as main factors
F = Fisher test; p = significance. Different letters at each column indicate significant differences at p < 0.05 using Tukey test.
Plant significantly affected fruit fresh weight, fruit dry weight, fruit equatorial and polar diameter, and seed dry weight for the three sites. However, plants only showed significant differences in fruit dry weight as a percentage of fruit fresh weight in US population, in seed number in FL and CI populations and in anthocyanin content in US and FL populations (Table 3).
Also, plant significantly affected shoot length in the three populations, while plants only showed significant differences in fruit number/shoot, fruit number/shoot length, fruit fresh weight/shoot length and fruit dry weight/shoot length in FL and CI populations (Table 5).
Plant significantly affected total leaf organic carbon concentration in US and FL populations, while total leaf nitrogen concentration and carbon/nitrogen ratio were not affected by the plant (Table 7).
ANOVA for total leaf carbon concentration (C; %), total leaf nitrogen concentration (N; %) and total leaf carbon/nitrogen ratio (C/N) for plants grown in Ushuaia (US), Fagnano Lake (FL) and central area of the Tierra del Fuego island (CI) in 2014–2015, 2015–2016 and 2016–2017 growing seasons
ANOVA for total leaf carbon concentration (C; %), total leaf nitrogen concentration (N; %) and total leaf carbon/nitrogen ratio (C/N) for plants grown in Ushuaia (US), Fagnano Lake (FL) and central area of the Tierra del Fuego island (CI) in 2014–2015, 2015–2016 and 2016–2017 growing seasons
F = Fisher test; p = significance. Different letters at each column indicate significant differences at p < 0.05 using Tukey test.
Overall, it is important to highlight the behavior of some plants in each of the populations studied. In the US population, plant 149 showed highest values in the fruit fresh weight (461.1 mg), fruit dry weight (123.1 mg), fruit equatorial diameter (9.9 mm) and seed dry weight (56.4 mg) (Table 3). The lowest seed dry weight/fruit dry weight was observed in plants 122, 125, 200 and 202. Also, plant 200 attained highest anthocyanin content (720.8 mg 100 g–1). Shoot length was highest in plant 200 (19.9 cm) (Table 5). Plant 125 presented the highest var-iability (highest coefficient of variability in 4 out of 9 variables), while plants 110 and 149 presented the lowest variability (lowest coefficient of variability in 3 out of 9 variables). Plant 110 showed the highest total leaf carbon content (48.6%), with the lowest leaf nitrogen content (1.3%) and therefore the highest carbon/nitrogen ratio (37.2%) (Table 7).
Regarding FL population, the highest fruit fresh weight was found in plant 84 (549.0 mg), while the maximum fruit dry weight in plant 184 (151.3 mg) (Table 3). Plant 184 presented the highest fruit equatorial and polar diameter (10.5 mm and 9.2 mm, respectively), while plant 148 showed the highest seed number and seed dry weight (7.7 and 65.0 mg, respectively). The lowest seed dry weight/fruit dry weight was observed in plants 87 and 184. Also, plant 172 attained the highest anthocyanin content (714.40 mg 100 g–1), which was significantly higher than in plants 81, 83, 84, 85, 86 and 148 (192.0 to 443.5 mg 100 g–1). Shoot length was highest in the plant 183 (23.9 cm) (Table 5). Fruit number/shoot and fruit number/shoot length were maxima in plant 172 (3.35 fruits and 0.2 fruit/cm). If plants 172 and 184 showed the highest fruit fresh weight/shoot length (11.2 and 45.1 g/cm, respectively) and fruit dry weight/shoot length (13.1 and 12.7 g/cm, respectively), but there were no significant differences among the plants of this population. Plant 81 presented the highest variability (highest coefficient of variability in 3 out of 9 variables), while plant 83 presented the lowest. Plant 85 showed the highest leaf carbon concentration (48.1%), with the lowest leaf nitrogen concentration (1.2%) and therefore the maximum carbon/nitrogen ratio (38.9%) (Table 7).
Finally, in CI population, the maximum fruit fresh weight was found in plant 171 (460.5 mg), while plant 73 (133.9 mg) had the highest fruit dry weight in (Table 3). Plant 171 also showed the highest fruit equatorial diameter (9.6 mm), and plant 77 the highest fruit polar diameter (9.7 mm). The highest seed number and seed dry weight was attained in plant 171 (7.3 seeds and 67.6 mg, respectively). The lowest seed dry weight/fruit dry weight was observed in plant 180. Shoot length was highest in plant 78 (18.6 cm) (Table 5). Fruit number/shoot and fruit number/shoot length were highest in plant 171 (2.3 fruits and 0.2 fruit/cm, respectively). Plant 171 also showed the highest fruit fresh and dry weight/shoot length (83.0 and 25.1 mg/cm, respectively). Plants 78 and 171 showed the highest variability (highest coefficient of variability in 3 out of 9 variables), while plants 77 and 171 had the lowest variability (lowest coefficient of variability in 3 out of 9 variables). Leaf carbon content va-ried between 48.2%(plant 181) and 41.5%(plant 180), while leaf nitrogen content varied between 2.1%(plant 73) and 1.3%(plant 180) and therefore carbon/nitrogen ratio ranged between 33.9 and 24.6%for plant 72 and 73, respectively) (Table 7).
Some correlations were found between pairs of variables with different coefficient of correlation (r), i.e. those between fruit –fruit variables like as fruit fresh and dry weight with seed number (r = 0.647; p = 0.001 and r = 0.617; p = 0.001, respectively) and fruit fresh and dry weight with seed dry weight (r = 0.407; p = 0.001 and r = 0.397; p = 0.001, respectively). Very low but statistically significant positive r values (between 0.1 and 0.4) were identified for fresh weight and ovule number, fruit equatorial diameter with ovule number and pollen diameter, seed dry weight and seed number with pollen and ovule number. Interesting correlations between leaf nutrients and flower variables were observed. That is, leaf carbon content with ovule number (r = 0.334; p = 0.05) and pollen/ovule ratio (r = –0.419; p = 0.014), while leaf nitrogen content and carbon/nitrogen ratio were correlated with pollen diameter (r = 0.386; p = 0.024 and r = –0.430; p = 0.011, respectively).
Multivariate relations between populations and plants at the three growing seasons
When PCA was performed for the three years of study, the distribution of plants for the two first components changed in function of the year. The first PC, accounting for 47.5%of variability, resulted positively correlated to fruit fresh and dry weight, fruit equatorial and polar diameter, seed number and seed dry weight. PC2, representing essentially anthocyanin content, was negatively correlated with seed dry weight/fruit dry weight, accounted for 15.4 %(Fig. 3). The most concentrated distribution was observed for 2016, while for 2015 and especially for 2017, a wider distribution of observations, indicated by the sets of prediction ellipses was noticed (Fig. 3). Specifically, the environmental conditions in 2017 could have exerted a more substantial effect on plant parameters associated with PC2 (e.g. anthocyanin variable), than on those related to PC1.
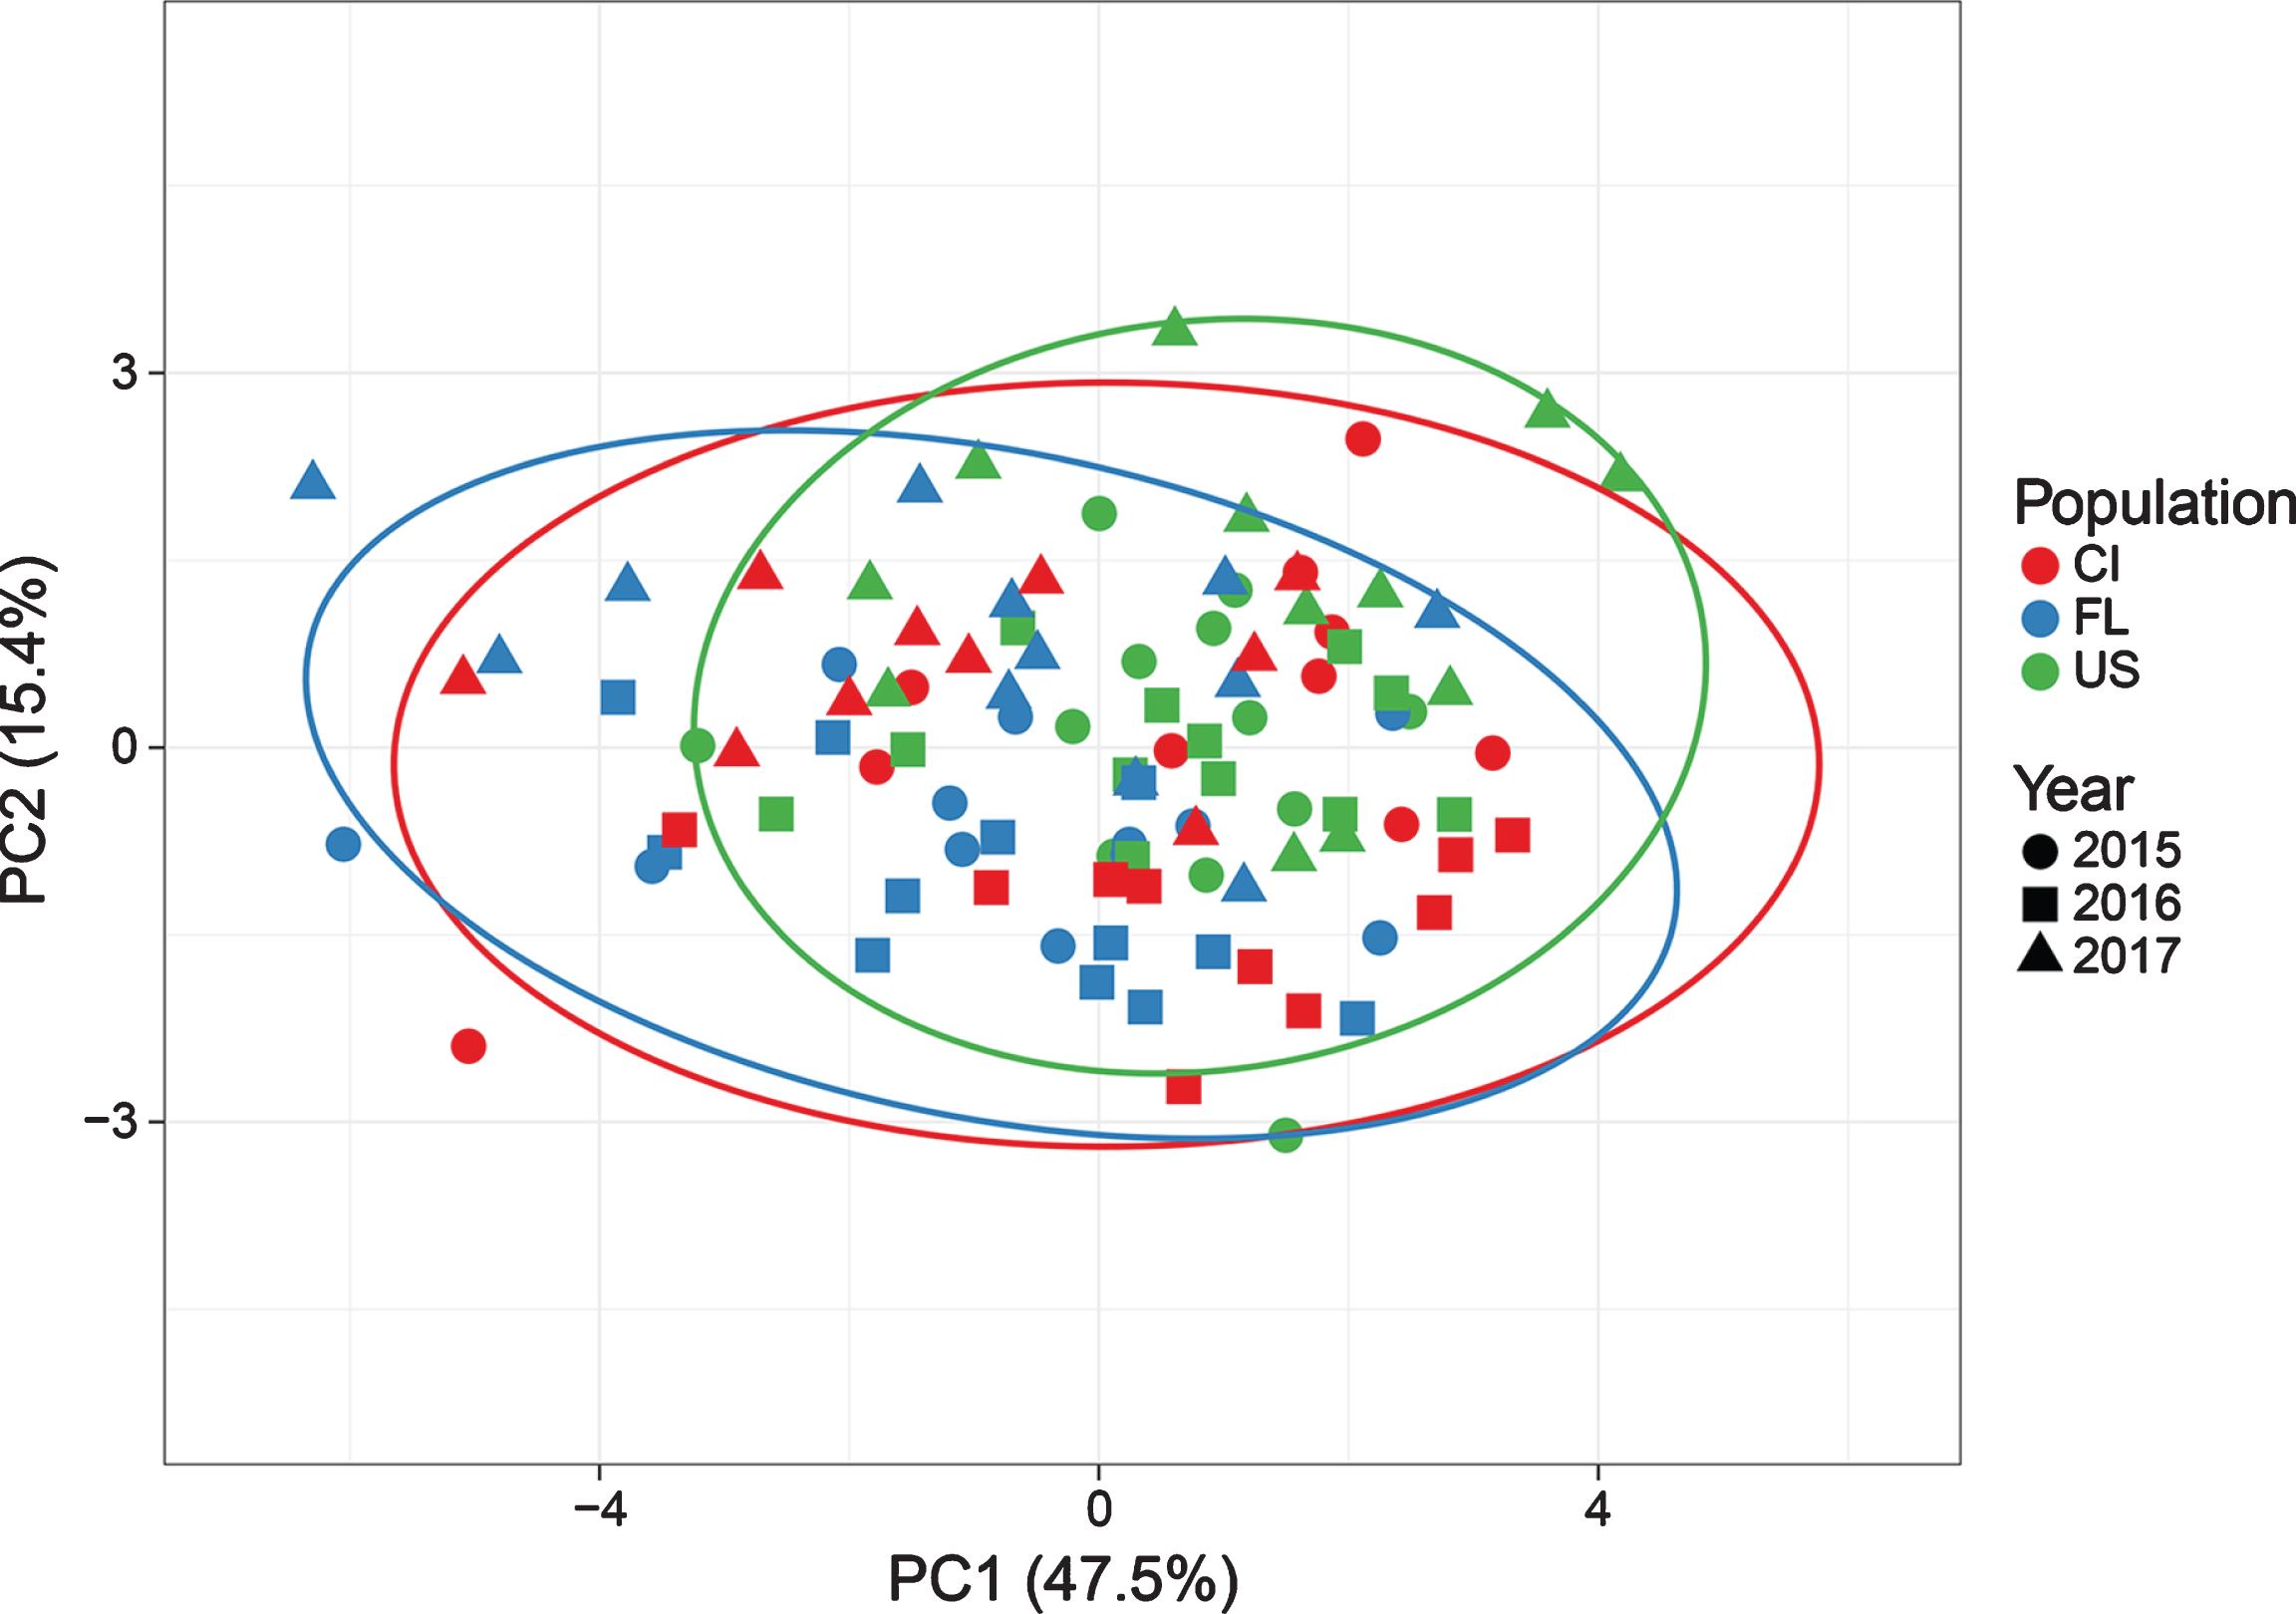
Distribution of B. microphylla plants together and related to year of observation (2015, 2016 and 2017) and population (US, FL and CI), on the first two Principal Components resulted from the analysis on 10 variables (Prediction ellipses P < 0.05).
A variation in the distribution of individuals and their related populations can be observed also considering a yearly approach (Fig. 4). Namely, during 2015, US resulted less sparse than FL and CI populations, and most of plant samples are in the intersection of the three sets formed by the prediction ellipses. Conversely, in 2016 and 2017, individuals of each population are more widely dispersed.

Distribution of B. microphylla plants in each year of observation (A = 2015; B = 2016 and C = 2017) and population (US, FL and CI), on the first two Principal Components resulted from the analysis on 10 variables (Prediction ellipses P < 0.05).
The heatmap generated for the whole set of data of the three years of observations (Fig. 5) shows a high level of correlation between the pairs equatorial fruit diameter –fresh fruit diameter and seed dry weight –seed number variables, while anthocyanin content resulted lowly associated to other parameters. Taking into account the dendrogram related to the individual specimens of B. microphylla, three main clusters (A, B and C) can be observed in the top of Fig. 5. Nevertheless, there was no clear matching between these clusters and the nine classes of categories adopted to classify the plants. On the other hand, the cluster A includes plants with low values of anthocyanin content, fruit dry weight as percentage of fresh weight, seed dry weight and seed dry weight/fruit dry weight, fruit fresh weight/shoot length and intermediate values of the other parameters, while cluster B aggregates specimens with low values of seed dry weight/fruit dry weight ratio, seed number and seed dry weight. Cluster C includes more variegated specimens, showing in some cases the highest values for fruit dry weight as percentage of fresh weight, seed dry weight/fruit dry weight, fruit fresh weight/shoot length, fruit dry weight, and lowest values of seed number, seed dry weight and fruit equatorial diameter.
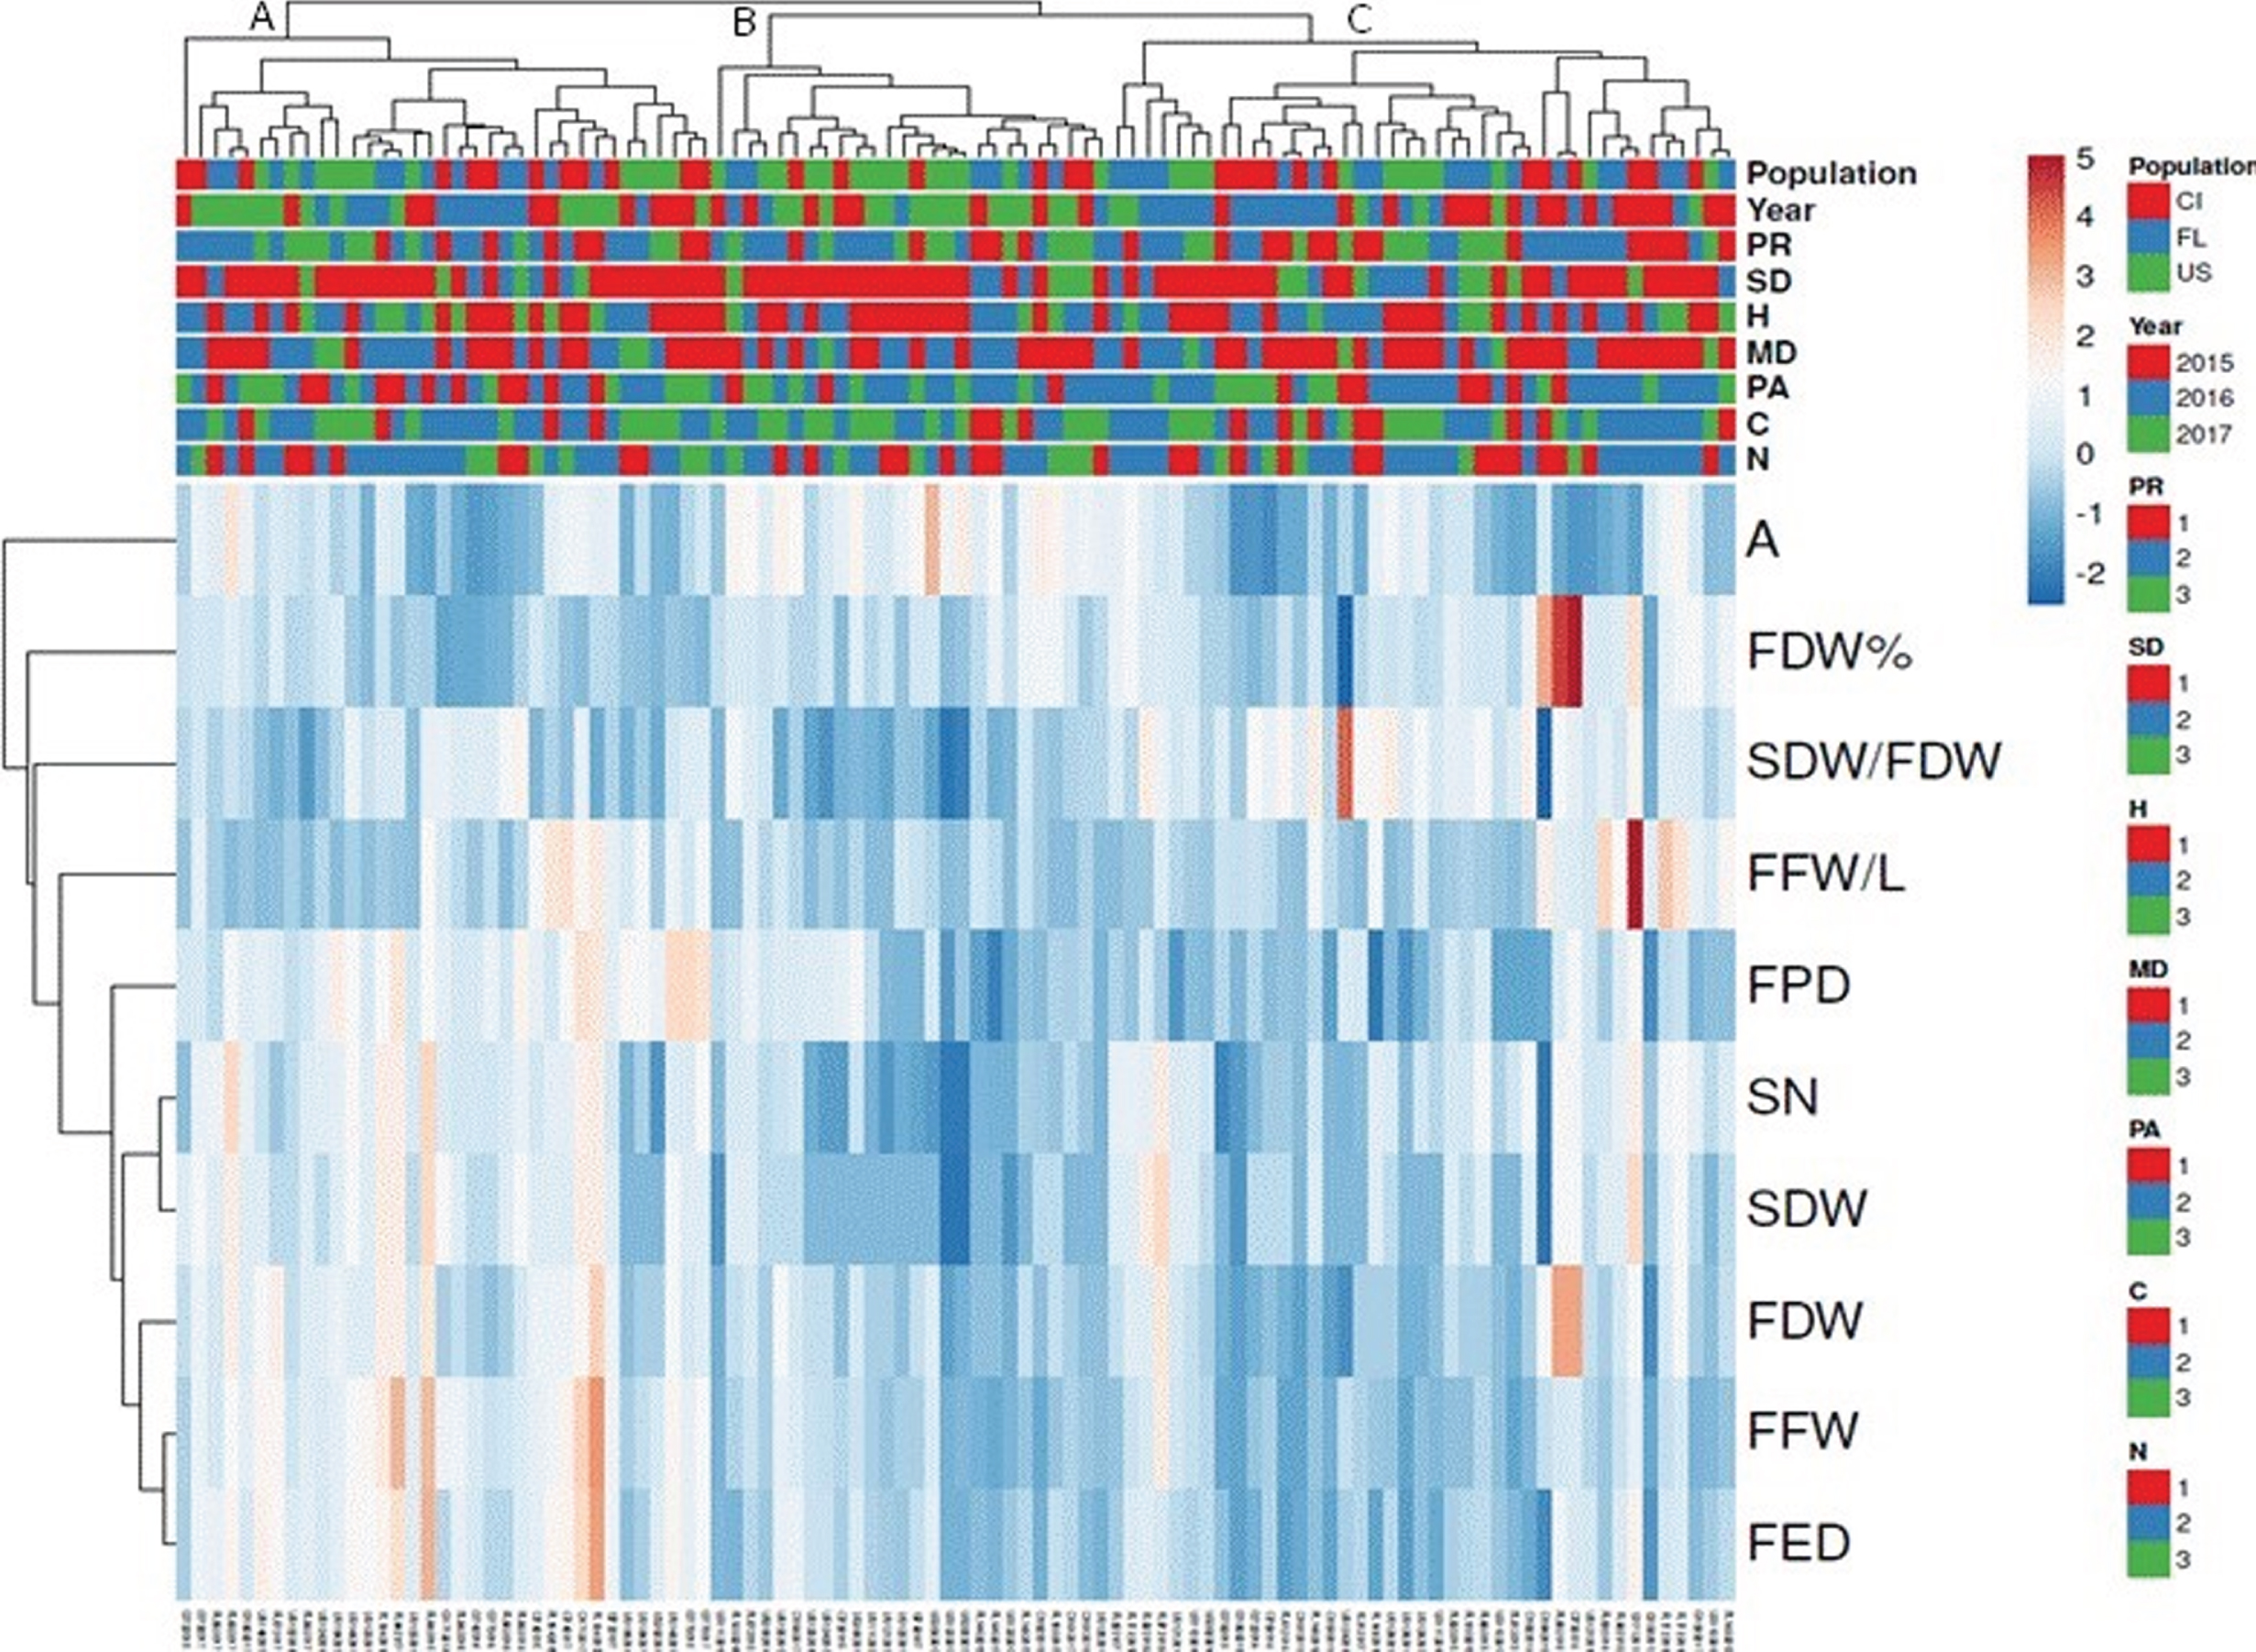
Heat map generated using ClustVis showing clustering of multivariate data values and variable correlations from three years of observations. (PR) proximity to other plants, (SD) shade percentage, (PH) plant height, (MD) maximum plant diameter, (PA) productive area, (C) total leaf carbon, (N) total leaf nitrogen, (A) anthocyanin concentration (mg cyanidin-3-glucoside 100 g–1); (FDW%) fruit dry weight as percentage of fruit fresh weight, (SDW/FDW) seed dry weight/fruit dry weight, (FFW/SL) fruit fresh weight/shoot length; (FPD) fruit polar diameter; (SN) seed number; (SDW) seed dry weight, (FDW) fruit dry weight, (FFW) fruit fresh weight, (FED) fruit equatorial diameter.
The existence of a large variability in fruit traits in different wild species such as Adansonia digitata, Irvingia spp. [36], Sclerocarya birrea [37], Anthocephalus cadamba [38], and Hippophae rhamnoides [39] growing in its natural environments has been demonstrated.
Fruit properties can vary within an individual, between individuals within a population, and between populations of the same species. Phenotypic variance is determined by the environmental and genetic components. Because the comparison of successive years integrates both different climatic conditions and the evolution of traits with plant development, these effects cannot be easily separated in perennial woody plants [40]. Biotic and abiotic factors influence fruit properties, usually in complex interactions needing long term studies to unravel causes for variation [37]. Among the abiotic factors, environmental conditions like temperature, moisture, solar irradiation, and soil fertility have a significant effect on the phytochemical contents in berry fruits [41]. Population and growing season significantly influenced fruit traits, anthocyanin content and efficiency of reproductive shoots of B. microphylla in Tierra del Fuego, in coincidence with previous results obtained in floral traits and reproductive success, in reproductive shoots concerning with the floral bud development, and the fruit set, in reproductive phenology, and in genetic analysis in this species [24, 30]. However, the significant interactions found between these factors must be considered, due to the behavior of the studied variables varied among growing seasons.
The obtained results could be in part related to the site conditions, although genetic, nutritional, and hormonal conditions could be responsible for the differences in the studied variables among sites and plants. The highest temperatures in FL site during the studied growing seasons, particularly from October to March of 2014–2015 and 2015–2016, together with the lower accumulated rainfall in FL and CI compared with US site, could determine the differences found in the fruit traits, anthocyanin content and efficiency of reproductive shoots. Indeed, rainfall could be associated with the collected solar irradiation in Tierra del Fuego [29]. So, 2014-2015 and 2015-2016 growing seasons favored fruit production in terms of fruit number/shoot length and fruit fresh weight/shoot length, being these differences more noticeable in US and FL populations.
Fruit number/flower number ratio in B. microphylla was also maximum in the 2014-2015 growing season, as well as the fecundity index of FL plants in the 2014–2015 and 2015–2016 growing seasons [29]. However, in the 2016-2017 growing season, the fruits presented the highest fruit dry weight in the three populations, while the highest fruit fresh weight and fruit equatorial diameter in FL and CI populations. Also, seed number/ovule number ratio was the highest in the 2016-2017 growing season in FL and CI populations [29]. Fruit number/shoot length and fruit fresh weight/shoot length were the highest in FL and CI populations in the three growing seasons. On the other hand, fruit dry weight was higher in the FL population in the three growing seasons, whereas fruit fresh weight and fruit equatorial diameter were the highest only in 2014-2015 and 2015-2016 growing seasons.
The effect of genotype and/or environment on berry phytochemical changes were studied in wild species as Rubus [42], while literature for B. microphylla is scarce [43]. Mariangel et al. [44] indicated that the phenolic composition of B. microphylla fruits could vary according to the geographical area of fruit collection. However, it is difficult to determine if these differences are dependent on the genotype or the environment. Fruit anthocyanin content is dependent on climatic conditions, such as UV, visible light, temperature, osmotic stress, and pathogen infection [45]. Thus, the highest temperatures during the 2016-2017 growing season could have favored the high anthocyanin content for the three populations and showed by the PC2 of the Principal Component Analysis. In a previous work, Arena et al. [19], demonstrated that B. microphylla fruits that grew with different light intensities (i.e., 100%, 57%, 24%of natural irradiance and with increased temperatures with increased light intensity) showed significant differences in anthocyanin content. Fruits grown under higher light intensity and higher air temperature had an anthocyanin content of 2.9 times higher than fruits grown under medium light intensity and lower temperatures (103.8 mg 100 g–1 fruit fresh weight). This work also reported a relationship between a high anthocyanin content and high photosynthetic rate and a concomitant increase in soluble solid and sugar content.
Correlations between fruit-flower variables in B. microphylla can be used as indicators of floral traits and reproductive success as in indirect selection. That is, a significant positive correlation between fruit fresh weight with ovule number, fruit equatorial diameter with pollen diameter, and with ovule number, are variables difficult to assess. Besides, correlations between seed number with pollen and ovule number, and seed dry weight and seed number with pollen and ovule number are also challenging to assess. Also, a strong relationship between fruit length and diameter is important in selection as these parameters are useful to determine fruit size, as was found for Sclerocarya birrea fruits [2]. However, in B. microphylla, no correlation was observed between fruit polar and equatorial diameters. Weak or no relationships between some traits mean that indirect selection may not be feasible. On the other hand, interesting significant correlations between leaf nutrients and flower variables were observed. For example, total leaf organic carbon content with ovule number (positive correlation) and with pollen/ovule ratio (negative correlation), whereas total leaf nitrogen content and carbon/nitrogen ratios were correlated with pollen diameter (positive and negative correlation, respectively).
The results obtained from univariate and multivariate statistics, namely the correlation between the variables evaluated in our study, indicated that fruit fresh weight could be chosen as a parameter for the selection of outstanding plant specimens. In contrast, anthocyanin content, showed no association with most of the variables evaluated. Besides, since anthocyanin content is correlated to antioxidant activity, this variable is of paramount importance in the selection of species for domestication. Similarly, seed amount per fruit is a relevant selection criterion since it affects fruit quality negatively in terms of palatability and processing.
Conclusions
Results obtained from this study confirm the variability in fruit traits, anthocyanin content and efficiency of reproductive shoots of B. microphylla among and within three populations from Tierra del Fuego, with different phenotypic plasticity. These results are of great importance when making an efficient genotype selection. Phenotypic plasticity was related with the environmental conditions, i.e., daily air temperatures for the three populations and the three growing seasons. Conditions that favored the fruit characteristics such as weight, size and anthocyanin content were less favorable for the productive variables such as the number and fruit fresh weight/shoot length, as was observed in the FL site.
The multivariate analysis allowed us to analyze the whole measured variables jointly and explored the influence of annual climatic variability in the response of plants and populations. Overall, the results indicate that yearly environmental factors play a relevant role in the phenotypic variation of both individual plants and populations, confirming the complexity of wild species evolution and domestication processes. Nevertheless, several plants with a superior performance were detected during the studied period. These plants could be selected for their clonal propagation and ex-situ evaluation for the beginning of a breeding program of B. microphylla.
Conflict of interest
The authors have no conflict of interest to report.
Footnotes
Acknowledgments
Authors acknowledge to the Prefectura Naval Argentina, and to the technical assistance of Julio Escobar (CADIC-CONICET). This work was founded by the Projects PIP-CONICET 11220120100314CO and PID-University of Morón 06-003-16 and the Project FAI-DAGRI 2019 –University of Florence.