



Abstract
BACKGROUND:
Polyphenols intake increases the function of brown adipose tissue (BAT), stimulating energy expenditure (EE). Calafate (Berberis microphylla) is a polyphenol-rich Chilean native fruit.
OBJECTIVE:
To analyse the effect of a treatment with a Calafate extract in the thermogenic activity of mice adipose tissues.
METHODS:
Forty adult C57BL/6J male mice were subdivided into four groups (n=10 each): control diet, control+Calafate (extract: 50mg total polyphenols/kg weight), high-fat diet (HF) and HF+Calafate.
RESULTS:
Calafate prevented the increase in body weight and the decrease EE induced by HF. In BAT, Ucp-1 transcript was influenced by the interaction between diet and Calafate (p<0.01), Pparα showed the same expression pattern as Ucp-1 and both, diet (p<0.01) and Calafate (p<0.05), induced significant effects in Sirt1. In inguinal adipose tissue, Pgc1α, Pparα, Prdm16, Sirt1, and Dio2 transcripts presented a decreased expression caused by HF, that was reversed by Calafate. In BAT, an effect of diet (p<0.05) and an interaction between diet and Calafate (p<0.01) was observed in UCP-1 protein levels.
CONCLUSIONS:
A treatment with Calafate drives less weight gain in mice fed with HF, and reverses the effects generated by it on the expression of thermogenic and browning markers.
Introduction
Obesity is defined as the pathological increase in body fat due to an energy imbalance [1]. The increase in body weight is specially related to a pathological increase in the content of white adipose tissue (WAT). In addition to WAT, there is the brown adipose tissue (BAT), which carries out thermogenesis and whose cells are characterized by multiple lipid droplets and an increased number of mitochondria [2]. BAT mitochondria express uncoupling protein 1 (UCP-1) present in the mitochondrial inner membrane, which is capable of reducing the proton gradient on which ATP production depends, dissipating energy as heat [3]. This activity can be promoted by endogenous or external factors, such as dietary phytochemicals [4]. Certain stimuli can promote the appearance of UCP-1+ adipocytes in certain regions of WAT called beige adipocytes [5]. The primary thermogenic signalling pathway begins with the activation of the β3-adrenergic pathway, which increases cyclic adenosine monophosphate (cAMP) levels [3]. This signal is detected by protein kinase A (PKA), which activates the mitogen-activated protein kinases (MAPKs) pathway [6], and then the co-activator cAMP response element-binding protein (CREB), which, once phosphorylated, acts as a controller of deiodinase 2 (DIO2) expression [7]. The last promotes the conversion of thyroxine (T4) to triiodothyronine (T3) in BAT, activating thyroid receptors and UCP-1. Simultaneously, the MAPK pathway activates activating transcription factor 2 (ATF-2), which induces the transcription of Ucp-1 and Pgc1-α [6]. It is at this point that three mechanisms can mediate thermogenesis regulation: 1) peroxisome proliferator-activated receptor gamma coactivator 1-α (PGC1-α)-peroxisome proliferator-activated receptor α (PPARα) complex, 2) PR domain zinc finger protein 16 (PRDM16) cofactor, and the 3) adenosine monophosphate-activated protein kinase (AMPK)-sirtuin 1 (SIRT1)-PGC1-α axis [4]. Various research groups have studied the effects of the consumption of polyphenols on obesity features that have been associated with their widely reported anti-obesogenic and pro-thermogenic characteristics [8]. The mechanisms by which these compounds induce these effects were earlier related to increased lipolysis and β-oxidation of fat in the adipose tissue and/or liver, suppression of adipogenesis and/or a decreased fatty acid synthesis [9–13], increased expression of mRNA of genes associated with thermogenesis in BAT and the beige adipose tissue [14–16], and increased mitochondrial biogenesis and activation of the browning of WAT [16–19].
In Chile, various fruits of native plants, including Calafate (Berberis microphylla), have been linked to a wide range of health benefits [15]. Calafate contains numerous phenolic compounds such as anthocyanins, derivatives of hydroxycinnamic acids and flavonols [20], which correlated with a high antioxidant capacity [21]. Extracts from Calafate were able to block inflammation generated by the interaction between adipocytes and macrophages from both mice [22] and human origins [23]. Furthermore, it has been shown to restore glucose tolerance in obese animals [24]. Thus, we aim to evaluate the effect of a treatment with a purified and characterized extract of Calafate on the thermogenic activity of BAT and beige adipose tissues from mice fed with a high-fat diet.
Materials and methods
Calafate extract
The extract was prepared from lyophilized Calafate (INIA, Chile), using a low toxicity solvent (ethanol:water). The crude extract was filtered and purified through a chromatographic column packed with Amberlite XAD7HP. This extract was earlier characterized in terms of concentration of total polyphenols (4.257mg GAE/100g DW), total anthocyanins (4.028mg D-3-G/100g DW) and total antioxidant capacity (by ORAC: 59.009mmol TEAC/100g DW).
Animal housing and treatments
Forty-eight-week-old male C57BL/6J mice, of±20g initial body weight, were grouped (n=10 each): a) control group that was fed a standard diet (diet D12328, 11 kcal% fat) (C); b) control group that was fed a standard diet (diet D12328), supplemented daily with 50mg of total polyphenols from Calafate extract/kg body weight/day in the drink; c) obese group that was fed a high-fat diet (HF) (diet D12330, 58 kcal% fat); and d) obese group that was fed HF (diet D12330), supplemented daily with the Calafate extract in the drink (HFC). All the animals were housed in a temperature-controlled room at 21–23°C with a 12h light cycle (lights going out at 8 pm) and received food and water ad libitum for four months. After euthanasia, serum and adipose tissues were stored at -80°C for later analysis. All procedures were performed by following institutional policies and guidelines of the Care and Use of Animals Committee (CICUA) of the University of Chile (protocol 17049-MED-UCH, accepted on June 27, 2017).
Calafate extract dose
Animals of the CC and HFC groups were administered a total of 50mg of polyphenols of Calafate extract/kg of body weight/day. This dose had already been tested in our laboratory and was recently published [24]. The extract was provided in the drinking water of each cage. Dose replenishment was done every two days to avoid any degradation of the polyphenols. According to [25], the human equivalent dose is 4.1mg (total polyphenols)/kg of body weight/day. This dose is achievable because the raw material used is particularly high in polyphenols, although additional analysis is necessary regarding the most appropriate administration strategy in case of humans.
Indirect calorimetry
Before euthanasia, each animal was subjected to an indirect calorimetry test for 6 hours to assess the respiratory quotient (RQ) and energy expenditure (EE) through the OxyletPro System Physio Cage (Panlab SL, Barcelona, Spain). The EE of each animal was calculated according to the equation of animals without fasting: EE (kcal/day/body weight¾)=Volume O2×1.44×(3815+[1.232xRQ]).
Intraperitoneal glucose tolerance test and glycemia and insulinemia determination
Before euthanasia, animals fasting for 6 hours were injected intraperitoneally with 1.5g glucose per kg body weight. Blood was drawn from the tail veins at 0, 15, 30, 60, and 120 minutes after glucose administration to obtain glycaemic curves with the help of a glucometer (FreeStyleOptium Neo, USA). At euthanasia, blood from 6-hour fasting animals was drawn from tail veins to obtain glycemia with a glucometer. Insulin in serum was determined with ELISA (Mercodia, Winston Salem, USA). The homeostasis model assessment (HOMA) was calculated using the methodology described by Matthews et al [26].
Biochemical determination
Total cholesterol (Cholesterol E, Fujifilm, USA) and HDL cholesterol (HDL-Cholesterol E, Fujifilm) levels were determined from the serum samples. Aspartate aminotransferase (GOT) levels were also assayed (Wako Chemicals, Fujifilm).
Adipose tissue histology
Epididymal (eWAT) and inguinal (iWAT) adipose tissues were fixed in 4% paraformaldehyde and processed for paraffin sections. The sections were stained with haematoxylin-eosin to obtain 40x images using a Canon EOS Rebel T3 camera mounted on an Axio Scope A1 light microscope (Zeiss, Germany). The eWAT pictures were analysed with the Adiposoft add-on (CIMA, University of Navarra) for ImageJ (NIH, USA) for adipocyte area calculation.
Thermogenesis and browning marker transcript assessment
The AllPrep® DNA/RNA/Protein Mini Kit (QIAGEN, Hilden, Germany) was used to separately obtain RNA, gDNA, and proteins from samples of eWAT, iWAT and BAT. The RNA obtained was treated with a DNase kit, DNA-free (Ambion). 500ng of total RNA was used for reverse transcription using a commercial kit (High-Capacity cDNA Reverse Transcription Kit, ThermoFisher Scientific, Waltham, USA). The resulting cDNA was used for qPCR using TaqMan® probes (Applied Biosystems) in a Stratagene Mx3000P System (Agilent Technologies, California, USA). Markers related to thermogenesis (Ucp-1, Dio2, Pgc1-α, Pparα, Pparγ, Prdm16, and Sirt1) were evaluated. Expression levels were normalized with the constitutive genes Gapdh and Ppia. The gene expression changes were calculated using the 2(-ΔΔCt) method [27].
Thermogenesis and browning marker protein assessment
Protein concentration was determined using the Pierce BCA Protein Assay Kit (Thermo Scientific). 10 μg of proteins were electrophoresed on a denaturing 10% polyacrylamide gel (SDS-PAGE) and transferred to PVDF membranes (Bio-Rad). Membranes were incubated with primary antibodies (1:1000) for 2 hours room temperature (RT), or overnight at 4°C. Membranes were washed and incubated with an HRP-conjugated secondary antibody (ab205718 Abcam, Cambridge, UK), for 1 hour RT. Protein bands were visualized by chemiluminescence (Super Signal West Femto Maximum Sensitivity kit; Pierce). The relative expression of each protein was normalized with β-actin (ab8227 Abcam). Proteins UCP-1 (ab23841 Abcam) and PRDM16 (ab106410 Abcam) were evaluated.
Inflammatory marker analysis
The transcripts of inflammatory markers, Ccl2 (Mcp-1), Tnf-α, Il-6, Adipoq, Adgre1 (F4/80), and Lep (Leptin), were evaluated by qPCR in eWAT. Serum adipokines/cytokines were assessed with the MADCYMAG-72K kit (MerckMillipore), in a Luminex 100/200 system (Laboratory of Virology, ICBM, Universidad de Chile).
Statistical analysis
The results were analysed using GraphPad Prism 6.0 (GraphPad Software Inc., San Diego, USA). Results were expressed as mean±standard deviation. Data were analysed with a 2-way ANOVA. Tukey’s test for multiple comparisons was applied when interaction between factors was observed. p<0.05 was used to determine statistical differences.
Results
C and CC maintained a similar weight gain throughout the experiment. An effect of diet (p<0.0001) and of the Calafate (p=0.026) was observed. The HF group had the highest weight gain. HFC mice showed a 36% less weight gain than HF. The weight of eWAT and iWAT increased significantly in the HF groups (HF and HFC) due to HF intake (p<0.0001 for eWAT and iWAT). An interaction between diet and extract was observed in BAT weight (p<0.05). The most significant difference was between the CC group (with a 17% higher BAT weight) and C. The treatment with Calafate, by itself, affected EE (p=0.03). The animals that received Calafate had a higher EE. CC mice had a 13% higher EE than C, and those in HFC had a 14% higher EE than in HF (Table 1). Calafate was observed to decrease RQ (p=0.013); thus, the RQ of HFC mice was 11% lower than that of HF mice, and that of CC was 7% lower than C (Table 1). Regarding fasting blood glucose, insulin, and the HOMA index, significant differences were observed, explained only by diet (p<0.05). As for the lipid profile, a diet effect was observed (p<0.001). An interaction was detected (p<0.05) in the total cholesterol. Regarding liver enzymes, no differences were observed. No effect was observed on TNF-α levels. Regarding MCP-1 and adiponectin, a significant effect, induced by the diet (p<0.05), was observed. Finally, no effects on Il-6 and Adipoq gene expression were detected, but an effect of diet on Mcp-1, F4/80, and Leptin transcripts were observed (Table 1). A histological analysis of eWAT revealed an increase in the average area of adipocytes in the groups HF (1184.8±184.1 μm2) and HFC (1049.2±270.1 μm2), C (920±238 μm2) and CC (776±138.1 μm2). However, a statistically significant decrease in HF was detected in the CC group (Fig. 1) (p<0.05). Regarding iWAT, a noticeable brown phenotype was detected in C, CC, and HFC, but not in HF (Fig. 1).
Sample characteristics
Sample characteristics
C, control; CC, control + Calafate; HF, high fat diet; HFC, High fat diet + Calafate; WAT, white adipose tissue; BAT, brown adipose tissue; HOMA, homeostasis model assessment; AUC, Area under the curve for the glucose tolerance test; AU, Arbitrary Units; Ccl2 (Mcp-1); Adgre1 (F4/80); Lep (Leptin).Values represent media±SD. Data was analysed by two-way ANOVA, followed by Tukey posthoc (if interaction between factors was detected). Different letters mean differences of at least p<0.05.

Histological analysis of eWAT and iWAT. A) Images (40x) of epididymal white adipose tissue with hematoxylin-eosin staining. B) Comparison of the average epididymal adipocyte area (μm2) between the groups. C) Images (40x) of inguinal adipose tissue with hematoxylin-eosin staining. Significance was obtained through two-way ANOVA (*p<0.05). C, control; CC control + Calafate; HF, high fat diet; HFC, high fat diet+Calafate.
Regarding the expression of gene markers of thermogenesis in BAT (Table 2), the Ucp-1 expression was influenced by the interaction between diet and Calafate (p<0.01), probably due to a negative regulation in C and a positive regulation in HF induced by Calafate. Pgc1-α was significantly induced by diet and extract (p<0.05). Pparα showed the same expression pattern as Ucp-1. No differences were detected in Prdm16 or Pparγ. Diet (p<0.01) and Calafate (p<0.05) induced effects over Sirt1. Furthermore, an interaction (p<0.001) was observed, showing the same expression pattern as in Ucp-1 and Pparα. No effects were observed in Dio2. Regarding iWAT (Table 2), Pparα, Prdm16 and Dio2 presented a decreased expression in HF (p<0.05) with a preventive effect induced by Calafate (interaction p<0.05). A Calafate effect (p<0.01) and interaction between factors (p<0.05) were observed in the Sirt1 expression. In Ucp-1 and Pparγ, no significant interactions were detected. Regarding eWAT, significant effects were observed in Pparγ (diet p<0.05, Calafate p<0.05), Prdm16 (diet p<0.01) and Sirt1 (diet p<0.05, Calafate p<0.001) (data not shown). Finally, regarding proteins in BAT (Fig. 2), we observed an effect of diet (p<0.05) and an interaction between factors (p<0.01) in UCP-1, due to the protective effect of Calafate in HF animals. Regarding iWAT (Fig. 2), only a diet-inducing effect was observed in PRDM16 (p<0.05).
Gene markers of thermogenesis in BAT and iWAT
C, control; CC, control + Calafate; HF, high fat diet; HFC, High fat diet + Calafate; iWAT, inguinal white adipose tissue; BAT, brown adipose tissue; AU, Arbitrary Units Values represent media±SD. Data was analysed by two-way ANOVA, followed by Tukey posthoc (if interaction between factors was detected). Different letters mean differences of at least p<0.05.
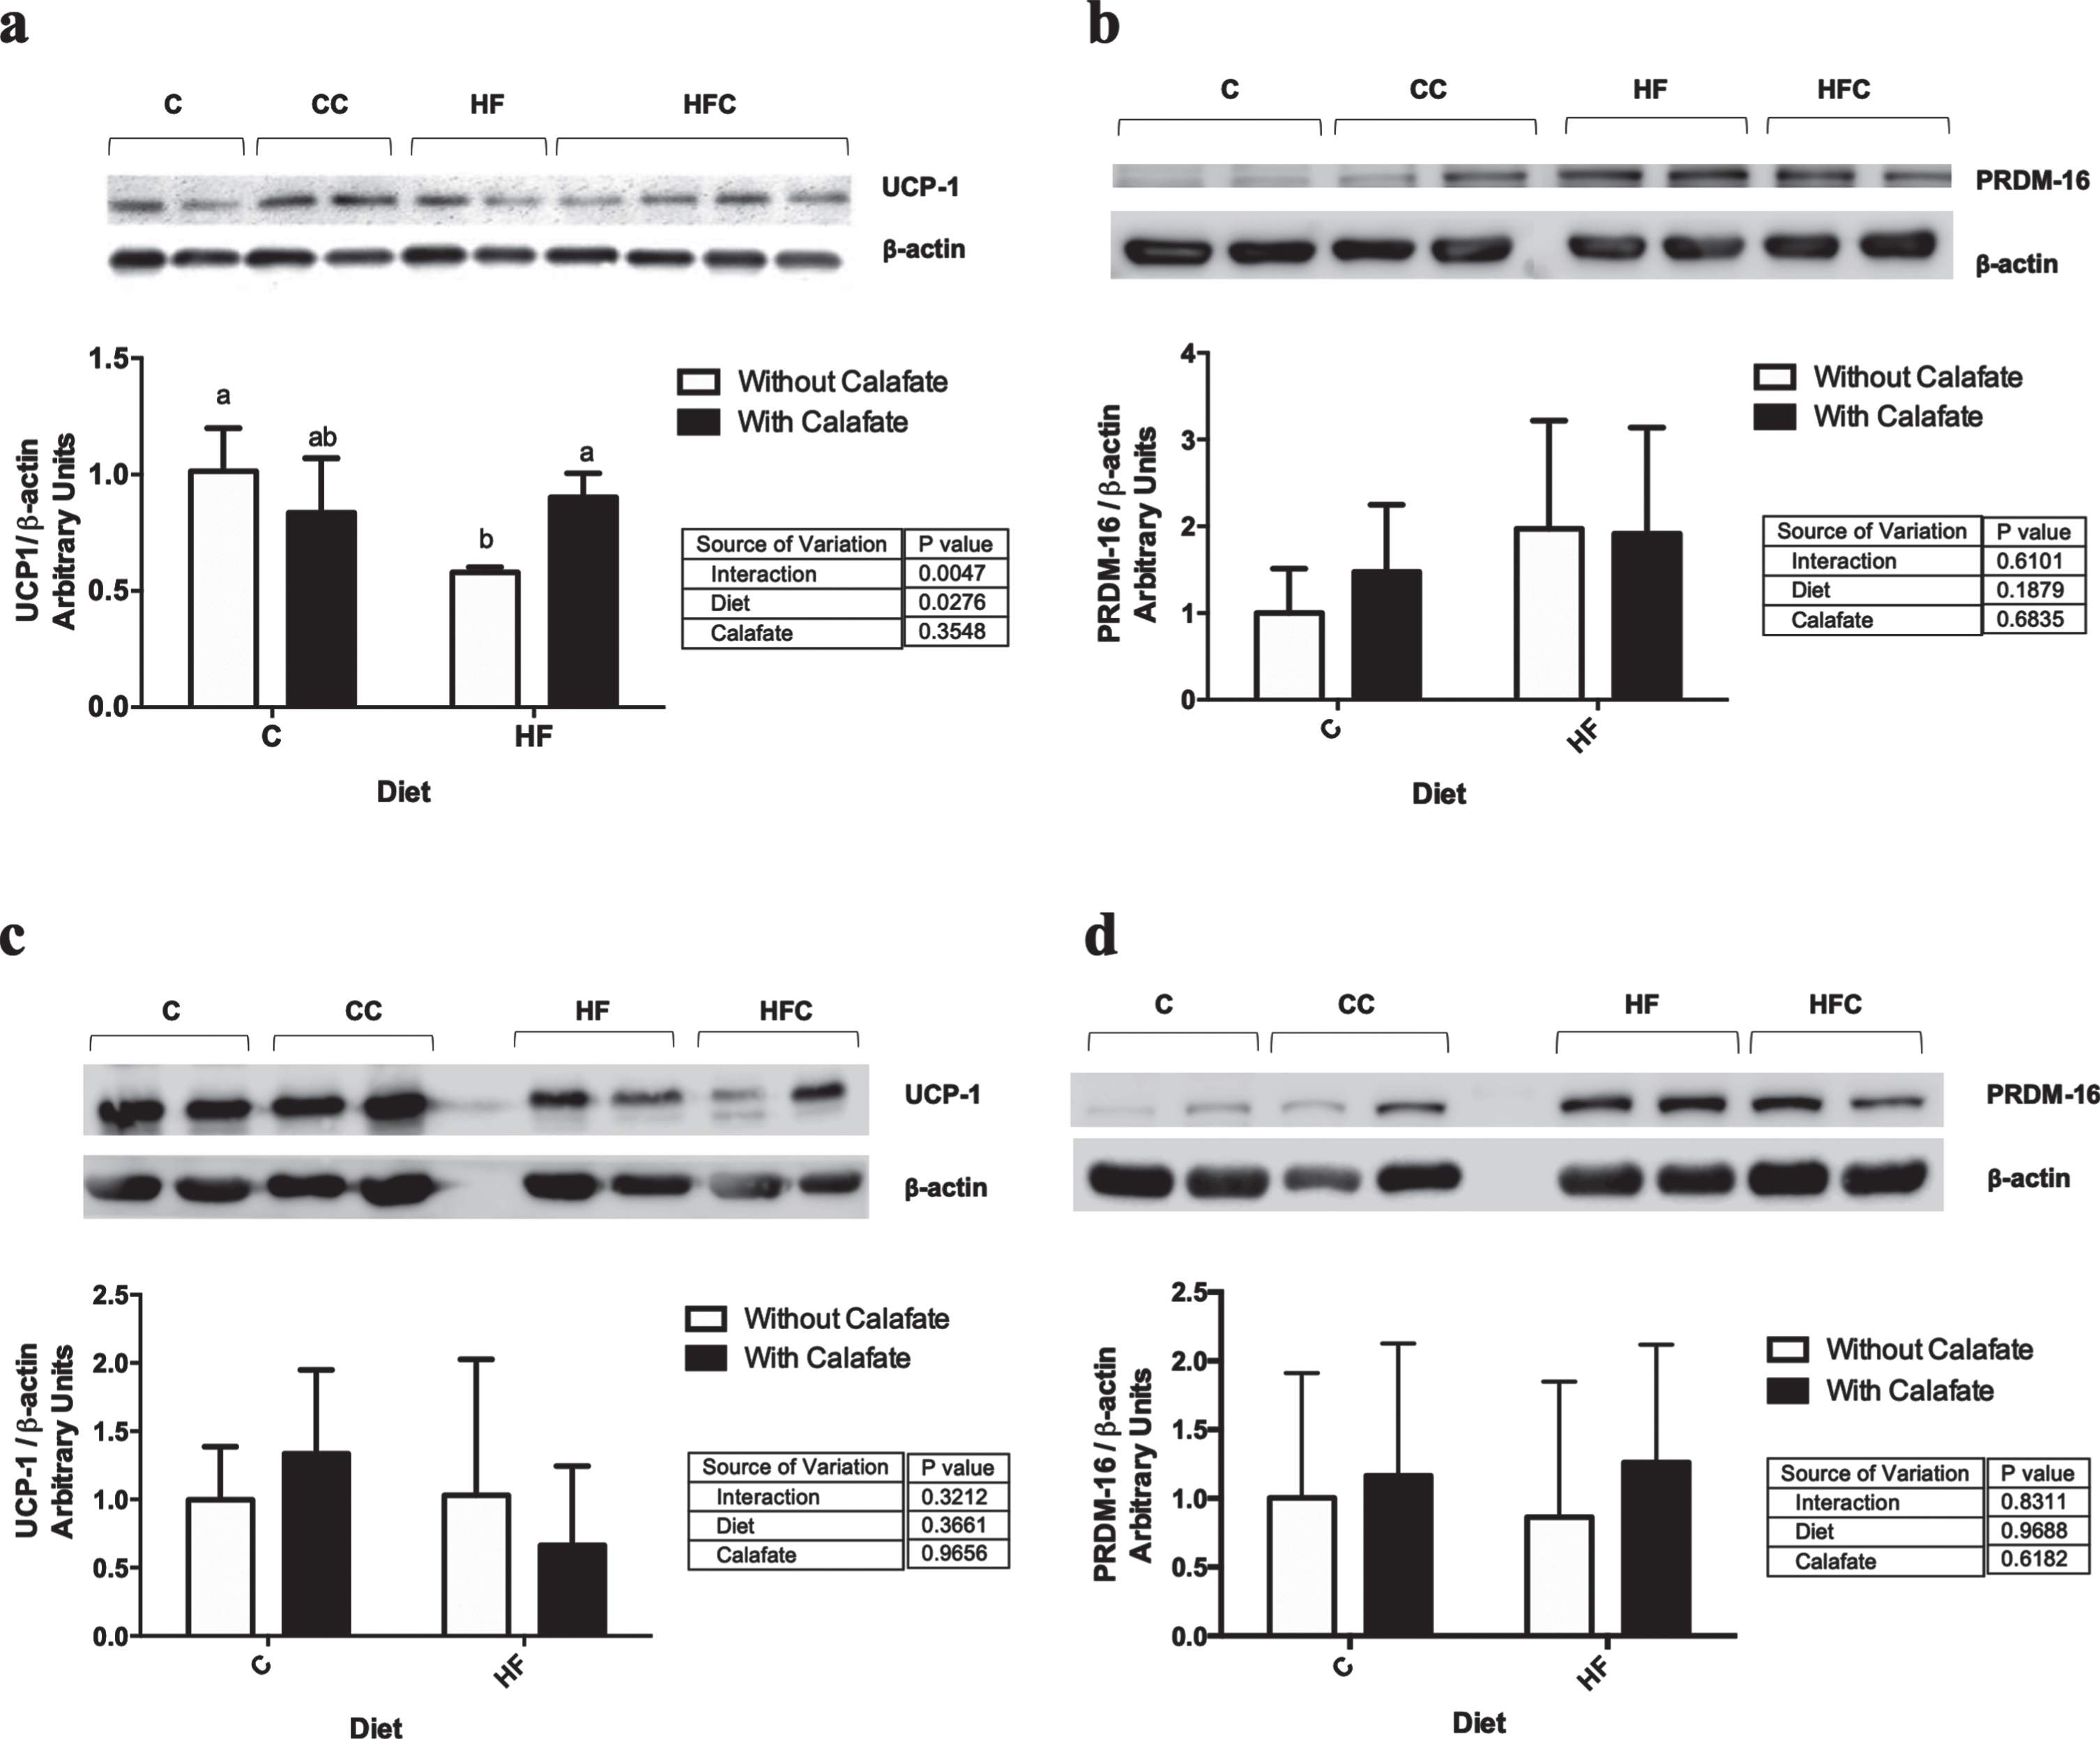
Thermogenic protein expression in BAT and iWAT. Protein expression of A) UCP-1, and B) PRDM16 in interscapular adipose tissue, and C) UCP-1, and D) PRDM16 in inguinal adipose tissue. Bars represent the mean±SD. Data (n=3) was analysed by two-way ANOVA, followed by Tukey posthoc (if interaction between factors was detected). Different letters mean differences of at least p<0.05. C, control; CC, control + Calafate; HF, high fat diet; HFC, high fat diet + Calafate; iWAT, inguinal white adipose tissue; BAT, brown adipose tissue.
Our results show that a Calafate treatment decreases weight gain in animals fed on HF. This effect seems to be mediated by an increase in EE and a greater oxidation of fatty acids. The results obtained in our study agree with the ones reported by Soto-Covasich et al. [24], where a Calafate extract treatment attenuated the weight gain induced by a cafeteria diet. Also, another study on C57BL/6J mice showed that treatment with epigallocatechin gallate (EGCG) from green tea (EGCG 1%, for four weeks) increased EE and prevented HF diet-induced obesity [28]. Additionally, a study on mice fed with HF and supplemented with blackberry or bilberry anthocyanins (200mg/kg, for 12 weeks) showed that both inhibited the increase in body weight by increasing EE [29].
Previous research suggested an insulin-sensitizing effect of Calafate both in vitro and in vivo [24]. We did not observe this effect in the present research. This may be due to the time of administration of the extract, since in our previous study, the same Calafate dose was administered for four weeks. Besides, a treatment with BRL3734, a β3-adrenergic receptor agonist (2.5mg/kg three times per week for 2 weeks), showed an increase in glucose uptake in BAT and a decrease in blood glucose in obese and diabetic mice. When using intragastric levothyroxine (30mg/kg three times per week for two weeks) an increase in glucose uptake in BAT was observed in control and obese, but not in diabetic mice, suggesting that levothyroxine requires the presence of insulin to induce these effects [30]. In our study, we observed that Dio2 transcript was not modulated by Calafate. Despite this, in an acute model (same Calafate dose for two weeks) that we recently carried out, we observed an increase in the Dio2 transcript in iWAT and an improved glucose tolerance (unpublished data). Despite the above, the present research is relevant since it allows us to analyse long-term effects.
Regarding the significant effects observed in the total cholesterol, the results agree with those found by Song et al. [31] in C57BL/6J mice with a blackberry extract (100mg/kg day for 14 weeks). Concerning inflammatory markers, the differences observed were mainly driven by the HF diet. Farrell et al. [32] and Luna-Vital et al. [33], reported that mice fed with HF and supplemented with black elderberry (20–40 and 100–200mg/kg weight, for 16 weeks) and purple corn (200 and 500mg/kg weight, for 12 weeks) extracts, presented significant reductions in the circulating MCP-1 and TNF-α, but not in IL-6. Nemes et al. [34], observed increased MCP-1 values in mice fed with HF, and decreased in mice fed with HF but receiving anthocyanin-rich tart cherry extract (60mg/kg, for 6 weeks). Furthermore, we observed that HF did not significantly influence the concentration of adiponectin, a finding that differs from a previous study [34]. However, in a previous study done in our laboratory, the administration of Calafate with the same dose for 4 weeks attenuated the expression of both Tnf-α and F4/80 induced by the cafeteria diet [24]. Again, these differences could be ascribed to the total administration period.
Browning has been related to a lower WAT mass, with improved thermogenesis and, therefore, with better health. Our results agree with a previously reported study of ours [24], where the administration of Calafate decreased the size of epididymal adipocytes in HF-fed mice. Moreover, Lim et al. [35] had shown that mice fed with HF and getting an anthocyanin-rich extract from Aronia melanocarpa, presented a smaller epididymal adipocytes than of the controls.
Our results have shown that HF intake reduces the expression of thermogenic and browning markers in mice (especially evident in iWAT). Previously, a decreased BAT activity was reported in obesity [36]. In addition, a lower PPAR expression has been linked to a lower thermogenesis in animals fed with HF [37]. Moreover, mice lacking Ucp-1 expression have been found to display an obese phenotype [38]. Also, it was shown in mice that the expression of PGC1-α in WAT is downregulated after 6 weeks of HF treatment [39]. DIO2 is a protein involved in BAT activation [37]. In our study, we observed that the Dio2 transcript in iWAT presented a decreased expression by the HF, which was improved by the treatment with Calafate extract. The effects of a Calafate treatment were more drastic in iWAT than in interscapular BAT. This fact suggests that the mechanism by which the administration of Calafate prevents weight gain (34%) is more related to WAT browning than to BAT activation. These results are consistent with previously reviewed data, indicating that the most significant contribution of brown fat cells in health status comes from the conversion of white to brown adipocytes [40]. Thus, the highest expression of PRDM16 found in iWAT from our mice is consistent with the phenotypic change observed in Fig. 1, since the expression of this molecule is strongly related to a brown fat phenotype, and an increased expression of Ucp-1, Dio2, and Pgc1-α [41]. In this sense, the effects of isolates or polyphenol-rich matrices on an increased BAT activity and adipocytes browning have been widely described. For example, it has been described that resveratrol (30mg/kg/day, for 6 weeks), induced the expression of mitochondrial transcription factor A, cyclooxygenase 2, SIRT1, PPARβ/γ, PGC1-α and UCP-1, and the deacetylation of PGC1-α in rat BAT [14]. Moreover, it has also been related (4g/kg of food, for 2 months) with mice WAT browning by activating AMPKα and thermogenesis in BAT through SIRT1 [17]. Regarding anthocyanins, largely present in Calafate, it has been reported that they improve the mitochondrial function of brown adipocytes [16], increasing the expression of Pgc1-α, Prdm16, Cpt1a and Ucp-1, and mitochondrial biogenesis. Cyanidin-3-glucoside has been reported to increase body energy metabolism, limit weight gain, and modify mitochondrial activity in db/db mice [18]. Also, it has been reported that cyanidin-3-glucoside (1mg/mL, for 16 weeks) increases BAT activity in mice fed with HF diet [28]. Finally, a corn extract, rich in ferulic acid and anthocyanins, has been reported to prevent HF diet-induced obesity concomitantly with the modulation of SIRT1 and AMPK, and reduction in inflammatory markers [33]. It is important to note that the UCP-1 protein expression was modified by the Calafate extract, but not PRDM16. This could be due to an adaptation generated by the time of exposure to the Calafate extract. Furthermore, it has been reported that beige adipocytes can generate heat independently of UCP-1 [42].
The results reported in the present work provide evidence to support the role of bioactive dietary compounds in the prevention and/or treatment of obesity and obesity-associated metabolic disorders. However, more studies are needed to explain the possible metabolic pathways through which the browning of the inguinal adipose tissue occurs, exploring, for example, the entire thyroid hormone axis. Besides, it is necessary to examine the effects of this extract in animal models of diabetes to determine the relation between Dio2, thyroid hormones, and insulinemia.
Conclusion
Supplementation with a Calafate extract prevented weight gain in mice fed with HF, which seems to be mediated by an increase in EE and a significant browning of white adipose tissues. Also, it was observed that Calafate reversed the effects of HF intake in the expression of thermogenic markers and browning in iWAT.
Footnotes
Acknowledgments
The National Agency for Research and Development (ANID, Chile) funded this work (grant FONDECYT #1171550 to D.F.G-D.). The authors also want to acknowledge the technical expertise of Kharen Espinoza and Greys Lagos.
Conflict of interest
The authors have no conflict of interest to report.