



Abstract
BACKGROUND:
The softness of blackberry fruits limits their postharvest shelf-life and commercial use, and abscisic acid (ABA) is considered one of the key hormones involved in fruit ripening.
OBJECTIVE:
This study aimed to explore the underlying physiological and molecular actions of ABA on blackberry fruit ripening and softening.
METHODS:
Various physiological indices of and plant hormone levels in treated and untreated blackberry fruits were determined simultaneously. The differentially expressed genes (DEGs) were analyzed by RNA-sequencing, and their expression profiles were detected. The ripening mechanism was elucidated by UHPLC-MS using two groups of fruits at 28 d.
RESULTS:
After 25 d, the ABA concentration and polygalacturonase (PG) and beta-1,4-endoglucanase (EG) activities in ABA-treated fruits were significantly higher than those in untreated fruits. Large differences in the expression profiles were detected at 28 d. The expression of DEGs related to cell wall softening and ABA synthesis was largely triggered after 25 or 28 d. Sixty-nine differentially accumulated metabolites were ultimately annotated as related to fruit ripening.
CONCLUSIONS:
ABA stimulates blackberry fruit ripening by promoting cell wall enzyme activities, the expression of various ripening-related genes and metabolite accumulation.
Introduction
Blackberry (Rubus spp.) bears edible aggregate fruits rich in dietary fibers, natural pigments and phenolic compounds [1], but ripe blackberry fruits often have undesired fragile skin and a short shelf life, which directly affect their commercial value [2]. Fruit softening and hardness reduction, as well as other physiological and chemical changes, occur during the fruit ripening process [3]. Although blackberry fruit softening is correlated with the solubilization and depolymerization of cell wall constituents during maturation [4], the physiological and molecular regulation mechanisms in soft berry fruits have rarely been explored.
Fleshy fruits undergoing ripening can also be classified into climacteric and non-climacteric types according to the patterns of ethylene production during ripening. Endogenous plant growth regulators are considered potent factors controlling the fleshy fruit color and ripening processes [5]. It is known that non-climacteric fruits show no marked changes in ethylene production or respiration [3], and blackberries exhibit non-climacteric characteristics with a bright, dark purple/black color when they are harvested at full maturity [6]. Abscisic acid (ABA) is a phytohormone that plays vital roles in regulating seed development, seedling growth and fruit ripening and positively adapts to biotic and abiotic stresses and sugar signal sensing [7]. ABA is needed for ripening processes, and exogenous ABA might accelerate fruit ripening and softening, as has been demonstrated in different non-climacteric berry fruits, such as strawberry [8–10], grape [11], and highbush blueberry [12]. Exogenous ABA stimulates climacteric and non-climacteric ripening types in the same species, such as Japanese plums [13]. Moreover, ABA exerts a positive effect on the ripening of both non-climacteric and climacteric fruits [14, 15]. In particular, ABA is thought to play even more important roles than ethylene in tomato fruit maturation and senescence [16]. ABA was recently linked to ethylene and other regulators, such as sugar, polyamines, auxin and reactive oxygen species, during the regulation of strawberry fruit ripening [5].
In addition to ethylene and ABA, many other plant growth regulators are involved in the regulation of fruit ripening. Auxins (IAAs) inhibit non-climacteric ripening [17, 18] but enhance the ripening of climacteric Rosacea fruits [19, 20]. The exogenous application of ABA and 2,4-dichlorophenoxyacetic acid increases and inhibits the expression of anthocyanin biosynthetic genes in grape berries, respectively [21]. Methyl jasmonate (MeJA) promotes strawberry fruit ripening through the induction of anthocyanin, sucrose, cell wall, MeJA, and ABA metabolism-related gene expression [22]. The coordinated interaction or synergistic effect between ABA and the sucrose signaling pathway has been revealed to regulate fruit ripening in citrus [23], grape [15] and strawberry [24]. Gibberellic acid (GA3) modulates fruit ripening and exerts its action in part by interacting with the ABA pathway in sweet cherry [25]. In blackberry, exogenous GA3 advances the onset of budbreak, flowering and fruit ripening [26]. Therefore, fruit ripening is likely the result of the concerted actions of multiple regulatory pathways.
ABA plays a crucial role in the regulation of ripening-related gene expression through ABA perception and signal transduction. A transcriptome analysis has revealed that the exogenous application of ABA upregulates ripening-related cell wall hydrolase genes [27]. Various metabolic networks, including the sugar transport system, organic acid metabolism, secondary synthesis and cell wall metabolism, are reprogrammed by ABA induction [28]. In peach fruit, ABA appears to modulate ripening through interference not only with ethylene and the cell wall but also with auxin-related genes [29]. ABA drives the strawberry fruit ripening process by regulating genes involved in the pathways of hormone signal transduction and the biosynthesis of secondary metabolites, and miRNAs might be important assistance regulators [30].
Cellulase (endo-1,4-D-glucanase, EG; EC 3.2.1.4) and polygalacturonase (PG; EC 3.2.1.15) are cell wall-modifying enzymes closely related to the softening of blackberry fruits [4]. To date, few studies have investigated the effect of ABA on the control of ripening in blackberry fruits and the regulatory effects of ABA on changes in the activity of cell wall-degrading enzymes and ripening-related genes. The main objective of this study was to investigate the effects of ABA on physiological characteristics, particularly cell wall modifications, ABA and ethylene responses, and the expression profiles of key ripening-related genes and metabolite accumulations during the ripening of blackberry cv. ‘Navaho’ fruits. This study might provide evidence showing that the interactions between ABA and ripening-related events regulate the ripening of blackberry fruits.
Materials and methods
Plant material and ABA treatment
Three-year-old Navaho blackberry shrubs were used in the present experiment. Plants exhibiting uniform development and growth were selected. The fruits of these plants were treated with 1 mM ABA, and untreated fruits were used as controls (CKs). The blackberry fruits were grown in a blackberry experimental field in Lishui County (119°07’E, 31°28’N), Jiangsu Province. In the middle of May 2019, fully blooming flowers of Navaho were labeled at the onset of flowering. After ten days, the labeled fruits were treated at the onset of coloration by dipping them into 1 mM ABA [0.05% Tween 20 (v/v) resolved] for 3 min. We simultaneously sampled the treated and untreated blackberry fruits 0, 3, 9, 19, 25, and 28 d after ABA treatment according to the color changes of the fruits (Fig. 1A). Because the development of the fruits belonging to the CK group was somewhat delayed, we also sampled fully ripe fruits of the CK group 30 d after treatment (Fig. 1A). Three biological replicates of blackberry fruits were sampled at each stage, and fresh fruits were preserved at –80 °C for further study.
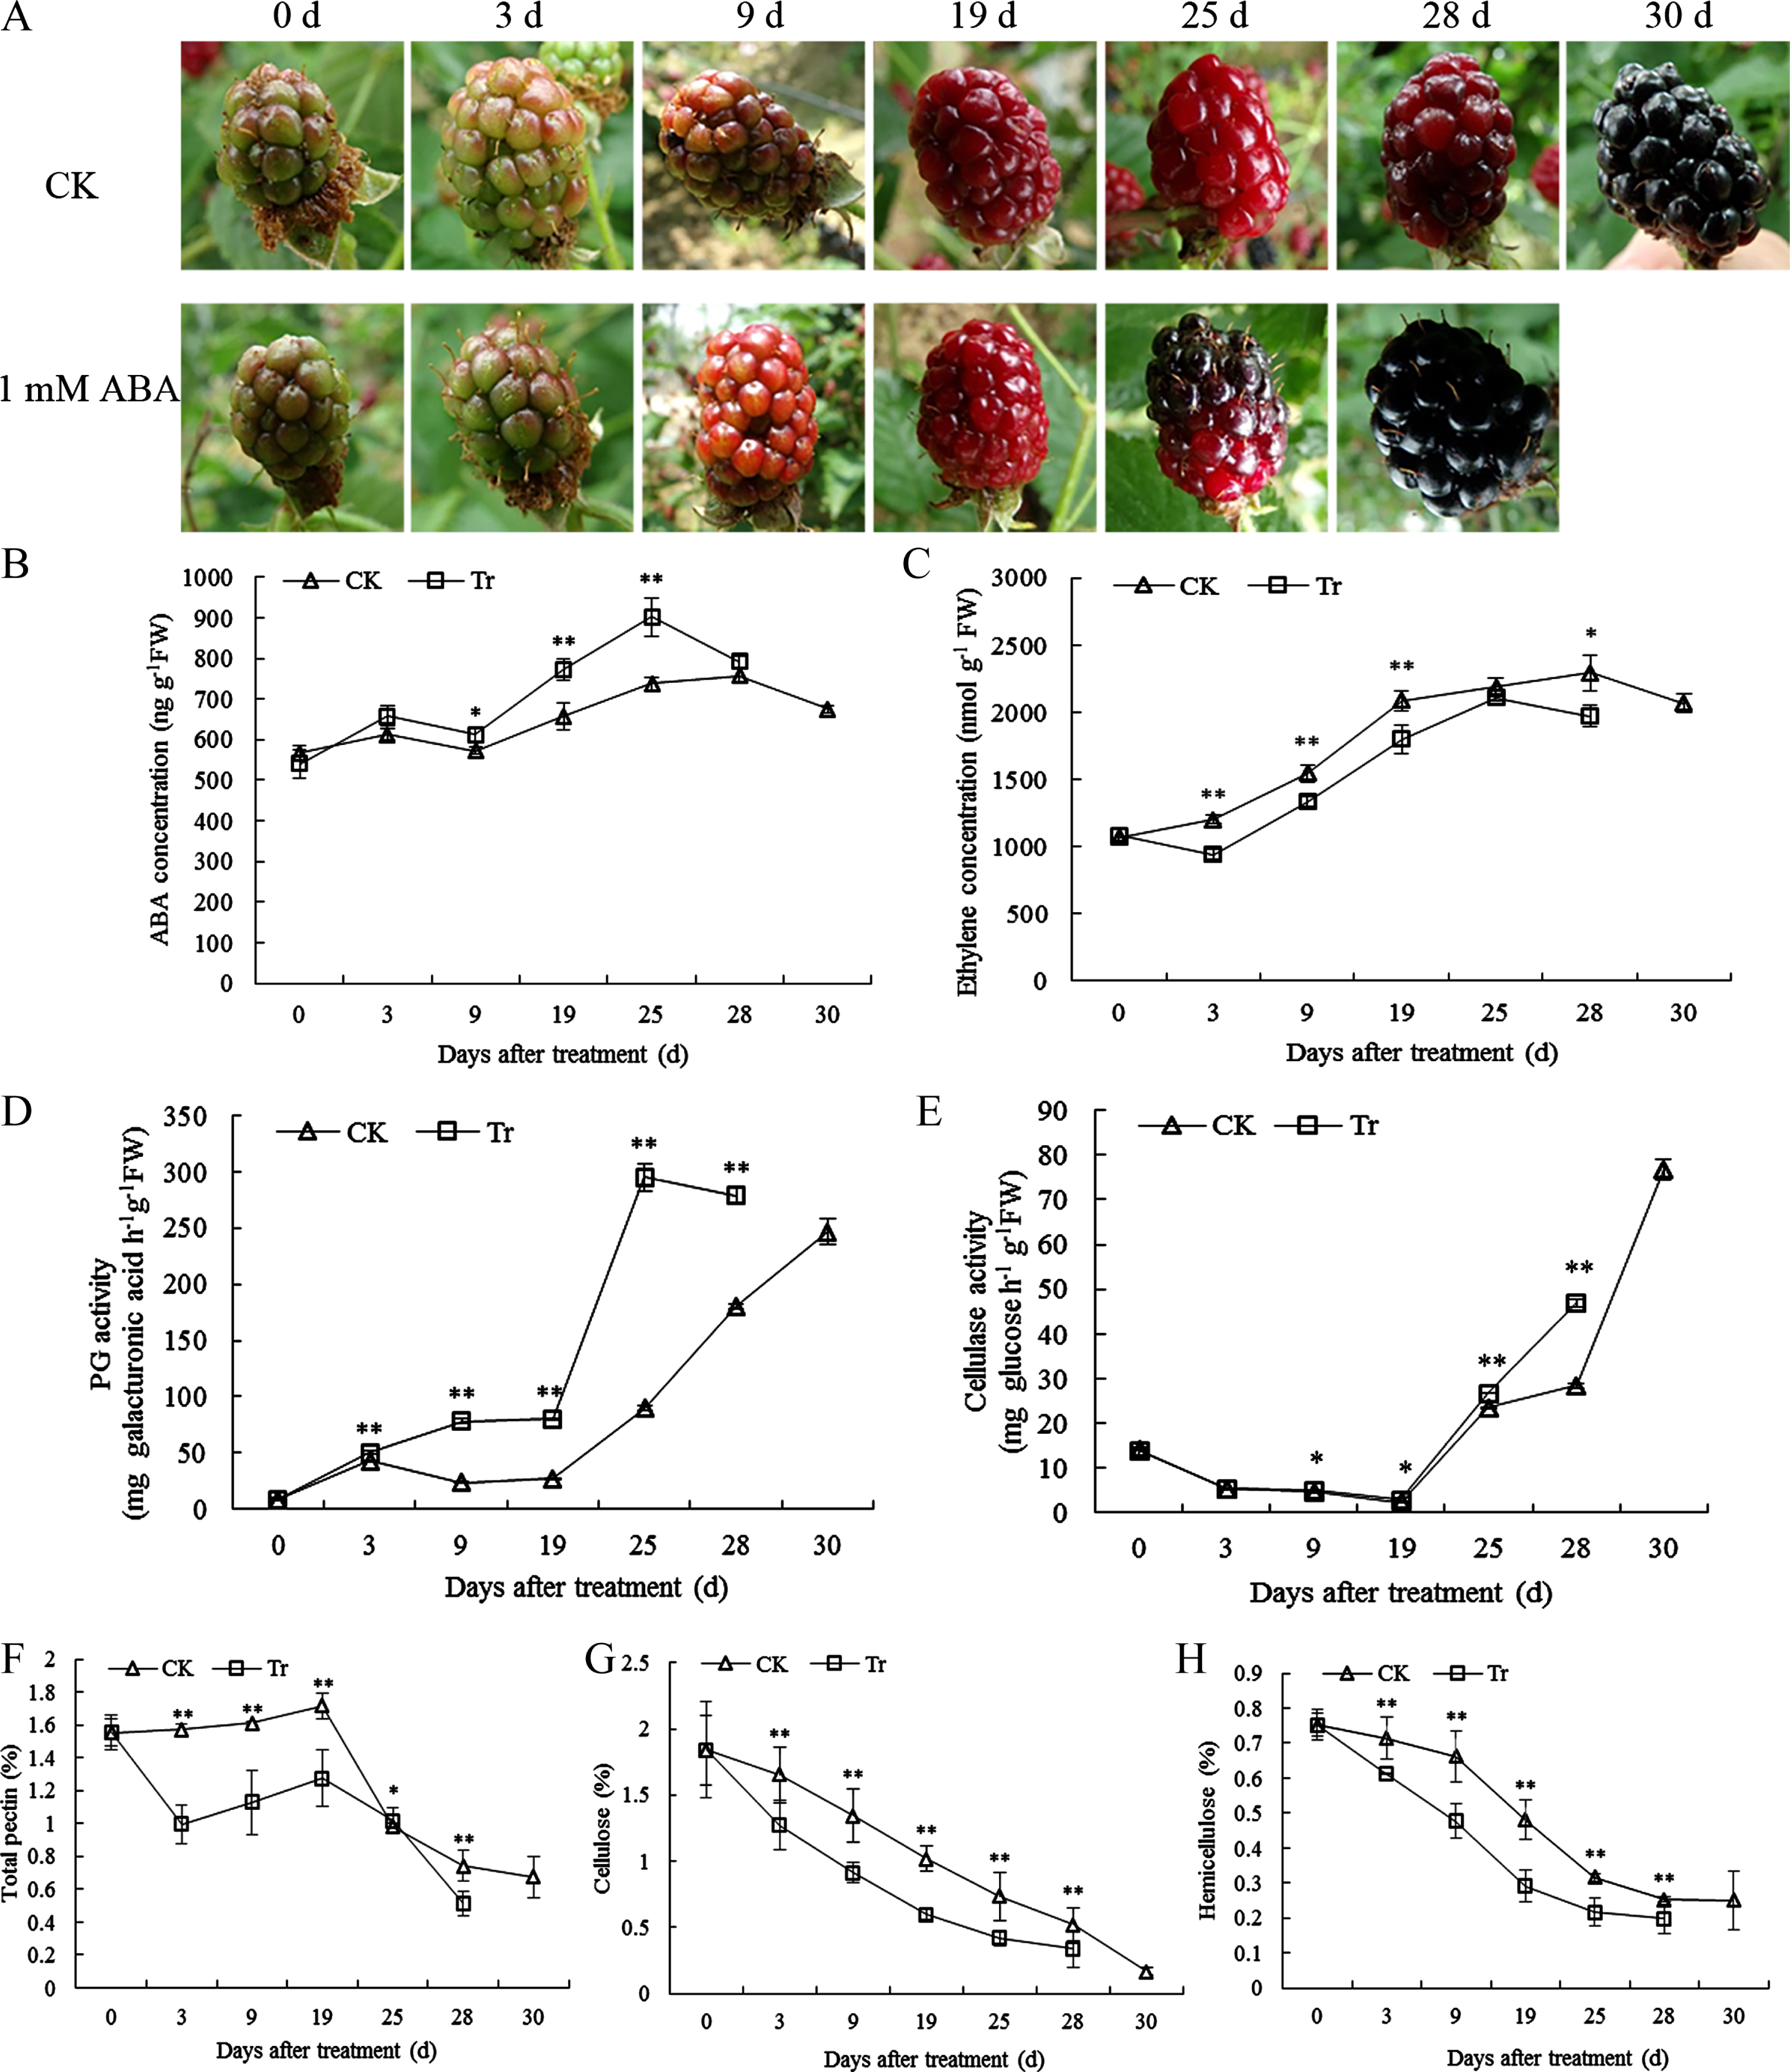
Changes in phenotype-, hormone- and cell wall-related physiological indices during fruit maturation in the control (CK) and ABA treatment (Tr) group. A. Phenotypic plots of the CK and ABA treatment group at different ripening stages. B and C. Changing trends of the abscisic acid and ethylene contents in fruits. D and E. Results from the PG and EG activity assays. F–H. Changes in the total pectin, cellulose and hemicellulose levels in fruits. Asterisks (* and **) denote significant and highly significant differences between the CK and treatment fruit samples at the respective time point through paired comparisons using Student’s t-test (P≤0.05 and P≤0.01).
Endogenous hormone determination
One gram of blackberry fruit pulp was added to 9 mL of phosphate-buffered saline (PBS, pH 7.4) solution and fully homogenized. The samples were centrifuged at 3,000 rpm and 4 °C for 20 min, and the supernatant was then collected. The ABA and ethylene contents were measured using an enzyme-linked immunosorbent assay (ELISA) according to a published protocol [31]. The double antibody sandwich method was used for the measurements, and the absorbance was measured at 450 nm. The hormone concentration was calculated by the standard curve method.
Cell wall-degrading enzyme activity and component assays
Various cell wall-degrading enzyme extracts were prepared by homogenizing pulp samples collected from the day of handling day to the full-ripening stage under ice-cold conditions. The determination of PG and EG activity was performed as previously reported [4]. Cell wall material (CWM) from fruit pericarps at different ripening stages was extracted according to a reported method [32]. The pectin, cellulose and hemicellulose contents were also measured according to an established method [4].
RNA sequencing (RNA-seq)
Total RNA was extracted from blackberry fruits using the TRIzol® reagent according to the manufacturer’s instructions (Invitrogen Inc., US), and genomic DNA was removed using DNase I (Takara, Dalian, China). A high-quality RNA sample was then used to construct a sequencing library. RNA-seq transcriptome libraries were prepared using a TruSeqTM RNA Sample Preparation Kit from Illumina (San Diego, CA) with 1μg of total RNA. A detailed description of the steps and methods of these processes were previously described [33]. After quantification by TBS380, paired-end libraries were sequenced on an Illumina NovaSeq 6000 sequencing instrument (150 bp*2, Shanghai Biozeron Co., Ltd.). De novo assembly and annotation, differentially expressed gene (DEG) analysis and functional enrichment were performed according to reported procedures [34, 35].
Quantitative real-time polymerase chain reaction (qRT-PCR) analysis
Total RNA from Navaho fruit flesh was extracted using an RNA extraction kit (Bioteke Inc., Beijing, China) and reverse transcribed using a HiFiScript cDNA Synthesis Kit (CWBIO, Shanghai, China). Triplicate qRT-PCR (95°C for 3 min; 40 cycles of template denaturation at 95°C for 10 s and primer annealing at 60°C for 10 s; and melting curve analysis at various temperatures for 30 s starting from 60°C and increasing the temperature by 0.3°C during each cycle until 95°C) reactions were performed in triplicates in a 20-μL mixture comprising 10μL of SYBR Green ExTaq™ (Takara, Dalian, China), 1μL of cDNA, 1μL of each primer (10μM), and 8μL of nuclease-free water with a qTOWER 2.2 qPCR instrument. The primers used were designed via Oligo 6 and are listed in Table S1. The blackberry actin gene (GenBank: HQ439558) was used as a reference gene, and the relative expression patterns were calculated with the 2–ΔΔCT method.
LC-MS analysis
Metabolite extraction
Nontargeted LC-MS metabolite sequencing with positive and negative electrospray ionization-tandem mass spectrometry (ESI-MS/MS) was performed with the treated and untreated blackberry fruit samples collected 28 d after treatment, and three biological replicates of each group were evaluated. In addition, quality control (QC) samples (equal-volume samples from each tested sample were thoroughly mixed) were prepared to evaluate the stability of the system in the whole experiment, and blank samples (an experimental sample was replaced with 53% methanol solution consisting of 0.1% formic acid, and the pretreatment process was the same as that used for the experimental sample) were used to remove background ions.
One hundred milligrams of fruit was ground in liquid nitrogen and resuspended in 500μL of ice-cold aqueous formic acid solution (0.1%) consisting of 80% (v/v) methanol. The mixture was vortexed, chilled on ice for 5 min, and centrifuged for 10 min at 15,000 rpm. Afterward, a certain amount of the supernatant with mass spectrometry-level water was diluted to obtain a methanol content of 53%. We further centrifuged the solution at 15,000 g for 10 min and collected the supernatant, and the sample was then subjected to LC-MS analysis [36, 37].
Instrument parameters
The chromatographic column was a Hypersil Gold column (C18). The column temperature was 40 °C, and the flow rate was 0.2 mL/min. In the positive-mode analysis, mobile phase A was 0.1% formic acid, and mobile phase B was pure methanol. In the negative-mode analysis, mobile phase A was 5 mM ammonium acetate (pH 0.9), and mobile phase B was pure methanol. The mass spectrum included a scanning range (m/z) of 70–1050. The ESI source conditions were as follows: spray voltage, 3.2 kV; sheath gas flow rate, 40 arb; auxiliary gas flow rate, 10 arb; and capillary temperature, 320°C. The MS/MS secondary scan was data dependent.
Metabolite identification
The obtained data file was imported into Compound Discoverer 3.1 (CD3.1, Thermo Fisher) software and screened to simplify the retention time, mass charge ratio and other parameters. We then aligned the peaks of the different samples according to a retention time deviation of 0.2 min and a mass deviation of 5 ppm to increase the identification accuracy. The peak was extracted according to a mass deviation set to 5 ppm, a signal intensity deviation of 30%, a signal-to-noise ratio of 3, a minimum signal intensity of 100,000, and the sum of the ions and other information. Simultaneously, the peak area was quantified, the target ion was integrated, and the molecular formula was predicted according to the molecular ion peak and fragment ion. The data were subsequently compared with the data within the mzCloud (https://www.mzcloud.org/), mzVault and MassList databases. Blank samples were used for the removal of background ions, and the quantitative results were normalized to quantify the identified compounds.
Statistical analysis
Graphical representations of the data were prepared using Microsoft Excel. The data were statistically analyzed with SPSS v17.0. The differences in the data from the samples collected at each time point were tested via Student’s paired t-tests. Differences between two sets of treatments were considered significant if p≤0.05 and p≤0.01.
Results
Effects of exogenous ABA on physiological characteristics during blackberry fruit ripening
After the onset of coloration, the color of the blackberry fruits intensified with different ripening days and began turning red at 19 d (Fig. 1A). After ABA treatment, the fruits in the treatment group turned shiny black, and these became fully ripe on day 28, which was approximately 2 d earlier than the timing found with the CK group (Fig. 1A). During fruit development and ripening, the ABA concentration showed clear uniform increases in the two groups at 3 d, which indicated a similar ripening process in both groups and an obvious effect of ABA application. Starting after 19 d, the ABA concentration increased rapidly until reaching a peak at 25 d and 28 d, respectively, which was earlier than the time at which full ripening was achieved in both groups (Fig. 1B). Furthermore, the ABA concentration in the CK group at each stage was lower than that in the treatment group (Fig. 1B). In contrast, after the initiation of ripening on the shrubs, the ripening fruit of the CK group at each stage displayed higher ethylene levels than those in the treatment group (Fig. 1C). Interestingly, the ethylene level in the CK and treatment groups peaked at 25 d and 28 d, respectively, and these time points were similar to those found for the peaks in the ABA concentration.
With the advent of fruit ripening, the PG activity in the CK group was lower than that in the treatment group before 19 d but then began to rise rapidly until fruit ripening at 30 d (Fig. 1D). Compared with that in the CK fruits, the activity of the PG enzyme in the treated fruits began to increase slightly and significantly after 3 d, showed a sharp increase after 19 d until ripening, and exhibited with a slight decrease at 28 d; however, the activity in the treated fruits at the end of the treatment period was significantly higher than that in the CK group (Fig. 1D). After coloration of the blackberry fruits, the EG activity in both the CK and ABA-treatment groups showed a similar declining trend before 19 d but then increased rapidly. The EG activity in the treatment group was significantly higher than that in the CK group from 19 to 28 d (Fig. 1E). Moreover, the total pectin content in the CK group remained essentially unchanged until 19 d but then declined sharply (Fig. 1F). In contrast,, the total pectin content in the treatment group decreased during the fruit development process after color conversion and increased slightly on 19 d; however, the total pectin level in the treated group at 19 d remained significantly lower than that in the CK group (Fig. 1F). The cellulose and hemicellulose contents in both the CK and treatment groups tended to show similar decreases during fruit development, and the decrease in the contents detected in the fruits belonging to the treatment group was greater than that found in the CK group (Figs. 1G and 1H).
RNA-seq and de novo assembly
Through transcriptome sequencing, we generated a total of 850,737,356 raw reads (Table S2). After the low-quality data were filtered and removed, 784,648,244 clean reads were obtained by de novo assembly. The lowest Q30 value obtained was 93.34% (Tr28), which indicated a relatively high sequencing quality. The total unigene number was 61,647 and the N50 value was 1,363. Moreover, the average length of the unigenes was 994 bp, and the majority of sequences—21,058 (34.16%)—ranged from 401 to 600 bp in length (Fig. 2A). In addition, 37,391 unigenes were successfully annotated using the NCBI nonredundant protein (NR), SwissProt protein (SWSS), Gene Ontology (GO), Eukaryotic Clusters of Orthologous Groups (KOG), and Kyoto Encyclopedia of Genes and Genomes (KEGG) public databases. Among these five public databases, the most unigene annotations were retrieved from the NR database, and the fewest were retrieved from the KEGG database (Fig. 2B).
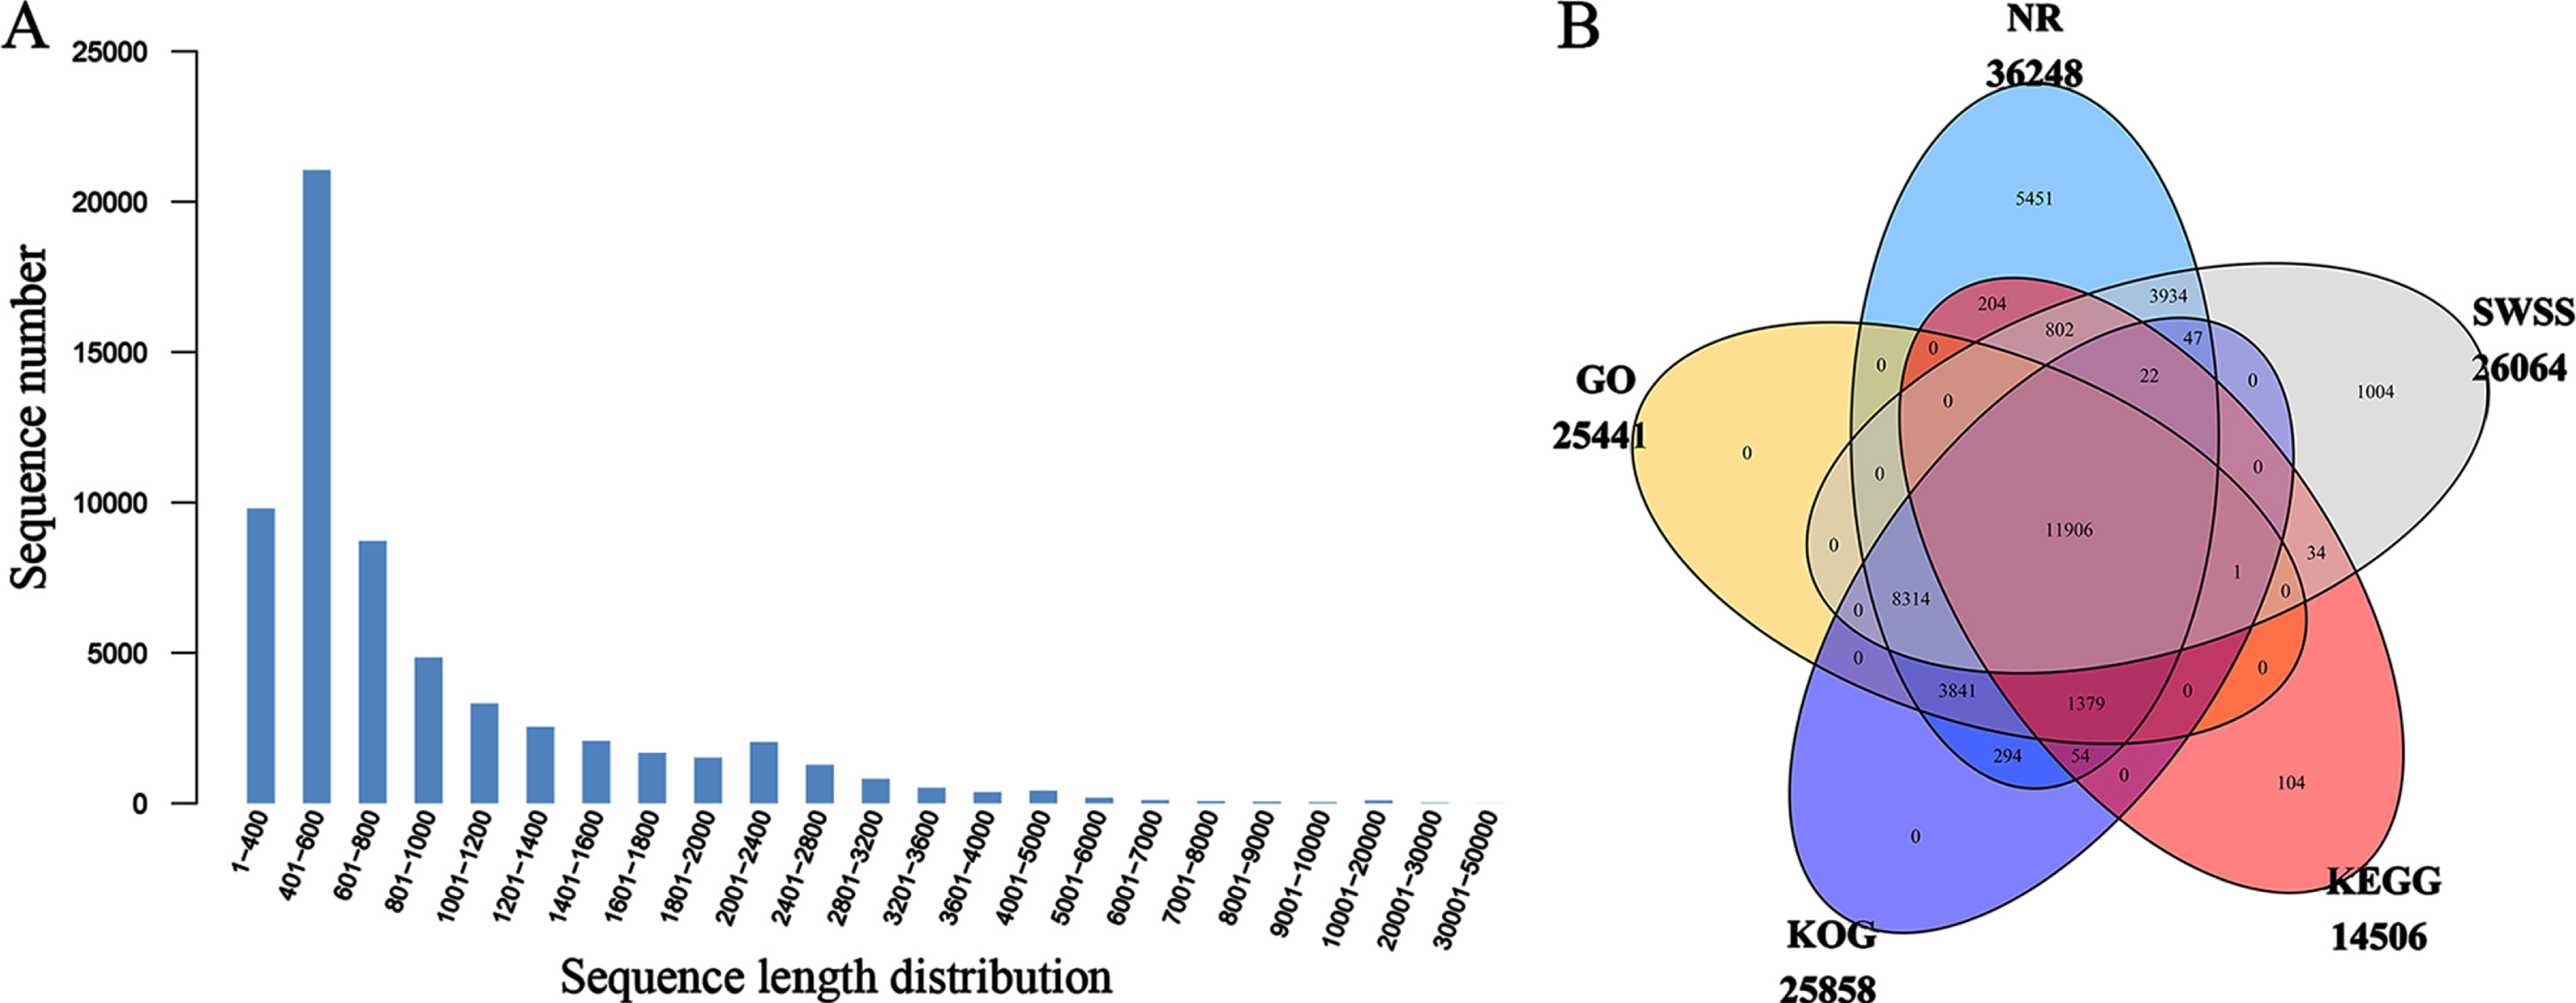
Sequence length and database annotation diagrams. A. Sequence length distribution diagram. B. Venn diagram showing the annotations obtained with five public databases: NR, SWSS, KEGG, KOG and GO.
To investigate the dynamic expression patterns of DEGs associated with blackberry fruit softening and ripening, we compared the transcriptome profiles at different time points. The reads per kilobase per million mapped reads (RPKM) values and unigenes whose expression was upregulated and downregulated at different time points were statistically analyzed (Fig. 3). The results showed that the number of DEGs in the CK group at different stages was higher than that at 0 d (Fig. 3A). The highest number of DEGs in the treatment group was found at 28 d compared with 0 d, and at this stage the expression of 2,927 and 3,069 DEGs were upregulated and downregulated, respectively (Fig. 3A). In addition, a comparison of the treatment and CK groups at 28 d revealed that the fruits exhibited high amounts of DEGs (8,153), including 5,160 and 2,993 upregulated and downregulated DEGs, respectively (Fig. 3B), and a larger color difference (Fig. 1A) was observed at the same time point. Therefore, it can be speculated that 28 d after treatment might be the key time point for detecting the largest difference in fruit ripening. Among the DEGs identified at this time point, the two highest numbers of DEGs (298 and 208) were enriched in ribosomes (ko03010) and carbon metabolism (ko01200). Notably, 127, 38, 35, 71 and 22 members were enriched in gluconeogenesis (ko00010), galactose metabolism (ko00052), fructose and mannose metabolism (ko00051), starch and sucrose metabolism (ko00050) and pentose and glucuronate interconversion (ko00040), respectively. Furthermore, 27 DEGs were enriched in phenylalanine metabolism (ko00360), and 38 DEGs were enriched in phenylpropanoid biosynthesis (ko00940). Another 21 DEGs were enriched in the regulation of the actin cytoskeleton (ko04810), and 59 were enriched in plant hormone signal transduction (ko04075). Additionally, seven DEGs were involved in flavonoid biosynthesis (ko00941). These DEGs might play important roles in the synthesis of substances such as cellulose and polyphenols, including flavonoids and anthocyanins, in fruits. Moreover, the global relationships among the 12 samples suggested that the DEG expression profiles at different stages of the treated and CK fruits exhibited similar expression profiles before 19 d (Fig. 3C). Subsequently, the expression profiles of the CK group and treatment group diverged and were distinct.

Number of DEGs and cluster tree of DEG expression in blackberry. A. Number of upregulated and downregulated DEGs in blackberry at different stages. B. Cluster tree of DEG expression in fruits at different ripening stages. C. Correlation dendrogram of 12 transcriptome samples after the different treatments.
The blackberry fruit in the treatment group matured and ripened earlier after ABA treatment than that in the CK group. To explore the molecular basis underlying these differences, 18 DEGs related to fruit softening and ripening, including genes related to cell wall architecture, ABA synthesis, dehydration, and the auxin response, were identified in the fruits at different stages between the CK and treatment groups (Table S1). Ten gene members showed significantly increased expression 28 d after treatment with ABA (Fig. 4), and these included two EG members (EG1 and EG2), four PG members (PG2, PG3, PG4 and PG5), three ethylene synthesis (1-aminocyclopropane-1-carboxylate oxidase, ACO) members (ACO1, ACO2 and ACO6), and one expansin-like B1 (EXP) gene. In addition, the transcript levels of PG1, ACO3 and ACO4 were also significantly increased at 25 d in the treated fruits. The expression levels of both plasma membrane intrinsic protein (PIP) and the NOD26-like intrinsic protein (NIP) gene were clearly downregulated in the treated fruits at 28 d, whereas the expression levels of the auxin biosynthesis-related gene tryptophan synthase beta chain (TRPB) and the ABA synthesis 9-cis-epoxycarotenoid dioxygenase (NCED) gene were uniformly upregulated at 25–28 d (Fig. 4). The expression of all 17 genes with the exception of ACO5 showed significant differences between the treatment and CK groups at a minimum of one-time point. The RPKM values for 18 DEGs related to the early maturation of different Navaho fruit samples are described in Fig. 4. The largest difference was clearly observed mainly 28 d after ABA treatment.
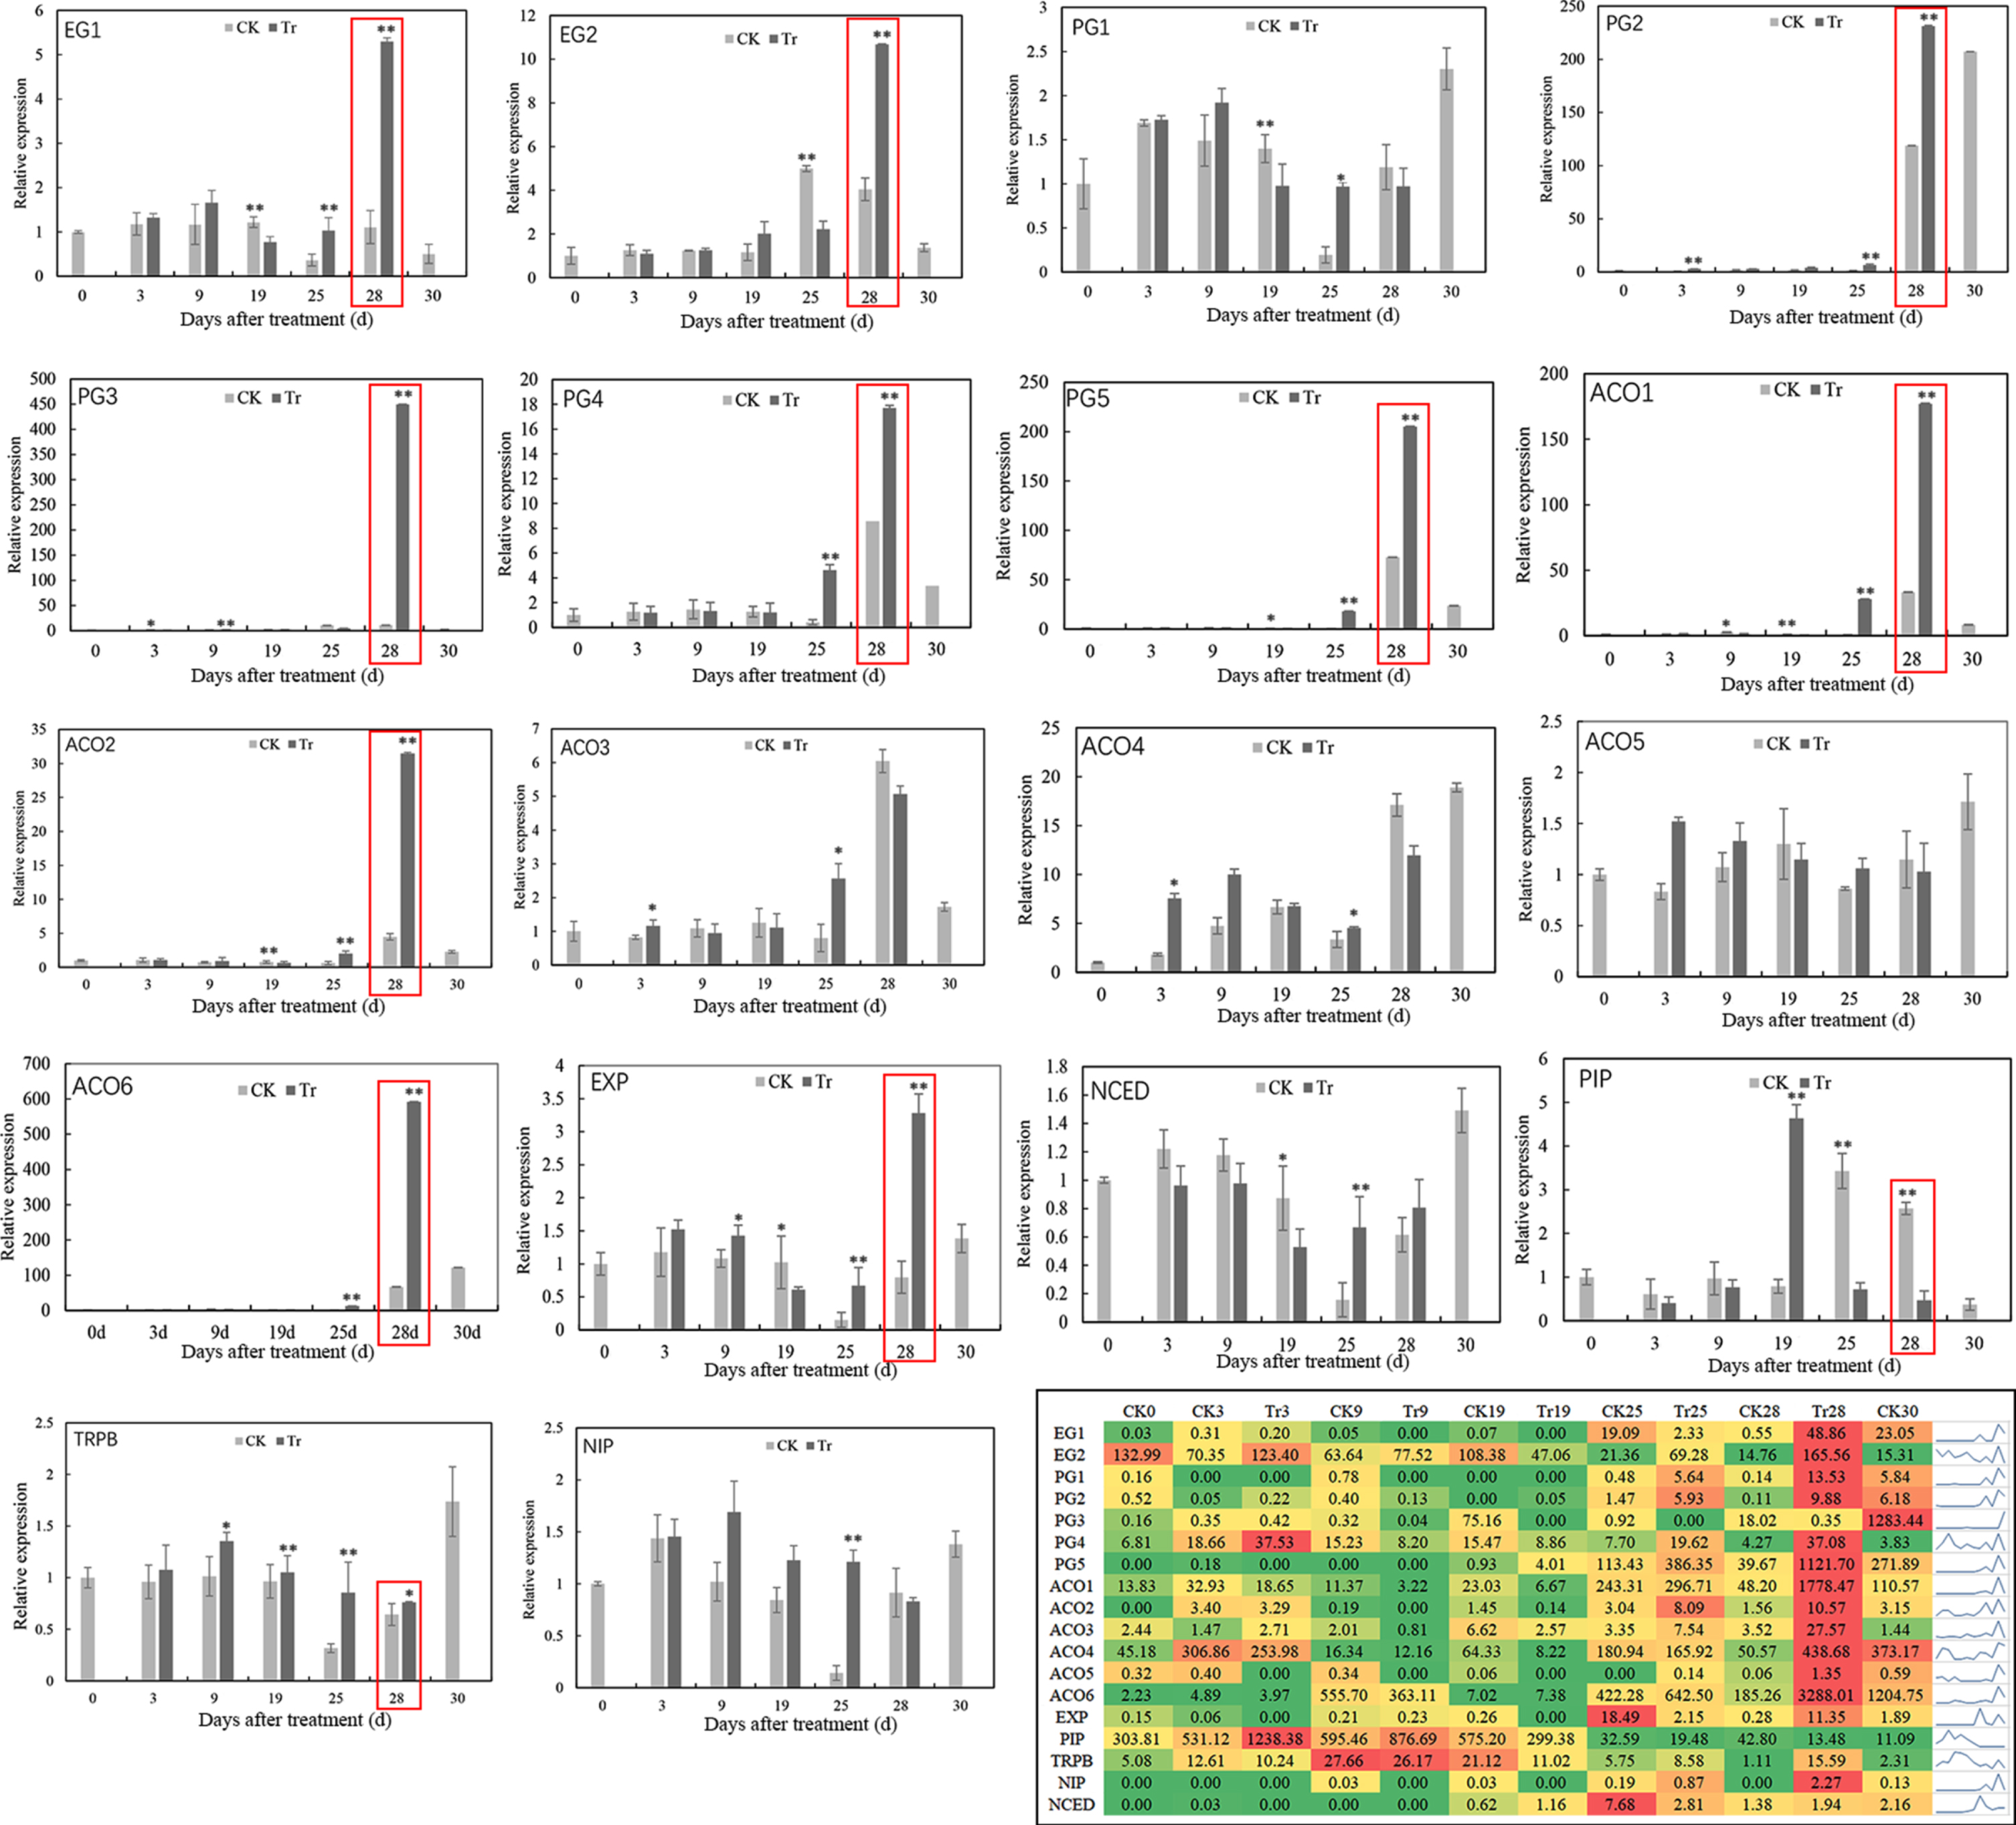
Analysis of the expression of 18 DEGs in the control (CK) and ABA treatment (Tr) fruits at different ripening stages.
A comparison of the number and expression levels of DEGs at different stages revealed that the treated and untreated fruits might exhibit relatively large differences in metabolites at 28 d after ABA treatment. Therefore, the ripening mechanism was determined by further UHPLC-MS studies using the two groups of fruits at 28 d, and a total of 1,101 metabolic substances (402 in the negative-ion mode and 699 in the positive-ion mode) were identified. After the original data collected via mass spectrometry were preprocessed, we imported the data into MetaboAnalyst for multivariate pattern recognition analysis. The spatial location of the six blackberry fruit samples was determined based on the differences in their metabolites, and the distribution of the three samples in the same group was relatively close [according to an overall principal component analysis (PCA), Figure S1A]. The differences in the PCA results showed that the distribution of the CK and treatment samples was different to a certain extent because the CK samples were concentrated and the treated samples were dispersed (Figure S1B). In addition, we used partial least squares-discriminant analysis (PLS-DA) (Figure S1C) and orthogonal projections to latent structures-discriminant analysis (OPLS-DA) (Figure S1D) to analyze and test the relevant metabolite information, and the results showed that the model was stable and not overfitted.
The variable importance in projection (VIP) value of the PLS-DA model (threshold≥1) was then used, and the p-values (p-value≤0.05) obtained from independent sample t-tests were combined to determine the differentially expressed metabolites. A total of 223 differentially accumulated metabolites (98 in the negative-ion mode and 125 in the positive-ion mode) were identified between the two groups, and these included 116 and 107 metabolites whose abundance was upregulated and downregulated, respectively, in the treatment group. In the positive-ion mode, the abundance of 125 and 78 metabolites was higher and lower, respectively, in the treated fruits. Moreover, the top three metabolites that exhibited a decrease in abundance were keracyanin (–7.8521-fold), neodiosmin (–5.5087-fold) and indole-3-acetamide (–4.9187-fold). We did not detect indole-3-acetic acid (IAA) among the compounds of the mature fruits, and thus, the marked decrease in the indole-3-acetamide abundance might reflect the maturation of the fruits. The decreased abundance of uridine 5’-monophosphate might also reflect the reduction in RNA nucleotides in the mature fruits. No differences in ABA metabolites were found between the treated and untreated fruits, whereas the abundance of catabolite abscisic acid glucose ester (ABA-GE) was clearly decreased in the treated fruits.
The metabolic pathways involving the 69 differentially accumulated metabolites within the two groups were ultimately annotated as associated with 100 different metabolism types and were distributed across five types of pathways: metabolism, genetic information processing, environmental information processing, cellular processes, and organismal systems. In particular, the top 20 compounds were mainly enriched in metabolic pathways, followed by 13 in the biosynthesis of secondary metabolites, whereas others were mainly related to various types of metabolism, biosynthesis and degradation. The analysis of the differentially accumulated metabolites revealed that five were involved in phenylpropanoid biosynthesis (ko01061), six were involved in flavonoid biosynthesis (ko00941), one was involved in anthocyanin biosynthesis (ko00942), one was involved in steroid hormone biosynthesis (ko00140), and one was involved in plant hormone biosynthesis (ko01070). The enrichment results indicated that most of the differentially accumulated metabolites identified in the positive-ion mode were mainly involved in the regulation of lipolysis in adipocytes, polycyclic aromatic hydrocarbon degradation, inflammatory mediator regulation of TRP channels, the cGMP-PKG signaling pathway and the cAMP signaling pathway in positive ion mode (Fig. 5A), whereas most of the highly accumulated metabolites identified in the negative-ion mode were involved in flavonoid biosynthesis (Fig. 5B). A correlation analysis of the differentially accumulated metabolites showed that carvone and 19-nortestosterone (Com_1105_pos and Com_628_pos), arachidonic acid and 3-methyl-5-oxo-5-(4-toluidino) pentanoic acid (Com_2026_pos and Com_58_pos), and roseoflavin and 1-(3-ethyl-2,4-dihydroxy-6-methoxyphenyl) butan-1-one (Com_1063_pos and Com_1770_pos) exhibited the most significant positive correlations (Figure S2). A cluster analysis of the samples was performed, and the compounds are shown on the left of Fig. 5. The blue color indicates low levels of the compound in the sample, and the red color indicates high levels (Figs. 5C and 5D).

Pathway and clustering diagram of differentially accumulated metabolites between the control and treatment groups. A and C. Pathway and clustering of metabolites in the treatment group identified in the positive-ion mode. B and D. Pathway and clustering of metabolites negative ion mode in the treatment group identified in the negative-ion mode. The horizontal axis represents the enrichment factor, that is, the ratio of the number of differentially accumulated metabolites enriched in a certain pathway to the background metabolites obtained by sequencing. The ordinate represents the function enriched by KEGG pathways: a larger the circle is associated with greater number of different metabolites enriched in the indicated function. The spectrum from blue to red represents the uncorrected p-values. Each row in the diagrams shown in C and D represents a compound, and each column represents a sample.
Fruit texture is a key breeding target for the production of horticultural fruits and affects the harvest, shelf life, transportation and processing of fruits [38]. The extremely short shelf-life of blackberry fruits is mainly due to the perishable softening flesh of the fruits [39], which strongly influences their postharvest and commercial use. Although the fruits of different blackberry cultivars have different shelf lives [40], the data on the intrinsic biochemical mechanism underlying blackberry fruit ripening and softening remain limited. Fruit softening is a ripening process accompanied by a series of physiological and morphological changes, including loss of hardness, change in color and accumulation of different nutritional substances [3, 41]. Thus, to reveal the molecular and metabolic events during the blackberry fruit softening and ripening processes that are regulated by ABA, we compared various physiological changes, including the activities of cell wall hydrolases and various substances, the levels of phytohormones, the expression of ABA-regulated genes and the accumulation of differential metabolites, between ABA-treated and CK fruits.
The coloring of berry fruits is generally considered the ripening point during fruit maturation. In our study, Navaho blackberry fruits developed for 30 d after fruit coloration and then fully matured, as manifested by their developing shiny black color (Fig. 1A). ABA application promoted fruit ripening earlier than 2 d. After coloration, ABA application seemingly exerted inconspicuous or minor effects on fruit ripening before 19 d, as demonstrated by the findings that the measured physiological indices showed small differences between the CK and treated fruits. These results coincided with the findings in a study on blueberry, which showed that exogenous ABA treatment before the initiation of fruit coloration exerted no obvious effects on fruit growth but stimulated fruit coloration [12]. Strawberry fruit weight and quality indices were also not affected under similar conditions, although the time frame of fruit ripening was shortened [24].
As important cell wall hydrolases related to fruit softening, the PG and EG activities showed sharper increases more sharply from 25 to 28 d in the ABA-treated fruits (Figs. 1D and 1E); this time frame coincided with the time frame at which a sharp decrease in the pectin and cellulose contents was detected, which indicated that ABA could stimulate the fruit ripening process by stimulating cell wall-degrading enzyme activities and cell wall disassembly (Fig. 1F-H). During grape fruit ripening, the activities of PG, pectin methylesterase (PME), and cellulase were significantly increased in the ABA-treated fruits, which indicated pectin modifications [42] and fruit hardness loss [43]. Furthermore, the processes of fruit softening and textural changes have three components: relaxation of the cell wall directly mediated by Exp1, polyuronide depolymerization and hemicellulose depolymerization [44].
During the ripening process, the ABA level peaked at 25 d in the treated fruits and at 28 d in the CK fruits, and both of these peaks which occurred prior to shiny black coloration and ripening (Fig. 1B). This finding might show the vital roles of ABA in fruit ripening and softening, as has also been found in non-climacteric berry fruits such as strawberry [9] and blueberry [12]. Endogenous ABA is associated with accelerated ripening because the ABA level increases rapidly at the beginning of fruit ripening and is strongly correlated with the accumulation of sugars, the reduction in acids, and the production of fruit pigments [45]. In contrast, the ethylene content decreased in the treated fruits, which indicated that ethylene might be inhibited by the increased ABA concentration because the ripening of Navaho fruits is likely independent of ethylene [46]. To date, the relationship between ethylene production and fruit ripening is not definite, with the exceptions that large differences in ethylene production have been detected among blackberry cultivars [47] and that fruits exhibit relatively high ethylene production are more readily abscised [46]. In addition, the plant hormone balance plays a crucial role in the control of fruit ripening [48], and GA3 is also involved in the onset of blackberry fruit ripening [26]. The differences in the ABA and ethylene contents between the treated and untreated fruits could be a consequence of different hormone biosynthesis pathways. In non-climacteric fruits, ABA plays a more dominant role, but the fruits still exhibit ethylene-dependent ripening characteristics [48].
The comparison of the treatment and CK groups were compared at the same sampling stages revealed that the fruits presented the greatest number of DEGs at 28 d; thus, 28 d might be the critical time for revealing differences in fruit ripening. At this time point, a large number of DEGs related to fruit ripening were annotated as being involved in various monosaccharide or polysaccharide metabolic pathways. For instance, 127 DEGs were involved in gluconeogenesis (ko00010), and 38, 35, 71 and 22 DEGs were involved in galactose metabolism, fructose and mannose metabolism (ko00051), starch and sucrose metabolism, and pentose and glucuronate interconversion (ko00040), respectively. These DEGs might play certain roles in the actions of various polysaccharides and further fruit softening and ripening. During strawberry fruit ripening, ABA-sucrose interactions affect the efficiency of ripening regulation due to synergistic effects and inhibits glycolysis [24].
In grape, ABA application modulated the levels of transcripts associated with cell wall modification, auxin and ethylene metabolism and responses [15]. NCED is the key enzyme involved in ABA biosynthesis in higher plants, and the concentrations of ABA are regulated by NCED [49]. Here, the expression of NCED was markedly increased at 25 d, which was consistent with the ABA concentrations in late-ripening fruits (Fig. 1B). ABA might drive fruit ripening to a relatively high level because the transition from the red stage to the black stage at 25 d was a critical period during which the endogenous ABA concentration marked increase (Fig. 1A and B). In strawberry pulp, the expression of FaNCED2 increased during stages at which increases in ABA concentrations are detected [50]. Marked increases in the transcript levels of cell wall degradation-related genes were detected in the exogenous ABA-treated fruits at 25 or 28 d, which indicated that these genes might be involved in the softening of blackberry fruits. Endogenous ABA might play a role in strawberry fruit color development during ripening through the upregulation of cell wall-degrading enzyme activity [8]. Furthermore, an increase in the upregulated expression of the auxin biosynthesis-related gene TRPB was also detected at 25–28 d, which reflects the accelerated fruit ripening of Navaho blackberry fruits starting at 25 d (Fig. 1A). In peach fruits, the transcript levels of ethylene biosynthesis-related genes, cell wall softening-related genes, and auxin biosynthesis-, conjugation-, transport- and perception-related genes were upregulated, which suggested accelerated ripening [29]. Zhang et al. [16] reported that exogenous ABA could increase the endogenous ABA concentrations in both the pulp and seeds of tomato to induce the expression of ethylene-related genes and promote fruit ripening. Our results also showed that the expression of the ethylene biosynthesis genes ACO1, ACO2 and ACO6 was clearly upregulated 28 d after treatment with ABA, whereas the expression of ACO3 and ACO4 was increased at 25 d (Fig. 4). Therefore, in blackberry fruits, ABA appears to promote fruit ripening by increasing the ABA concentrations in the treated fruits and inducing the expression of ethylene-, cell wall- and auxin-related genes. Functional studies involving transgenic plants are needed to further investigate the specific molecular mechanisms through which ABA regulates the ripening process of blackberry fruits.
The progression of fruit ripening or senescence is a complex process involving changes in the metabolic and physiological traits of fruits. Blackberry fruits contain high levels of anthocyanins and other phenolic compounds, mainly flavonols and ellagitannins [51]. Analyses of the ABA accumulation profiles during maturation have revealed that ABA might play a major role in controlling several maturation-associated processes in cabernet sauvignon grape berries, including coloration, sugar accumulation, and softening [27]. Metabolome-based pathway analysis can provide ideas for understanding complex BPs involved in plant biomass biosynthesis [52]. In our study, the comparison of the ABA-treated and CK groups identified 223 differentially accumulated metabolites. Although no difference in ABA metabolites was found between the treated and untreated fruits, the abundance of the catabolite ABA-GE was clearly decreased in the treated fruits. Interestingly, six of the differentially accumulated metabolites identified in this study were involved in flavonoid biosynthesis, and one differentially accumulated metabolite was involved in anthocyanin biosynthesis; both of these sets of metabolites serve as indications of changes in the flavonoid and anthocyanin abundances during fruit ripening and softening. ABA is involved in the regulation of many BPs related to maturation, such as cell wall metabolism, fruit softening, anthocyanin accumulation, and hormone synthesis [53]. In addition, steroid hormone and lignin synthesis exert synergistic regulatory effects [54]. Here, one differentially accumulated metabolite involved in steroid hormone biosynthesis (ko00140) and one differentially accumulated metabolite involved in plant hormone biosynthesis were identified, which indicated that these metabolites might be strongly involved in blackberry fruit ripening. Furthermore, five differentially accumulated metabolites were involved in phenylpropanoid biosynthesis, and these metabolites might thus play vital roles in lignin formation [55] and subsequently in future cell wall architecture and flavonoid biosynthesis, which compete with lignin biosynthesis for phenylpropanoid precursors [56].
In conclusion, the results of our study revealed the regulatory function of ABA in different pathways by displaying different ripening behaviors of blackberry fruit ripening. ABA tended to accelerate the ripening of Navaho blackberry fruits. In addition, ABA application did not affect fruit size but did stimulate the coloration process and thus fruit ripening. The effects of ABA on berry ripening were mainly reflected by increases in the endogenous ABA concentrations, the activities of cell wall-degrading enzymes, and the expression of key cell wall softening-related genes and hormone metabolism-associated genes, such as those involved in ABA and ethylene biosynthesis. Exogenous ABA might be associated with metabolic processes in blackberry fruits, such as cell wall softening, metabolite accumulation and hormone balance or interactions. To date, this study provides the first direct evidence showing the requirement for ABA during blackberry fruit ripening. Our data lay a foundation for elucidating the molecular mechanism through which ABA regulates the softening and ripening of blackberry fruits.
Footnotes
Acknowledgments
This work was supported by the National Natural Science Foundation of China [grant number 31600553] and the Earmarked Fund for Jiangsu Agricultural Industry Technology System (JATS[2020]453).
Funding
The authors report no funding.
Conflict of interest
The authors have no conflict of interest to report.
Data sharing
All raw data were submitted to the Short Reads Archive database under the accession number PRJNA680622.
