



Abstract
BACKGROUND:
Berry pomaces obtained after commercial juice production contain phytochemicals which may find use as antioxidants, food additives and biomedical products. Oil extraction from seeds provides additional value but the availability of phytochemicals before and after oil extraction is not well established.
OBJECTIVE:
This pilot study defines the content and composition of phytochemicals from raspberry and black currant pomaces after extraction with water-ethanol mixes, but also before and after milling/ oil extraction.
METHODS:
The total phenol (TPC), total anthocyanin (TAC) and antioxidant content of extracts was assessed. Their phytochemical composition was studied using liquid chromatography-mass spectrometry (LC-MSn).
RESULTS:
TPC and TAC increased with increasing % ethanol. Anthocyanins were major components in blackcurrant pomace and were more readily extracted than total phenols. Total oil content and composition was not influenced by solvent pre-extraction. Milling/ oil extraction markedly increased TPC from raspberry but not from blackcurrant pomace. LC-MSn confirmed characteristic phytochemical compositions and that increasing % ethanol increased yield of certain components. Milling increased specific ellagitannins, proanthocyanins and triterpenoids from raspberry.
CONCLUSIONS:
Milling/ oil extraction increased the yield and phytochemical diversity of extracts from raspberry but not from blackcurrant pomace which suggests that the phytochemicals from blackcurrant pomace are largely available on the pomace surfaces.
Introduction
The estimated annual world production of blackcurrants has been steady at ∼ 650,000 tons [1] over the last ten years with the majority grown in Europe. Although varieties for the fresh market (e.g., Big Ben [2]) have recently been developed to expand this sector, blackcurrants are primarily grown for juice production with some processing for purees, jams, and preserves. Global raspberry production has been rising steadily recently from 550 000 tonnes in 2010 to 850 000 tonnes in 2018 [1] with 75% of production in Europe. Raspberry consumption has more than doubled in the UK from 1995 to 2015 supported by a drive for increased class I cultivation for the fresh market [3] although class II fruits also supply the increasing popularity of raspberry juice products [4].
Juicing produces berry pomace as a consistent co-product (20–30% by weight) which is mainly made up from fruit pulp, skins, seeds, and stems [5]. However, these co-products often only find low value uses as animal feed or composting. As berry pomaces are rich in various phytochemicals as well as dietary fibre, there is scope for further valorisation. Studies have been carried out on incorporation of pomaces directly into functional foods with suggested potential health benefits (e.g., Raspberry [6–8] or Blackcurrant [9]). Blackcurrant pomace has been intensively studied in the context of extracting residual polyphenols, especially anthocyanins, which could be used as food grade antioxidants, colourants, or other functional food ingredients [10–12]. Research on valorisation of raspberry pomace has mainly focused on the characterisation and extraction of polyphenolic compounds [6] and incorporation as preservative additives in food [13].
While research has largely focused on polyphenolic compounds, both blackcurrant and raspberry seeds can be pressed to produce oils [14, 15] which can provide reasonable value. Blackcurrant and raspberry seed oil are a valuable source of essential fatty acids [16] with raspberry seed oil having good oxidation resistance and storage stability [15]. Blackcurrant seed oil can also be used as ingredient in infant formulas or as a dietary supplement in tablet form [16].
While extracting seed oil from berry pomace can provide added value to the producer, the extracted residue is still rich in phytochemical components. The aim of this study was to assess the extractability and diversity of these components from blackcurrant and raspberry pomace using food grade aqueous ethanol before and after oil extraction.
Materials and methods
Extraction of pomaces
Blackcurrant and raspberry pomaces were obtained in frozen form directly from Pixley Berries Ltd, Ledbury, Herefordshire, UK). Multiple batches of approx. 500 g were freeze dried in aluminium trays in a Christ freeze drier. The apparent moisture content of the pomace was determined by recording weights before and after freeze drying; blackcurrant = 48.3 +/- 0.2% and raspberry = 52.0 +/- 0.2% (n = 8). The batches were combined and mixed well before sampling. The % seed content was estimated by sieving at ∼ 52 and 75% of the dry mass of the black currant and raspberry pomaces respectively.
Triplicate samples of freeze-dried blackcurrant and raspberry pomace (20±0.1 g) were shaken in 150 mL solvent for 30 min with rotary shaking at 40 rpm at room temperature. The extractant mixtures used were ultrapure water (UPW), 10% ethanol (EtOH) in UPW, 50% EtOH in UPW and 50% acetonitrile (ACN) in UPW containing 0.1% formic acid. The pomace was then allowed to settle, the extract decanted into three 50 mL tubes and then centrifuged (2 500 X g, 10 min, 4°C). The supernatants for each sample were decanted and combined.
Total phenolic content (TPC) and total anthocyanin content (TAC) were measured in each extract using the method previously described [17] and expressed as μg gallic acid equivalents (GAE) for TPC and μg cyanidin glucoside equivalents (CGE) for TAC. Samples (1 mL) of each extract were pipetted into Eppendorf tubes and dried in the Speed-vac then stored frozen. When required, these samples were re-suspended in 0.5 mL 5% acetonitrile with 0.1% formic acid using vortex mixing and ultrasonication (5 min in iced water).
Extraction, determination of oil content and fatty acid composition
Oils were extracted as before [18]. Briefly, freeze-dried pomace in triplicate was ground in a coffee grinder for 30 s which resulted in a particle size <125μM. The ground residue (8 g +/- 0.05 g) was weighed into an extraction thimble. The pomace was extracted using Soxhlet apparatus with a 250 mL round-bottomed flask containing iso-hexane (150 mL) and anti-bumping granules for 1.5 h. The thimble was removed, and the ground material spread out and dried in a fume hood overnight to evaporate all traces of iso-hexane. The iso-hexane extract was evaporated on a rotary evaporator at 30°C and the mass of oil recorded. Both the oils and residues were stored at –20°C. This procedure was carried out on the original freeze-dried blackcurrant and raspberry pomace but also on the raspberry and blackcurrant pomaces that had been pre-extracted with 50% EtOH and 50% ACN.
The oil samples were trans-esterified into fatty acid methyl esters (FAMEs) and the FAMEs quantified using gas chromatography against a C23:0 methyl ester internal standard and a standard fish oil using the method described [18].
Extraction of components post-oil extraction
The ground residues which had been extracted for oil (1 g) were extracted in 50% EtOH in water (7.5 mL) for 30 min with shaking at 40 rpm at room temperature. The samples were then centrifuged (2500 X g, 10 min, 4°C) and the supernatant decanted. This procedure was carried out on the oil-extraction residues of the original blackcurrant and raspberry pomaces (Original Milled) but also the pomaces that had been pre-extracted with 50% EtOH before milling and oil extraction (Pre-EtOH Milled). Extracts were assayed for TPC and TAC and prepared for LC-MSn as described above.
Ferric Reducing Ability of Plasma (FRAP) Assay
The extracts were analysed by the FRAP assay as described previously [17]. To ensure response in the central part of the standard curve, the water and 10% EtOH extracts were assayed at a final incorporation of 20%, and the 50% EtOH or 50% ACN extracts at 5%.
Analysis of components using Liquid Chromatography Mass Spectrometry (LC-MSn)
The resuspended extracts were transferred to filter vials fitted with pre-slit silicon septa caps (Single Step 0.45μm PTFE vials; Thomson Ltd, Oceanside, California U.S.A.). The samples were stored in the auto sampler at 6°C and analysed within 72 h of extraction. HPLC separations were performed with a Thermo Accela 600 HPLC system coupled with an Accela PDA detector (Thermo-Fisher Ltd, Hemel Hempstead, U.K.). The HPLC was operated at a flow rate of 300μL/min. A Synergi Hydro RP (150×2mm, 4μm particle size) column pre-fitted with a 4×2mm C18Aq guard column (Phenomenex Ltd. Macclesfield U.K.) was maintained at a temperature of 30°C. The solvent A, 18.2 MΩ.cm deionised water (ELGA-PureLab option-Q, Elga Ltd., High Wycombe U.K.), and solvent B, HPLC grade acetonitrile (Fisher Scientific Ltd. Loughborough U.K.) were acidified with 0.1% [v/v] mass spectrometry grade formic acid (Fisher Scientific Ltd. U.K.). A sample injection volume of 10μL was employed in partial-loop mode. The gradient programme was as follows: hold 2% B 0–2 min, 2–5% B 2–5 min, 5–45% B 5–25 min, 45–100% B 25-26 min, hold 100% B 26–29 min, 100–2% B 29–30 min, hold 2% B 30–35 min. Autosampler syringe and line washes were performed with 80% HPLC grade acetonitrile. The HPLC column eluent was first monitored by the Accela PDA detector where spectra were collected in wavelength/absorbance mode from 200–600 nm with a filter bandwidth and wavelength step of 1 nm, and filter rise time of 1 sec, the sample rate was 10 Hz. Additionally three channel set points were employed, Channel A 280 nm, Channel B 365 nm, Channel C 520 nm, with a bandwidth of 9 nm and a sample rate of 10 Hz.
The PDA detector eluent was next transfered to the Thermo LCQ-Fleet mass spectrometry system operated under Xcalibur software (Thermo-Fisher Ltd, U.K.). Mass spectra were collected in full scan (m/z 80–2000) centroid mode for quantitaitve analysis. In addition, a data-dependent analysis secondary scan event was applied to collect MS2 CID (35% normalised collision energy, 0.25 Activation Q, 30 ms activation time) fragmentation spectra based upon the top three most intense ions as defined within the preliminary full MS scan. The MS2 data were used to confirm compound identity. A scan speed of 3 microscans every 10 ms was apllied in the LCQ and the Automatic Gain Control was set to 2000. Prior to the analytical run, the LCQ was auto-tuned to optimise conditions for the detection of cyanidin-3-O-glucoside in positive mode and quercetin-3-O-rutinoside in negative mode. The ESI conditions were optimised to allow efficient ionisation and ion transmission without causing insource fragmentation. The following settings were applied to ESI: Spray voltage –3.5kV (ESI-) +4kV (ESI+); Sheath gas 60; Aux gas 20; Capilary temperture 380°C. A control blank sample was analysed at the start and end of the analytical block, thus providing a measure of the sample back-ground and a measure of compound carry over throughout the sample run. In addition, accurate mass (profile mode) data were obtained for selected samples using an Accela 600 HPLC-PDA-LTQ Orbitrap XL mass spectrometer (Thermo Scientific, Hemel Hempstead, UK) applying matching chromatographic and MS conditions as described above [19].
The three-dimensional (intensity×m/z×time) HPLC-MS raw data profiles were converted (or deconvolved) into a vector of peak responses (extracted peak areas), where a peak response is defined as the sum of intensities over a window of specified mass and time range (e.g. m/z = 102.1±0.1 and time = 130±30 s). The deconvolution and calculation of peak area was performed using Thermo Xcalibur Quan software using standard criteria.
Statistical analysis
Analytical values are expressed as averages of triplicates +/- SE. Statistical differences were assessed using Student T-test in Excel.
Results and discussion
General composition
The TPC and TAC of blackcurrant pomace extracts increased with increasing amounts of ethanol (Table 1). We used 50% aqueous acetonitrile (ACN) as it has been shown to achieve near complete extraction of TPC and TAC in our previous work (e.g. [20, –22]). We limited examination of ethanol (EtOH) to 50% (v/v) for practical reasons and to limit costs. Notably TPC in blackcurrant extracts increased with ethanol content but only reached ∼40% of the total extracted with ACN, whereas TAC reached ∼80% of the ACN-extractable value at 50% ethanol. The TAC/TPC ratio of the blackcurrant extracts rose from 0.33 in the water extract to 0.41 in 10% EtOH then dropped to 0.26 in 50% EtOH and 0.13 in 50% ACN. This illustrates that anthocyanins are more readily extracted in water than other phenolic components, which require solvents such as ethanol/ acetonitrile for extraction.
Total phenol and total anthocyanin contents from blackcurrant and raspberry pomace extractions
Total phenol and total anthocyanin contents from blackcurrant and raspberry pomace extractions
TPC in μg GAE/g DW; TAC in μg CGE/g DW. Values are averages of triplicate extractions± SE. Samples within each group with different superscript letters were significantly different at p < 0.01 (T-test). *Values in italics are the estimated values for TPC and TAC if the concentration due to oil removal was the only factor involved. Surface = whole pomace extracted with 50% ethanol; Original Milled = ground sample after oil extraction then extracted with 50% ethanol; Pre-EtOH Milled = pomace which had been pre-extracted with 50% EtOH then re-extracted with 50% EtOH after milling and oil extraction.
The TPC from the raspberry pomace increased slightly from water to 10% ethanol and increased markedly with 50% ethanol but also only reached ∼40% of the ACN-extractable value. TAC in raspberry was much lower than in blackcurrant extracts but once again the TAC/TPC ratio was higher in the water and 10% EtOH extracts (0.07) than the 50% EtOH and ACN extracts (0.04).
The original pomace and the residues after extraction with 50% EtOH or ACN were milled then extracted for oil as described above. The oil content of the pomaces (∼ 17% blackcurrant and ∼10% raspberry) did not change with pre-extraction with either 50% EtOH or ACN (see Supplementary data; Fig. S1). The composition of the oil was as expected for raspberry and black currant seed oils (see Supplementary data, Table S1) with high levels of linoleic acid, γ- and α-linolenic acid in blackcurrant oil ([18], and linoleic acid and γ-linolenic acid in raspberry oils [15]. Also, oil composition was unaffected by pre-extraction by EtOH or ACN.
The milled oil-extracted residues were re-extracted with 50% EtOH. Notably the TPC of the 50% EtOH extracts from raspberry pomace samples after oil extraction (Original Milled) was significantly higher (4.3-fold) than from the unmilled pomace. The pomace after oil extraction is more concentrated due to the removal of oil and oil contents of ∼ 17% (blackcurrant) and ∼10% (raspberry) amount to 1.21- and 1.11-fold concentration, respectively. Taking this into account, the TPC was still 3.8-fold higher than the surface available material which may reflect the higher surface area of the milled raspberry material and/or possibly the greater accessibility of certain components due to the milling and/or hexane extraction. The 50% EtOH extract from the milled and oil extracted blackcurrant original pomace (Original Milled) also gave a higher TPC than the 50% EtOH “surface” extracted pomace. However, this increase was essentially the same as the degree of concentration caused by the removal of oil. Overall, these figures suggest that the majority of the phenolics were largely available on the surface of the blackcurrant pomace. However, oil extraction/milling markedly increased extractable phenolic yield from raspberry.
The TPC values for the ACN extracts (∼6.7 mg/ g FDW) from the whole raspberry pomace were in the same range as those noted for similar non-milled pomace extracted with 70% methanol previously (i.e., 8 mg GAE/ g DW; [23]). In addition, if we assume that milling would have increased the extraction by acetonitrile to the same extent as ethanolic extraction (e.g., 4.3-fold) then the predicted value for TPC at 28.8 mg GAE/ gDW is in the same range as noted previously for milled raspberry pomaces [6, 13]. Previous reports of TPC from milled blackcurrant pomace give similar values as noted here e.g., ∼ 10 mg GAE/ mL [24, 25]. Previous studies which separated seeds from blackcurrant pomaces have noted that the non-seed material had most of the phenolic content [11, 24]. Similar studies on raspberry pomace [26] showed that the extractable total phenol content was similar between the seeds and the non-seed material.
There was a strong correlation between the TPC and FRAP figures for the blackcurrant pomace extracts (R2 = 0.99; Supplementary Data, Fig. S1A). Such correlations have been noted before often with varying trend line slopes reflecting the different composition of different berries [17] and are not unexpected as the Folin reaction and the FRAP assay both are electron transfer-based assays and measure similar aspects of antioxidant activity [27]. There was also a strong correlation between the TPC and FRAP values for the raspberry extracts (R2 = 0.92; Fig. S1B), but it was notable that the ACN extracts lay above the trend line suggesting that they may be enriched in components that are more effective antioxidants.
The blackcurrant pomace extracts were dominated by the presence of the four main anthocyanins characteristic of blackcurrants, the rutinosides and glucosides of cyanidin and delphinidin [20, 29] (Fig. 1a and Table 2) as well as some minor anthocyanins. There were also flavonol derivatives that were more apparent when the profiles at 360 nm were examined (see Supplementary data; Fig. S2). These were rutinosides, glucosides and malonyl glucosides of myricetin (M), quercetin (Q), kaempferol (K) and isorhamnetin (IR) as described previously for blackcurrant fruit extracts and juices [21, 29]. Flavonol aglycones were also present in high abundance, which is rare in fruit extracts, but have been detected commonly in commercial juices and may arise by deglycosylation of parent glycosides through use of commercial cell wall lysing enzymes [11, 30]. Indeed, two hydroxycinnamic acids were also identified, p-coumaric acid and caffeic acid, which are also rarely seen in blackcurrant fruit extracts, which may also arise by enzymatic treatment during juicing. In general, extraction with increasing ethanol content increased the levels of most peaks but there was variation in the extractability of different components. The notable increase in the “hump” of UV absorbance between 13 and 18 mins did not coincide with m/z signals in positive or negative mode but has been associated with proanthocyanins in previous work [31].

UV profiles (280 nm) of the blackcurrant pomace extracts. BC ACN = acetonitrile extract, BC50 = 50% EtOH extract, BC10 = 10% EtOH extract, BCW = water extract. FSD = full scale deflection. Labels for peaks match those in Table 2.
Putative identification of major components in raspberry and blackcurrant pomace extracts
ET = ellagitannin; EC = epicatechin; Ef = epiafzelechin; EGC = epigallocatechin; PAC = proanthocyanidin; TTPN = triterpenoid glycoside; * = doubly charged ion; a- negative mode MS data, b –CS = ChemSpider reference number; c - Knapsack reference number. Values in bold are the main MS2 fragments. Putative identities for ellagitannins supported by A- Gasperotti et al 2010, B- Mullen et al., 2003, C- McDougall et al. 2014. Identities for PACs supported by D- Sun et al. 2014, E- Aaby et al. 2007 and F- Gu et al. 2003. Triterpenoids supported by G - McDougall et al. 2017A and H - McDougall et al. 2017, blackcurrant compounds by I = McDougall et al. 2005, J = Abreu et al. 2020, K = Allwood et al. 2019.
The raspberry pomace extracts contained many components (Fig. 1b, Table 2) previously identified in raspberry fruit extracts and juices [22, 32–36]. The anthocyanin content was low and the profiles at 520 nm are inset to show the anthocyanin peaks between 10 and 14 min. The profiles were dominated by the major ellagitannins, Sanguiin H6 and Lambertianin C, with smaller amounts of other ellagitannins, ellagic acid derivatives and proanthocyanidins [22]. As noted by comparison of the full-scale deflection values, there was a marked increase in extractability between 10% and 50% EtOH. The anthocyanins were well extracted using water and 10% EtOH, which suggests that they are more readily extractable than the other phenolics.
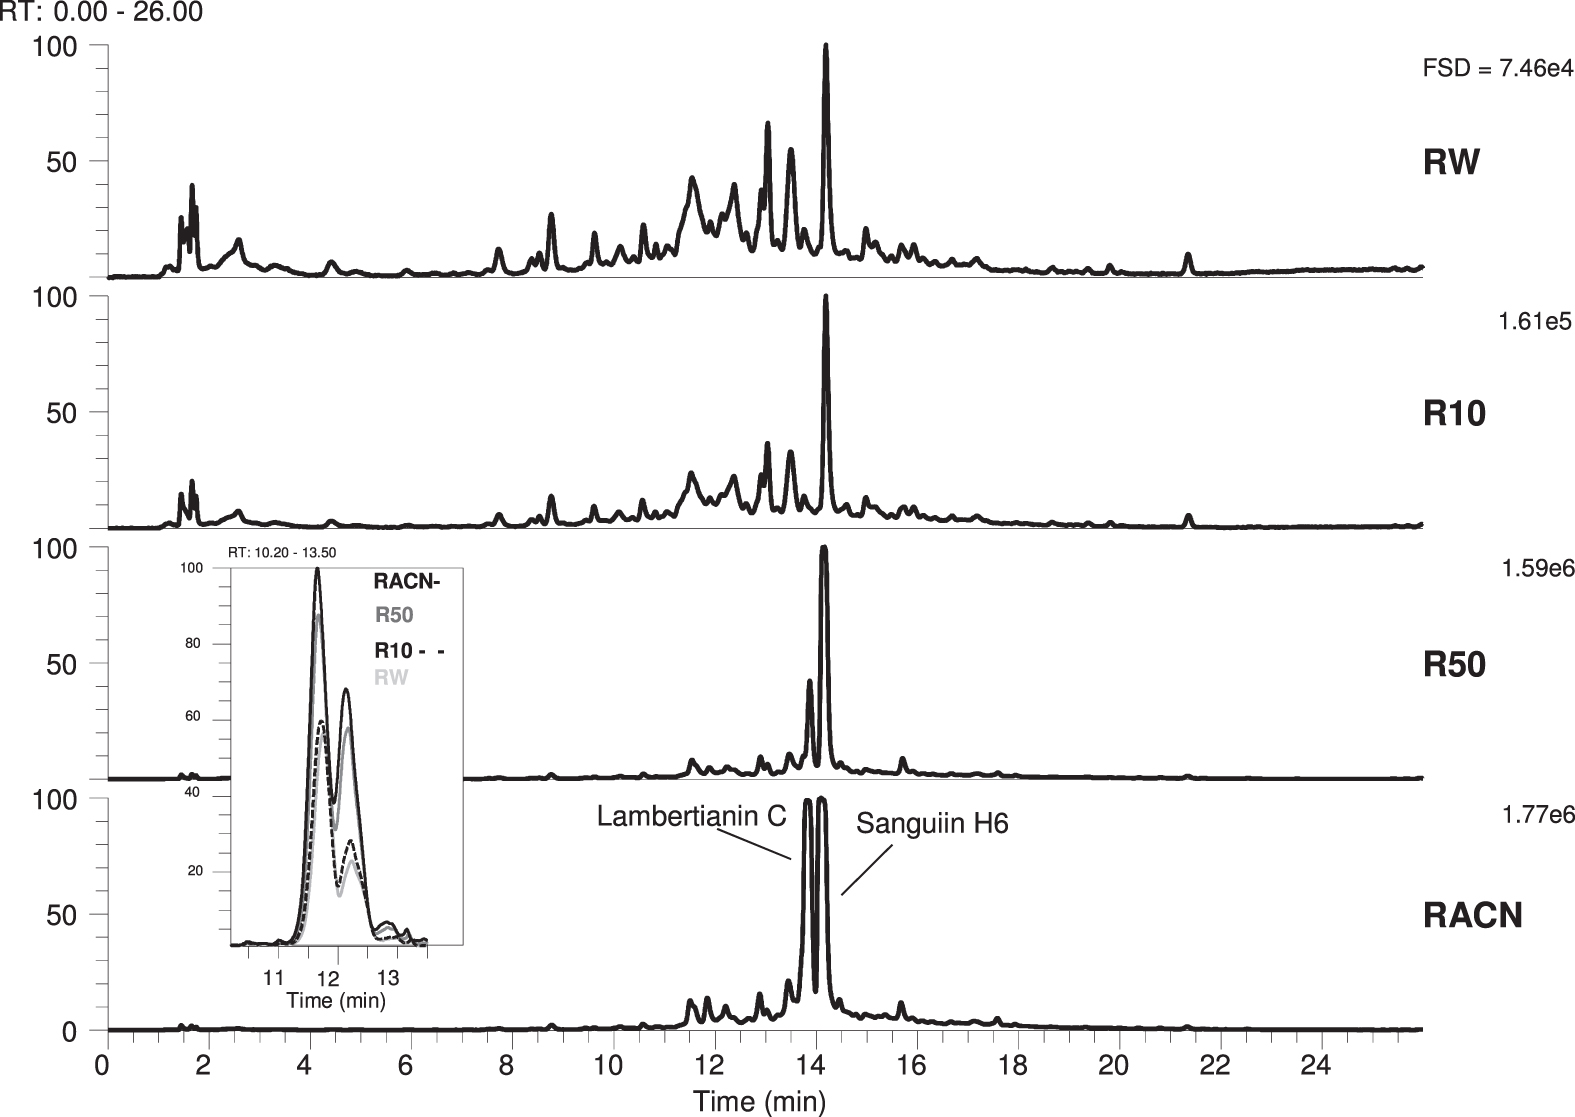
UV traces (280 nm) of raspberry pomace extracts. RACN = acetonitrile extract, R50 = 50% EtOH extract, R10 = 10% EtOH extract, RW = water extract. FSD = full scale deflection.
Examining the MS profiles of the raspberry pomace extracts (Fig. 1c), there were later eluting components which were not apparent in the UV traces. These were putatively identified as triterpenoid (TTPN) derivatives from previous work [19, 37]. The TTPNs were also differentially extracted by the different solvent treatments. Most of the TTPNs eluting between 19 min and 21 min (including triterpenoid T1) did not increase in abundance with increasing solvent content whereas the TTPN peaks from 21 –26 min (including triterpenoid T2) did. This is illustrated by an expanded view of this region (see Supplementary data; Fig. S3). Indeed, the relatively high extractability of most TTPNs from raspberry pomace in low % ethanol solutions was used as starting point to facilitate their purification from polyphenolic components for bioactivity studies [19].
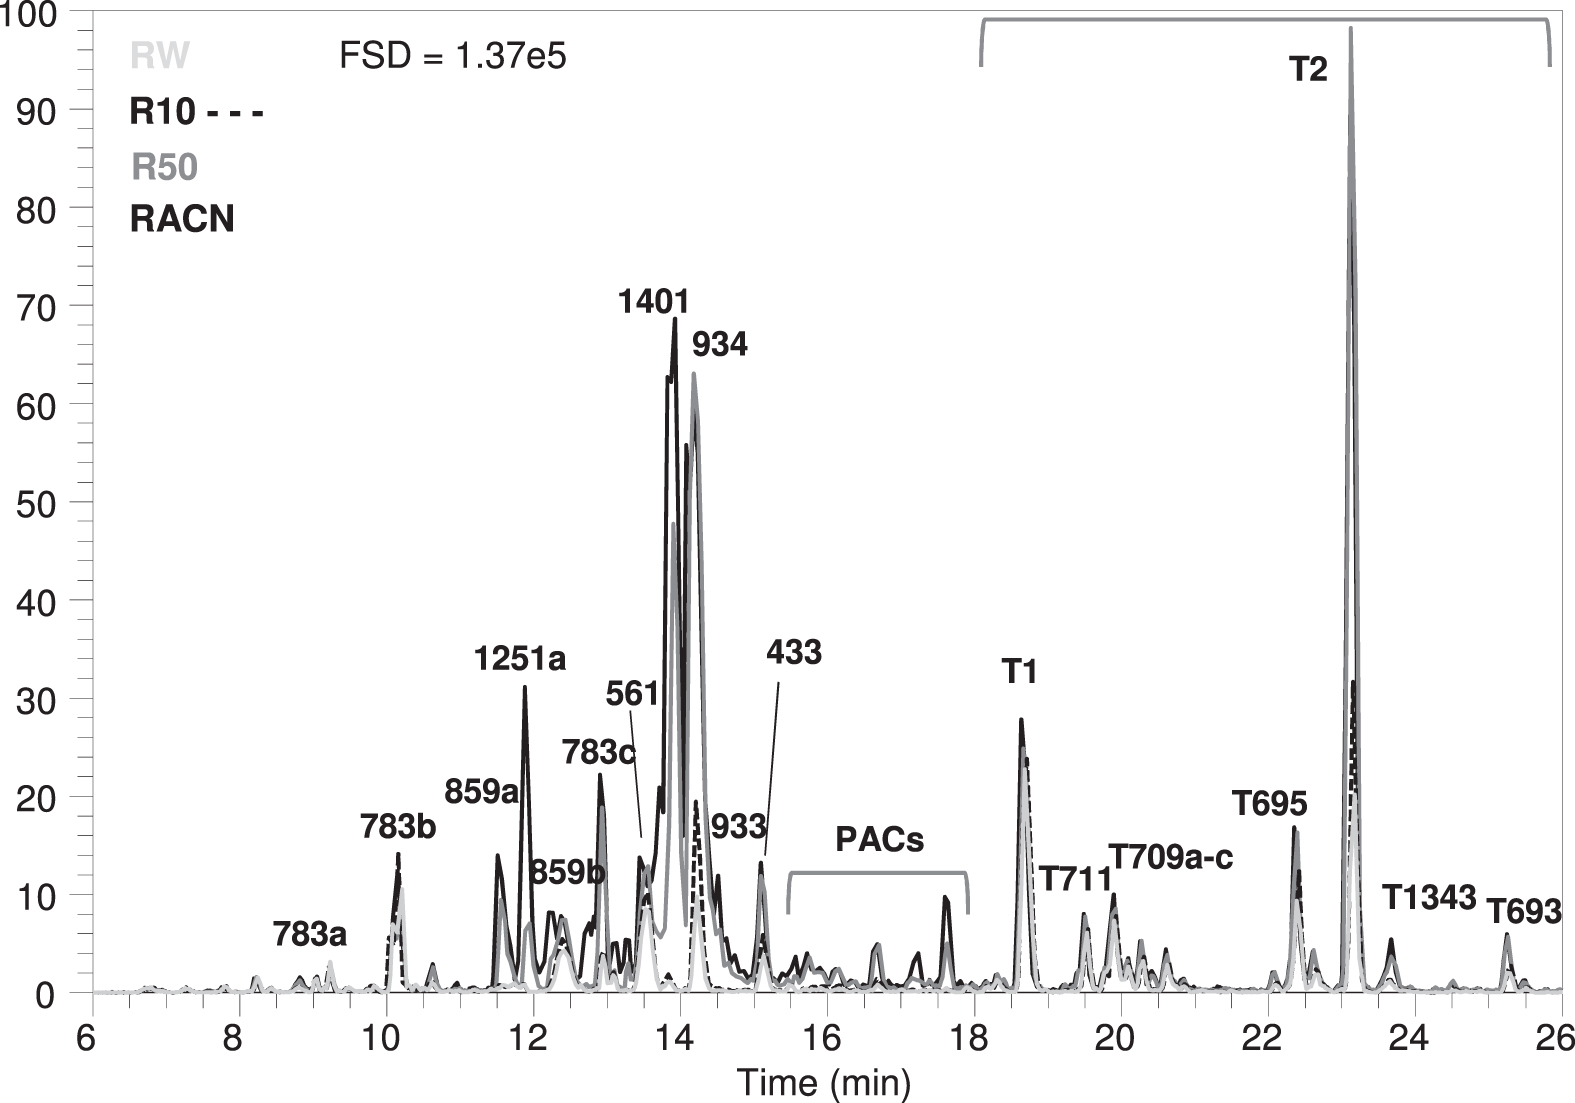
MS traces (negative mode) of raspberry pomace extracts. RACN = acetonitrile extract, R50 = 50% EtOH extract, R10 = 10% EtOH extract, RW = water extract. FSD = full scale deflection. Labels match with Table 2.
The relative abundance of the black currant components is shown in Fig. 2a. All the anthocyanins increased in abundance with increasing amounts of ethanol then ACN, and notably the coumaroylated hexoses increased in abundance ∼ 10-fold in 50% EtOH over water, compared to ∼ 4-fold for the cyanidin and delphinidin hexoses and ∼ 2.5-fold for the rutinosides. That anthocyanidin rutinosides were more readily extracted in water than their glucoside counterparts has been noted previously for blackcurrant pomace [31].
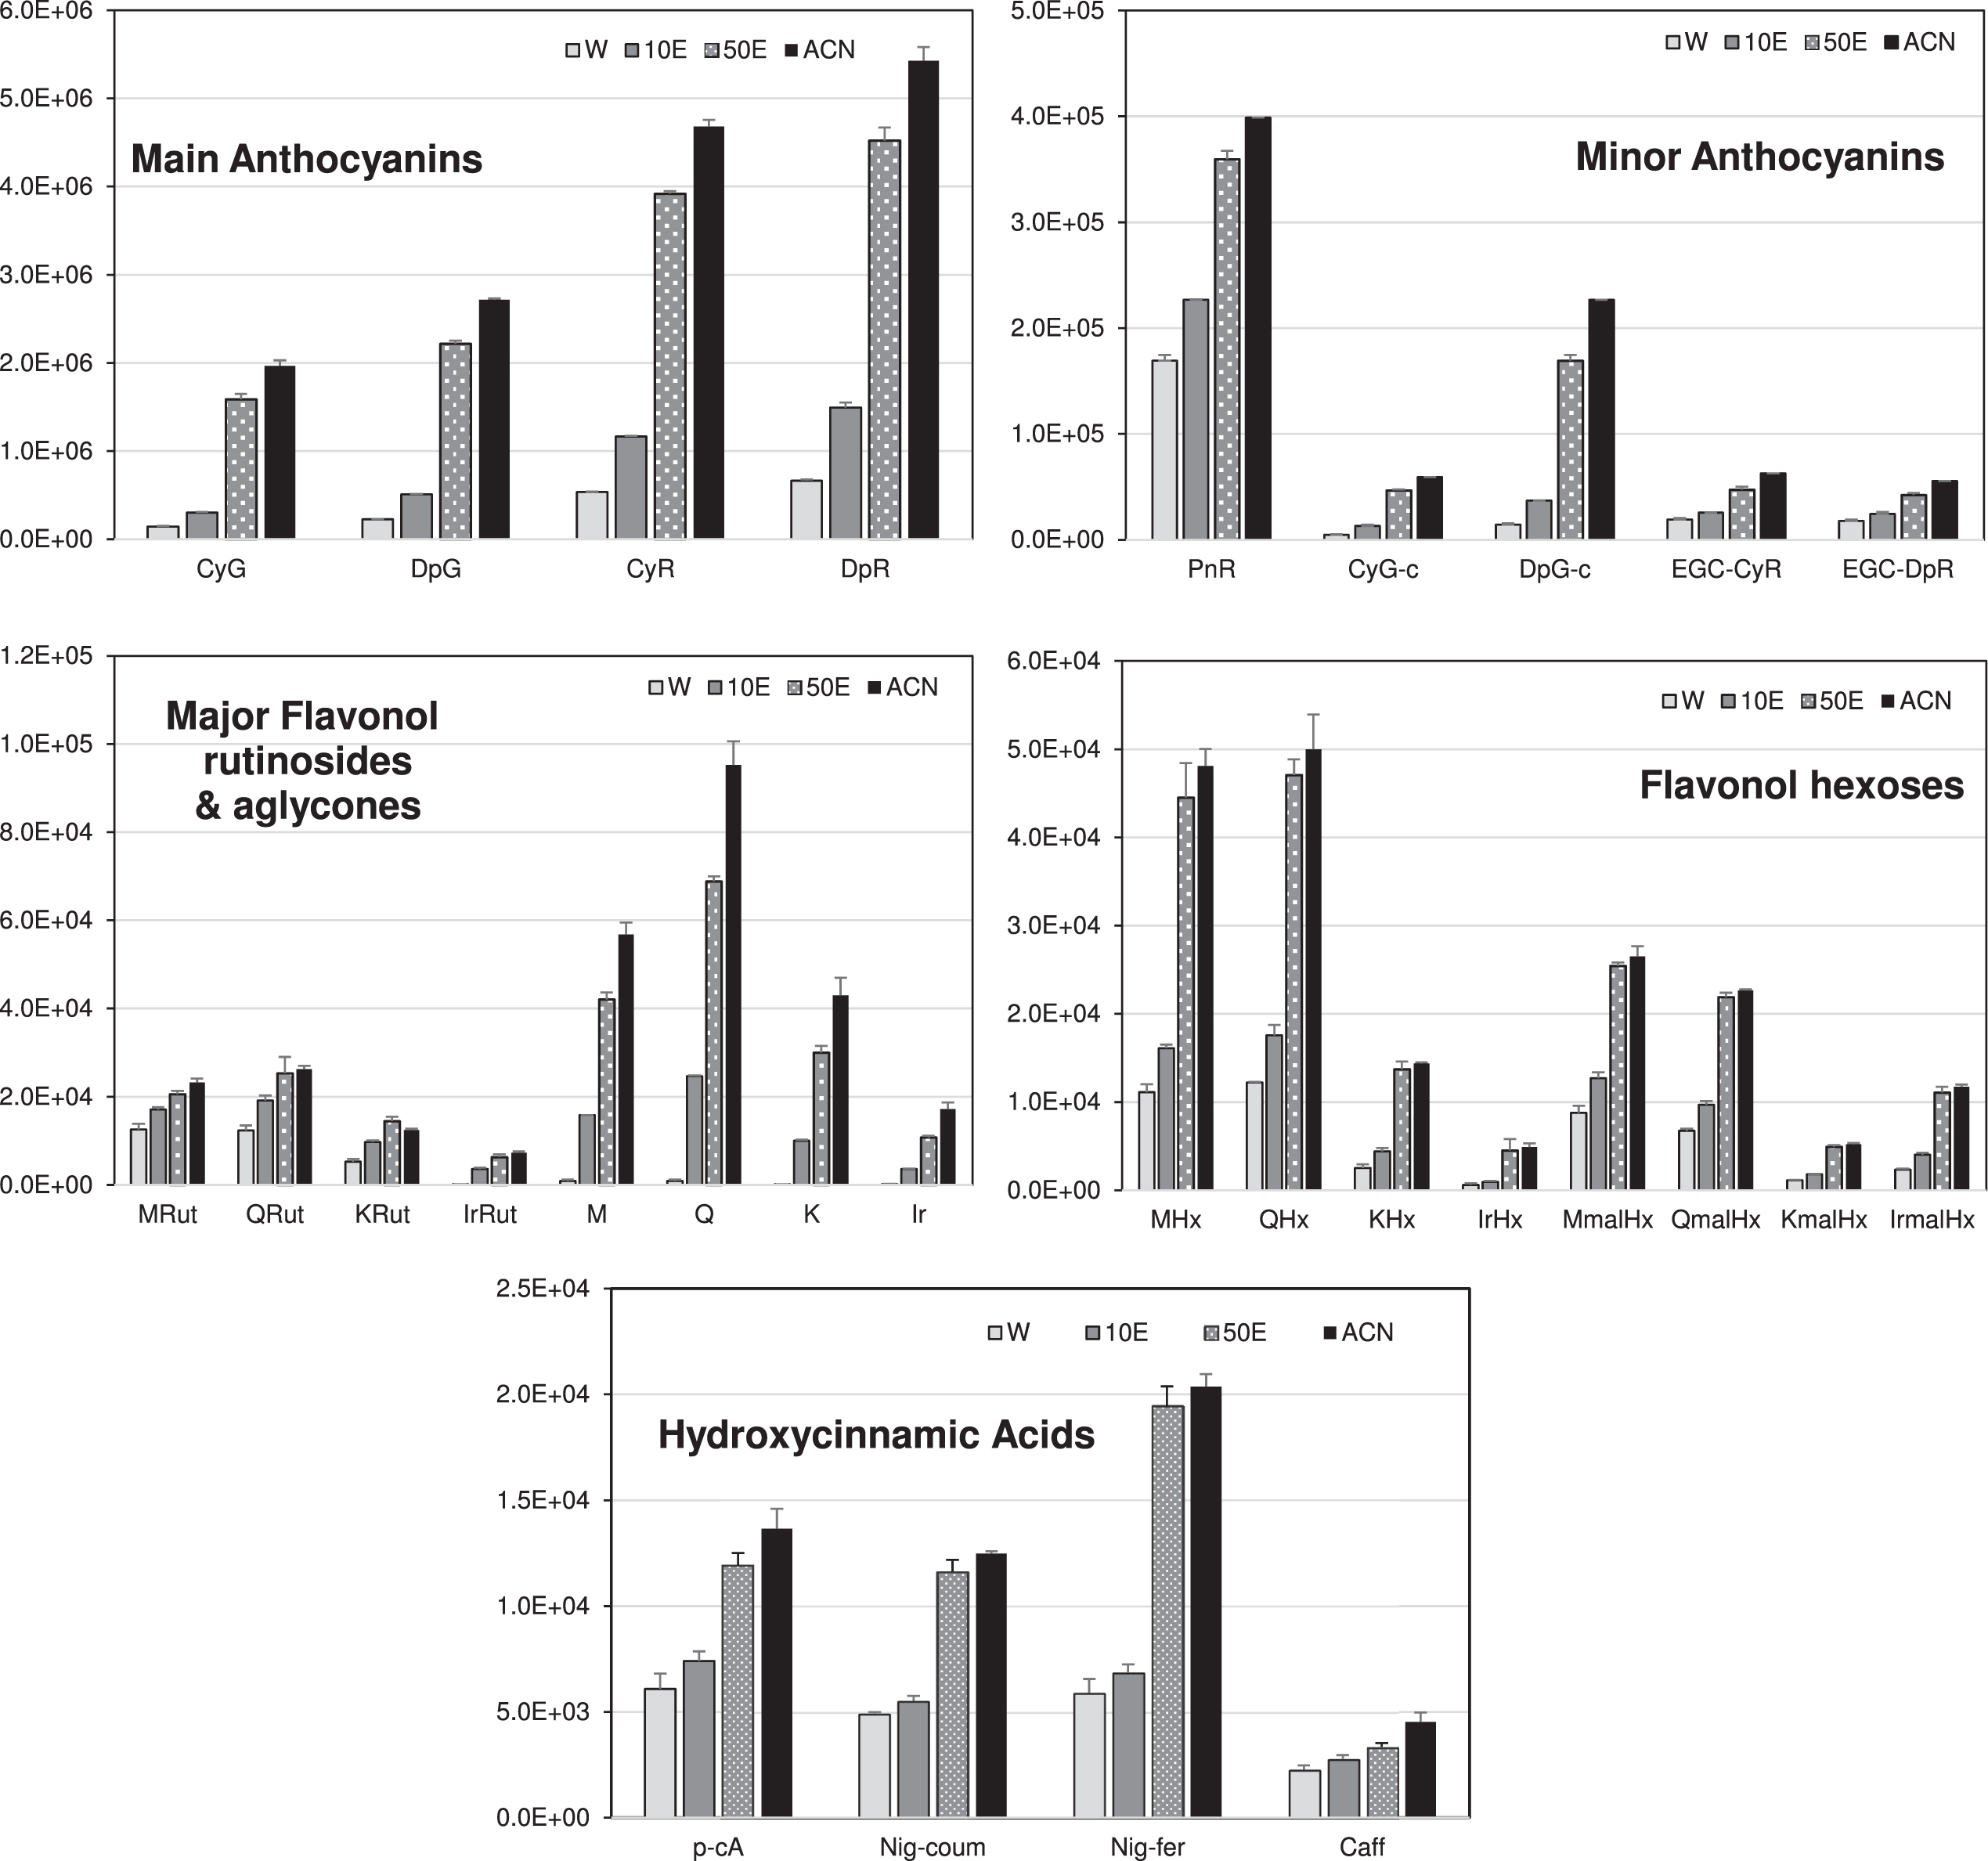
Relative abundance of blackcurrant pomace components. ACN = acetonitrile extract, 50E = 50% EtOH extract, 10E = 10% EtOH extract, W = water extract. Labels match with Table 2.
The levels of all flavonol components increased with ethanol and ACN extraction. Notably, myricetin (M) and quercetin (Q) hexoses increased ∼ 4-fold from water to 50% EtOH, kaempferol (K) hexose (Hx) by 5.5-fold and Isorhamnetin (Ir) Hx by 7.5-fold, an order which may be related to the hydrophobicity of their aglycones. Malonylated flavonol hexoses showed similar increases to their hexoses. Flavonol rutinosides also showed this pattern with M and Q rutinosides (M & QRut) increasing ∼2-fold and KRut 2.7-fold but IrRut ∼50-fold. However, this large fold increase probably reflects the very low extraction of IrRut in water. The flavonol aglycones showed the highest fold increases with M at 48-fold, Q at 75-fold, K at 240-fold and Ir at ∼65-fold, which may be related to their inherent hydrophobicity. The hydroxycinnamate derivatives had smaller fold increases (e.g., 1.5-fold for caffeic acid, 2-fold for p-coumaric acid (pCA), and 2.5-fold and 3-fold resp. for nigrumin coumarate and ferulate).
In raspberry pomace (Fig. 2b), the anthocyanins were minor components, and increases were effectively pro-rata with the TAC values (see Supplementary data; Fig. S4). The smaller proanthocyanidins and epicatechin (EC) showed relatively small increases, e.g., the dimers at m/z 561 and 577 increased 1.5-fold in 50% EtOH over water; Fig. 2b) whereas trimers increased between 4- to 10-fold and pentamers by 6- to 8-fold. However, the ellagic acid (EA) derivatives and ellagitannins (ETs) showed the largest differences; with ellagic acid at 17-fold, EA pentoside at 14-fold and Sanguiin H6 at 7-fold. The ellagitannin peaks with m/z 859 increased by 50- and 65-fold, the m/z 1251 peaks by ∼250-fold and Lambertianin C by 450-fold. Again, these increases likely reflect the relative hydrophobicity of the components.
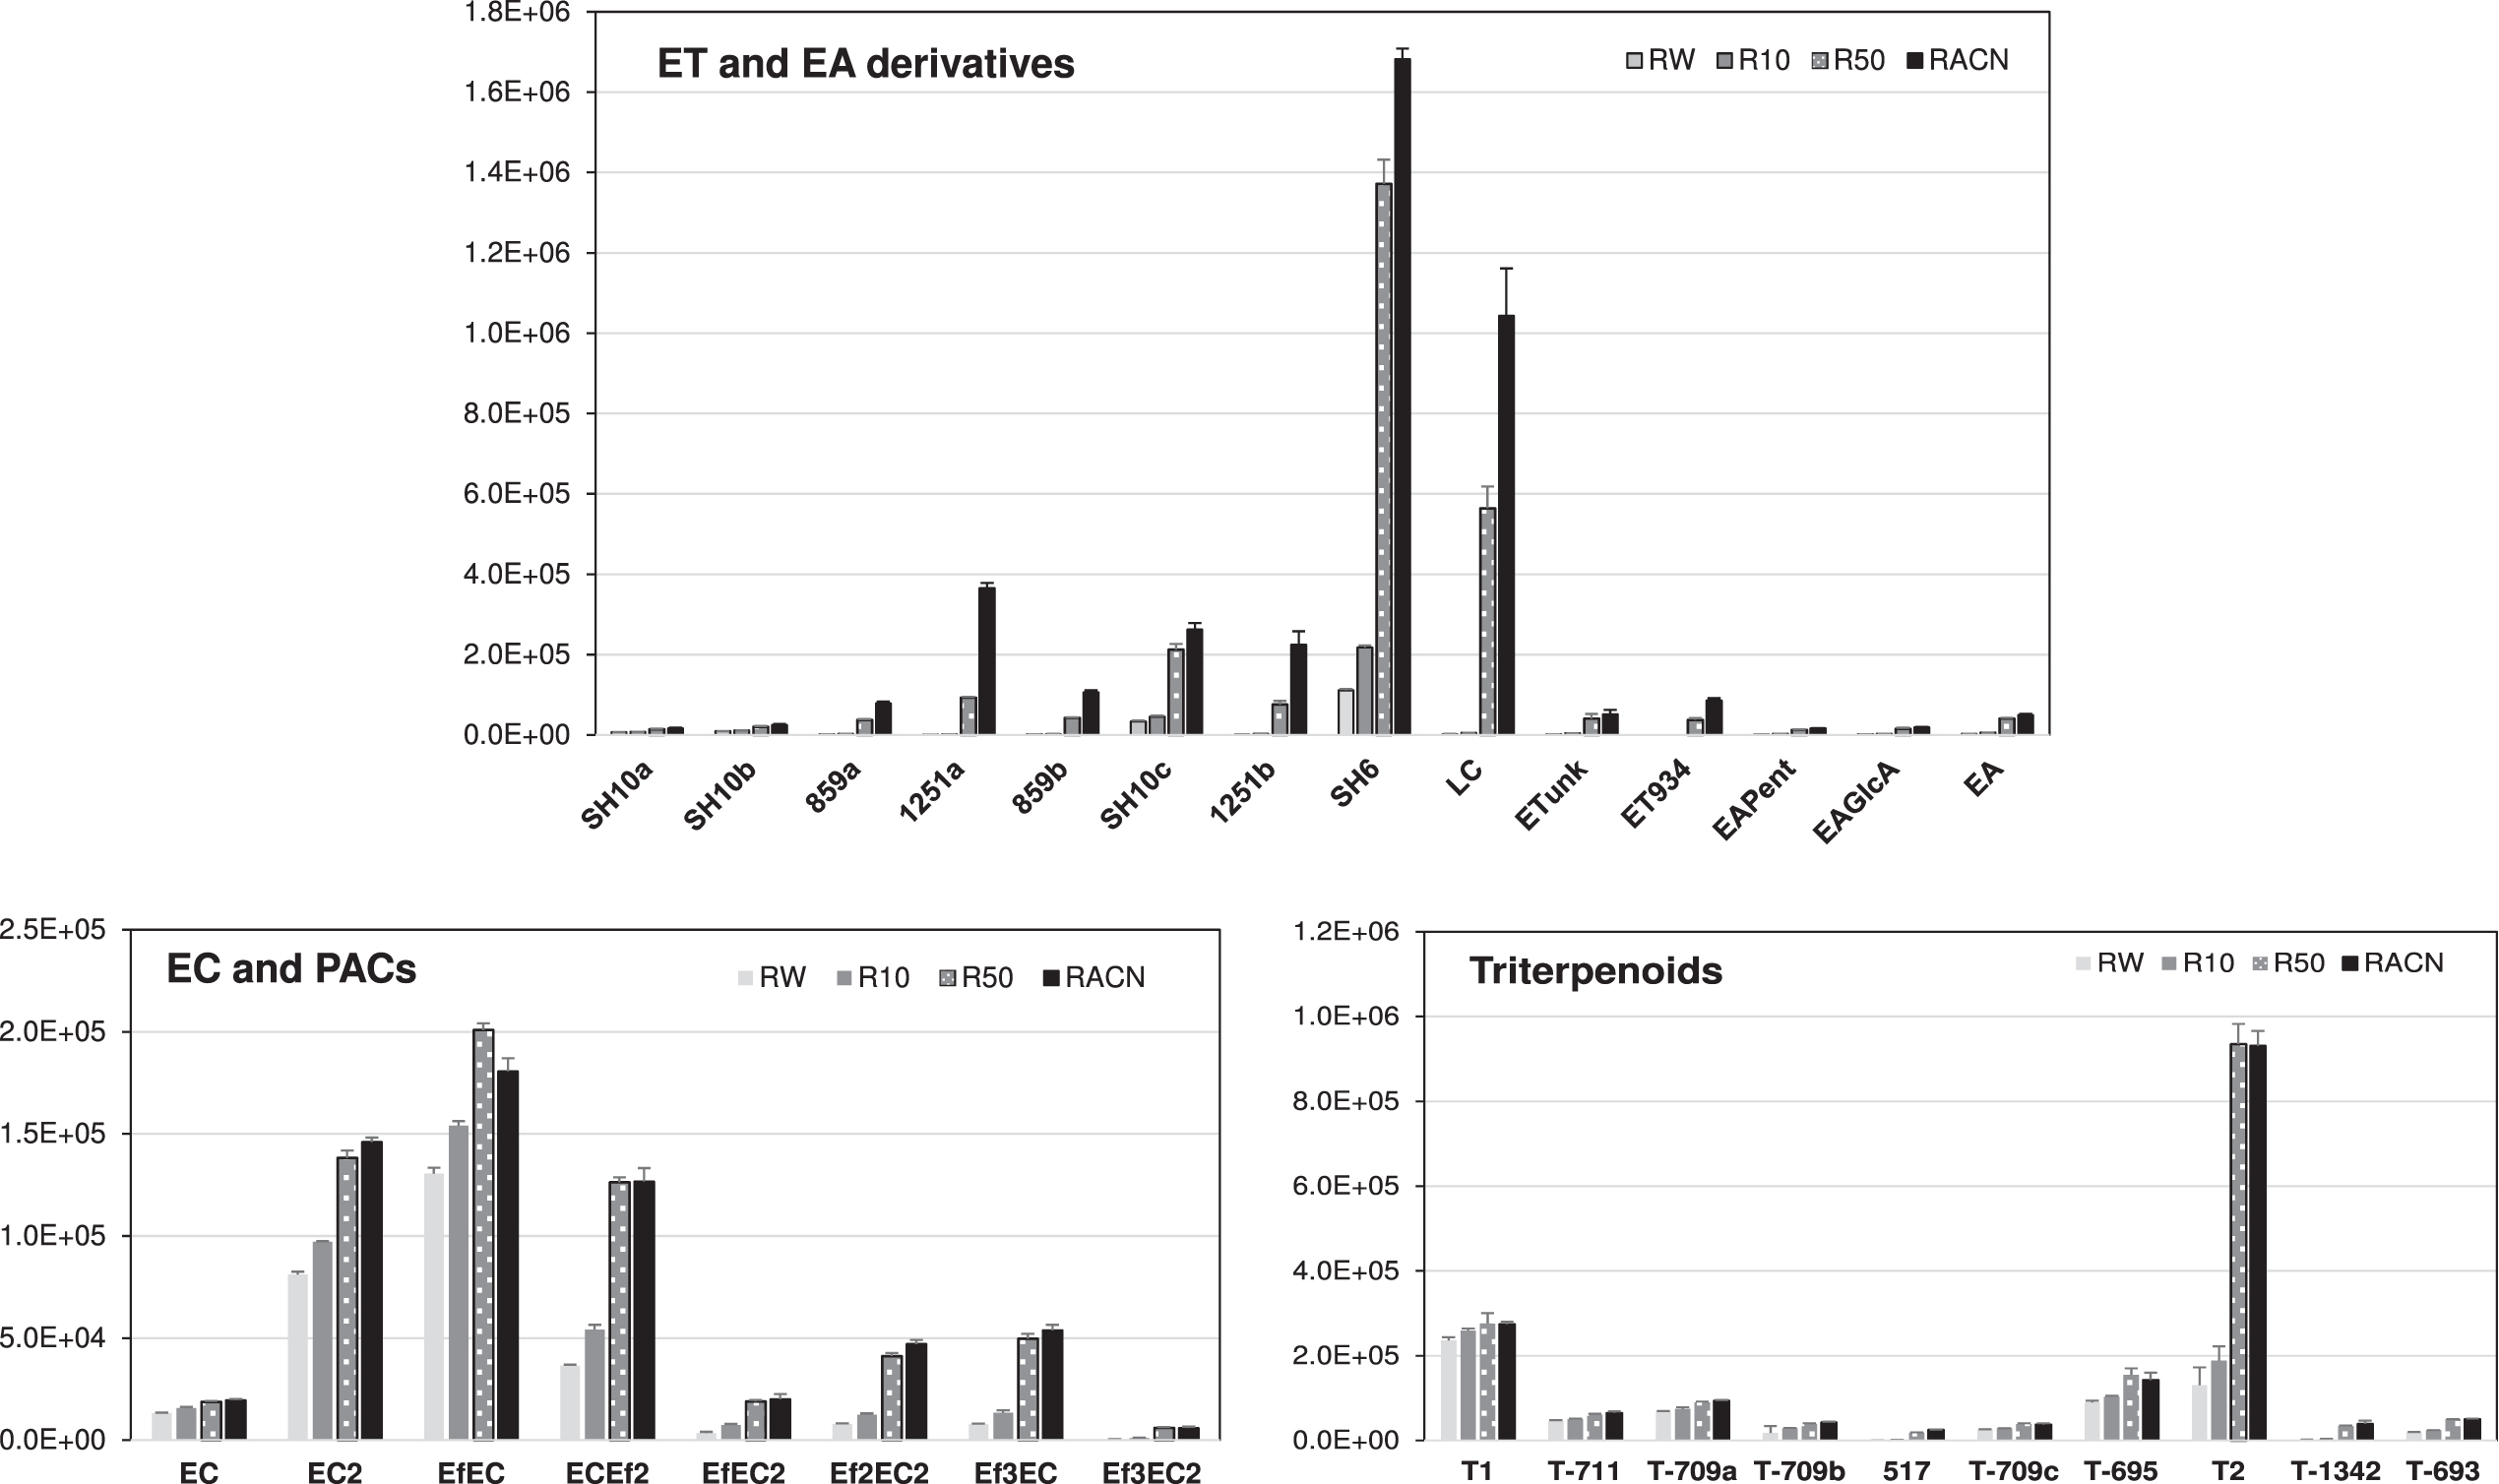
Relative abundance of raspberry pomace components. RACN = acetonitrile extract, R50 = 50% EtOH extract, R10 = 10% EtOH extract, RW = water extract. FSD = full scale deflection. Labels match with Table 2.
For the triterpenoid (TTPN) glycosides, there were 2 main responses. Some components only increased slightly in 50% ethanol over water e.g., peak T1 at m/z 679 and m/z 709 increased ∼1.5-fold, m/z 711 by 3-fold and m/z 695 and 693 by ∼2.2-fold. However peak T2 increased 5-fold and the TTPN aglycone with m/z 517 by 30-fold.
The raspberry 50% ACN extracts showed a higher FRAP value c.f. TPC over the other raspberry pomace extracts (supplementary Fig. S1). Looking at the differences between the 50% EtOH and ACN extracts, the abundance of larger ellagitannins stands out (Fig. 2b). For example, Lambertianin C and the ellagitannins with m/z values of 1251 and 859 were all markedly higher in the ACN extracts. Lambertianin C is known to be a major contributor to the antioxidant capacity of raspberry fruit extracts [38]. Larger ellagitannins may be more effective as antioxidants because their extended ring structures allow them to delocalize electrons more readily [39]. Notably none of the TTPNs were significantly increased in the ACN extracts over the 50% EtOH extracts and so probably did not contribute to their observed higher antioxidant potential.
In blackcurrant pomace, the same components were largely present before and after milling/ oil extraction (Fig. 3a). In agreement with the TPC and TAC figures (Table 1), only slightly higher levels were available after milling and oil extraction, which was reflected in the similar FSDs (Fig. 3a). However, this increase can be accounted for by concentration due to removal of the oil. Indeed, there were only a few qualitative differences in the profiles before and after oil removal, with the most striking being the increased levels of three early eluting peaks (<5 mins) that could be identified by their MS properties as S1 - a mixture of leucine and isoleucine, S2 -adenosine and S3 - guanosine. As expected, pre-extraction (i.e., BCM-50) reduced the yield obtained after oil extraction but there were few qualitative differences in composition. This strongly indicates that the availability of most phenolics from blackcurrant pomace was not influenced by milling.
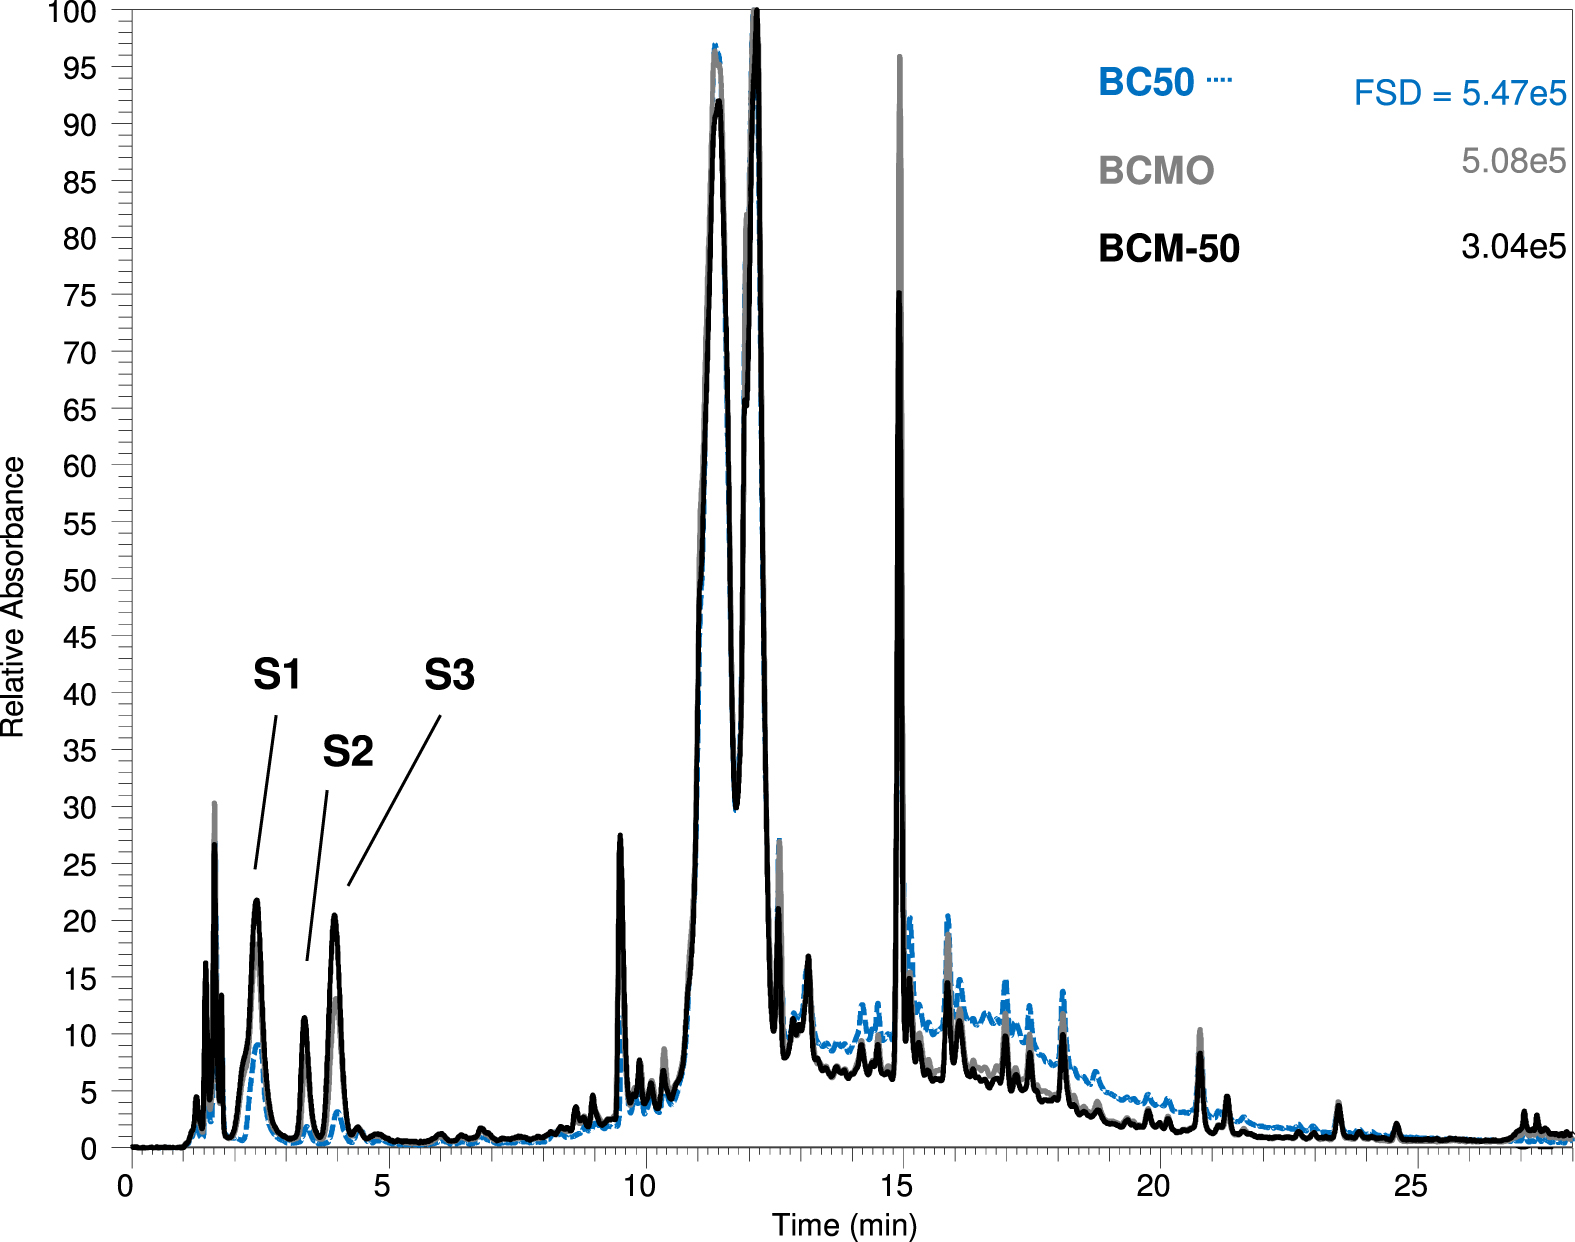
Effect of milling/ oil extraction on blackcurrant pomace extracts. BC50 = 50% EtOH extract, BCMO = original milled extract, BCM-50 = Milled, pre-extracted with 50% ethanol. Labelled peaks are discussed in the text. FSD = full scale deflection.
There were large differences in the yield of many raspberry components after oil extraction/milling (Fig. 3b). Many components were increased in the oil extracted material probably due to enhanced surface area due to milling and opening of the seed structure. Although some ETs and PACs were enhanced, not all were increased. The abundant ET peaks with m/z values of 1401 (Lambertianin C) and m/z 934 (Sanguiin H6) were present at similar levels in the 50% EtOH extract from the original unmilled pomace and the milled/ oil extracted pomace. This suggests that these ellagitannins were largely available on the surfaces of the pomace. However, most other ellagitannins increased in abundance by between 2- to 8-fold and the levels of smaller proanthocyanidins were also increased (e.g. the dimers at m/z 561 and 577 increased 2- to 4-fold) whereas trimer to pentamer proanthocyanidins increased between 5 and 15-fold. These components may be more abundant within the seed structure. The early eluting peaks S1 –S3 noted in the blackcurrant extracts were also present in the milled raspberry pomace extracts.
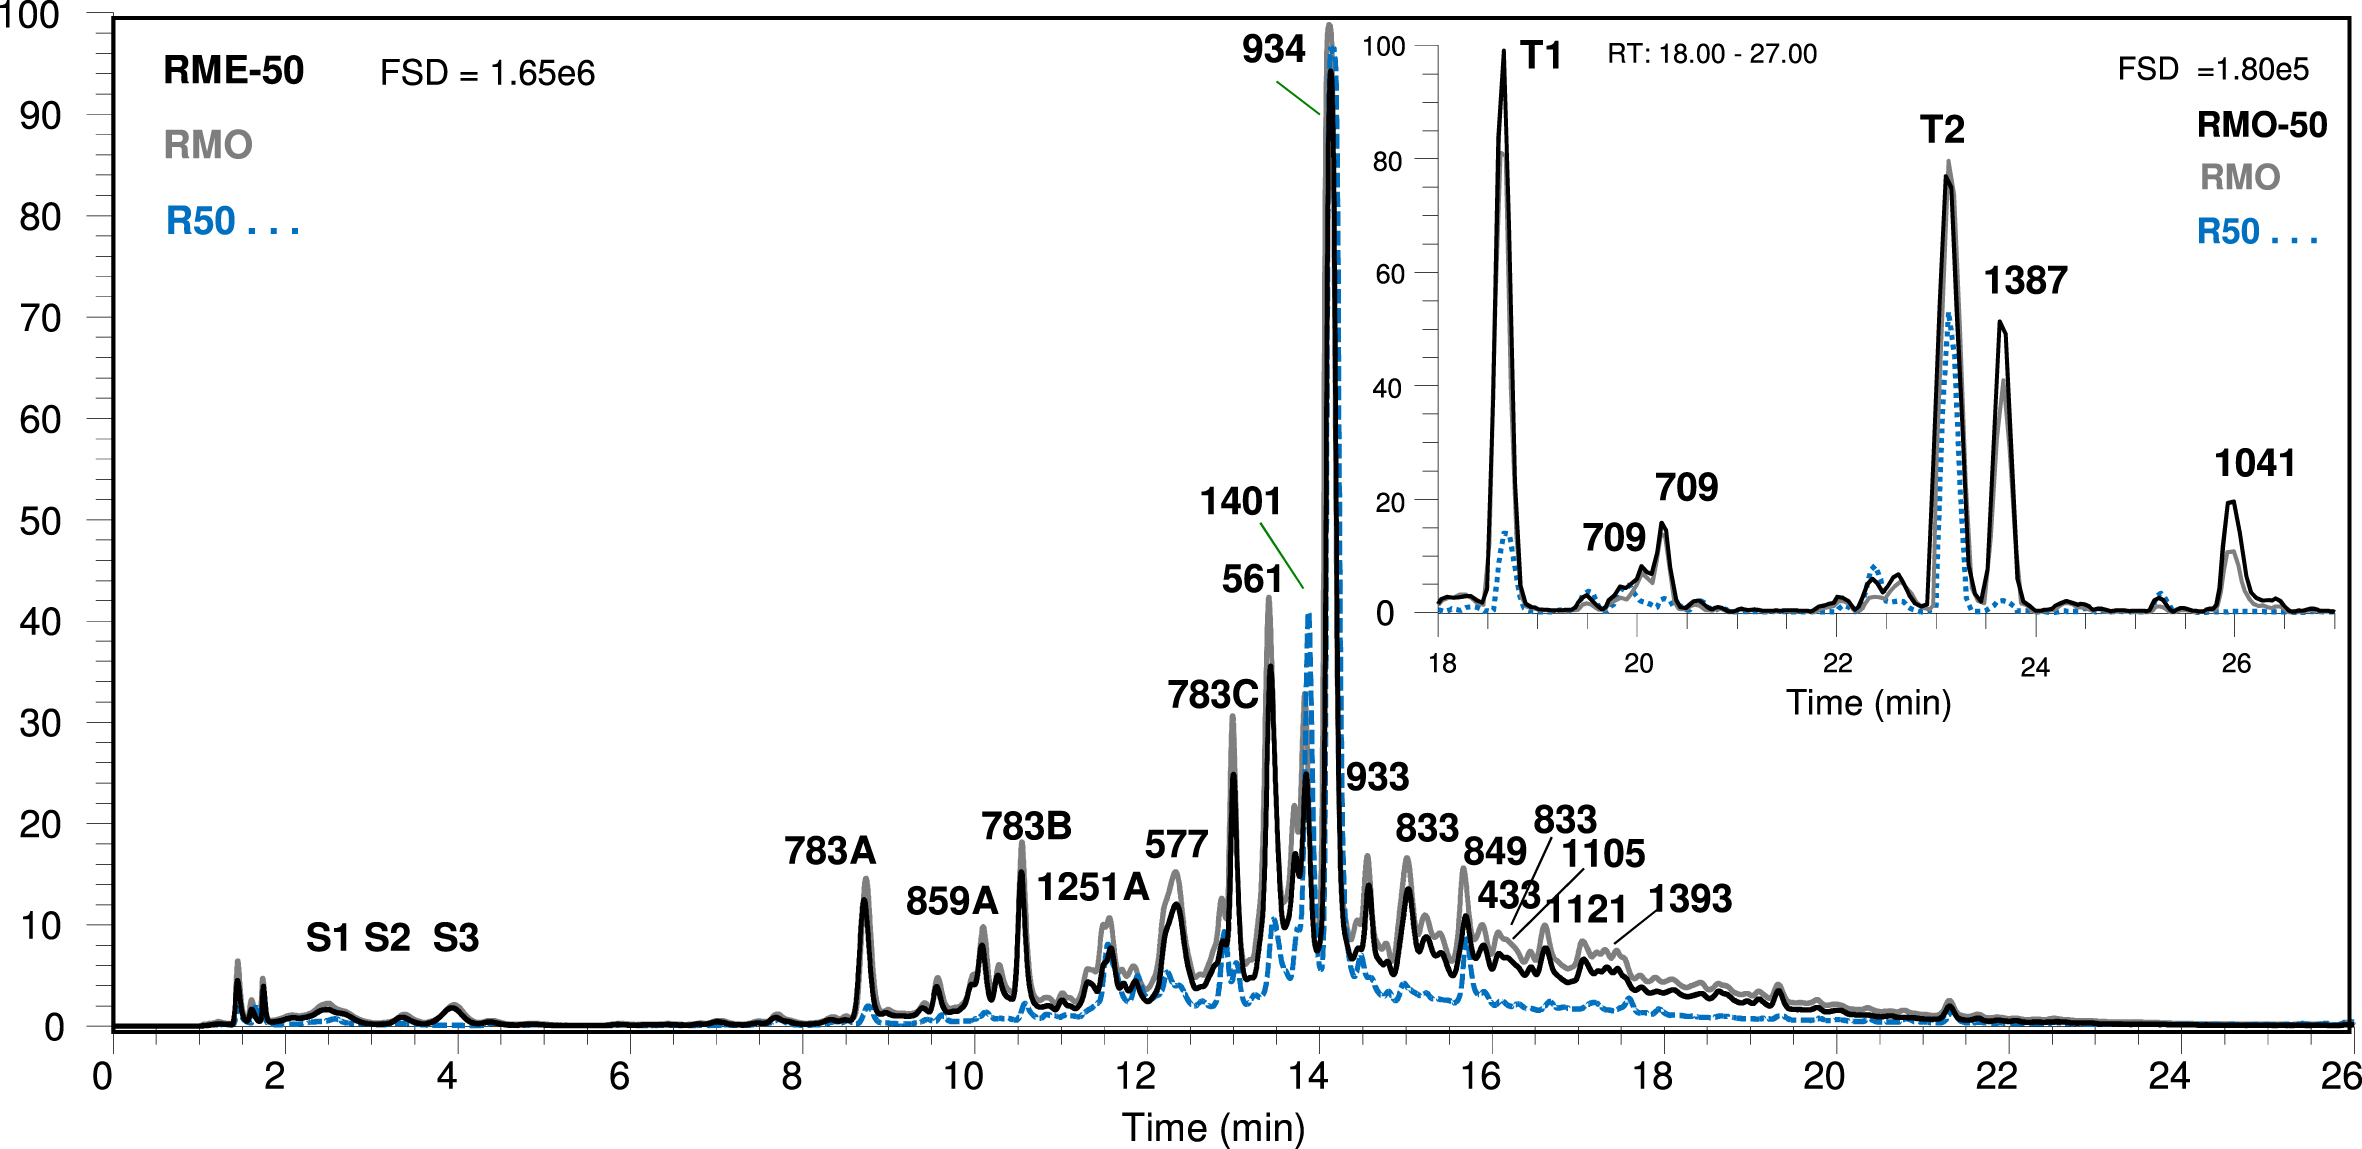
Effects of milling/ oil extraction on raspberry pomace extracts. R50 = 50% EtOH extract, RMO = original milled extract, RMO-50 = Milled, pre-extracted with 50% ethanol. Labelled peaks are discussed in the text. FSD = full scale deflection.
The triterpenoids showed mixed extractability. Some had similar levels (e.g. peak T2 and the T711 group) but most were enhanced by milling (e.g. peaks T1, the T693, T695, and T709 groups). Also, two new triterpenoids become apparent, named T1387 and T1041. The elevated peak T1387 at 23.71 min gave a m/z value of 1387.74 with a fragmentation pattern, which suggests that this is probably a TTPN dimer as noted previously [37]. The peak at 25.03 min gave an m/z value of 1041.1 which only provided fragments indicative of a loss of H2O, but the ion was doubly charged suggesting a true mass of>2000 amu. Therefore, oil extraction (or possibly milling alone) increased the yield of most phenolic components from raspberry pomace but also increased the levels of certain, but not all, TTPNs. Also, new TTPNs were more abundant after milling/oil extraction.
For both berries, extraction of the pomace after milling and oil extraction would provide at least equivalent levels of extractable phytochemicals to extraction of the unmilled material. For raspberry, milling greatly increased the yield of phytochemicals available over the original material and new components became apparent. These differences may result from the different structures of the berries. Blackcurrants are true berries consisting of a translucent pulp containing seeds surrounded by skin, and the skin makes up ∼50% of blackcurrant pomace dry mass ([11]; estimated ∼48% in this study). The skin is a major source of phenolics, which accumulate in vacuoles during black currant development [11, 40]. On the other hand, raspberry fruits are aggregated drupelets which each contain a seed and therefore the seed content of raspberry pomace is generally high, reported up to 80% dry mass (e.g. [41]) and estimated at 75% in this study. Therefore, these inherent differences in berry tissues partially explains the higher yield of phytochemicals after milling but also the thick seed coats of raspberry seeds (e.g. [42]) may also contribute to enhanced yield. Some differences in extractable phenolic classes from raspberry seed and non-seed pomace components have been previously noted [26], e.g., flavan-3-ols were higher in seeds and flavonols were higher in non-seeds. However, further dissection of the more major components such as anthocyanins, ellagitannins, or triterpenoids, was not reported. The differential extractability of components means that that targeted extraction with low levels of ethanol could provide extracts relatively enriched in anthocyanins and triterpenoids over other polyphenol classes, which would be available by sequential extraction with elevated ethanol levels.
Supporting information
This contains information on the oil content and fatty acid composition of the pomaces and further information on the MS properties of the pomace extracts.
Footnotes
Acknowledgements & funding statement
This work was supported by the European Union’s Seventh Framework Programme (BacHBerry Project No. FP7-613793). DS, AF, GMcD, GD, JS and CA gratefully acknowledge part funding by the Scottish Government’s Rural and Environment Science and Analytical Services (RESAS) division.
Conflict of interest statement
The authors have no conflicts in interest.
Author contributions
HA prepared samples, performed some of the analysis, interpreted that data and drafted the paper. GD supervised the work, interpreted the data, and wrote and revised the paper. AF interpreted the data and wrote and revised the paper. CA prepared the samples, performed some of the analysis, and interpreted the data. JS prepared samples, performed some of the analysis and performed data analysis. JWA supervised some work, interpreted the data, and wrote and revised the paper. DS interpreted the data and wrote and revised the paper. GMcD oversaw the work, interpreted the data, and wrote and revised the paper.
