



Abstract
BACKGROUND:
Due to the increasing market demand for blueberries, the amount of land dedicated to their production is expanding. Therefore, cultivation techniques to ensure high quality and a longer shelf life have become key concerns for the blueberry industry and consumers.
OBJECTIVE:
This study investigated the impact of various growing environments and pruning techniques on the quality and shelf life of highbush blueberry (Vaccinium corymbosum L. cv. ‘Duke’) during cold storage.
METHODS:
In this study, six commercial orchards were selected based on the type of pruning (light or hard) and the plot’s altitude (lowland, hill, or mountain). After harvest, the blueberries were stored at 1°C and 90% RH for 21 days. Quality analyses were performed on days 0, 10, and 21 of storage. The data were processed with a factor-designed analysis of variance (one-way ANOVA).
RESULTS:
Blueberries from the lowland cultivation area with light pruning had a longer shelf life. At harvest, the lowland area had indeed produced firmer blueberries that were sweeter and less acidic, and cold storage positively preserved these characteristics compared to fruit grown at other altitudes.
CONCLUSIONS:
In summation, the lowland area produced firmer berries that retained their characteristics after 10 days of storage, especially those harvested from hard-pruned plants. Notably, the bioactive compounds were not affected by the pruning method. However, when combined with 10 days of storage, light pruning was associated with better preservation of the total phenol content.
Abbreviations:
above sea level antioxidant activity digital durometer test deformation test penetration test relative humidity titratable acidity total anthocyanin content total phenol content total soluble solids
Introduction
Recently, blueberries have become more popular, no longer representing a moderate market segment, but an emerging sector that is rapidly growing and recruiting new consumers [1]. This upward trend is driven by the recognized health benefits of blueberry consumption. Studies have shown that blueberries have antioxidant and anticancer properties and are an excellent source of vitamins B, C, and K, polyphenols [2, 3], and several minerals, such as K, P, Ca, Mg, and Mn, of relevant health importance [4].
Due to the rapid increase in blueberry demand, new growing regions, innovative genetic materials, and agronomic techniques have been developed [5–7].
As in the rest of the world, in Italy, mainly in the Piedmont and Trentino-Alto Adige regions, the land dedicated to blueberry production is increasing. The main cultivar grown in these regions is the Duke variety, an early ripening blueberry.
The main training system applied to blueberry plants is the free bush consisting of 5 or 6 productive branches. Every year, a pair of the oldest branches is replaced with more vigorous shoots of 1 to 2 years of age. The main purpose of pruning is to balance both the productive load and crop vegetative renewal. Cutting back too drastically causes an unnecessary vegetative boost, while very light pruning causes early aging and a bush that is no longer sufficiently covered with productive branches.
Many growers whose production comes mainly from mixed branches prefer harder pruning, and those who favour production on brindils (light shoots) consequently prefer lighter pruning. In the Piedmont area, where blueberry cultivation is increasing, a uniform pruning technique has not yet been applied due to the lack of consolidated experience in the management of blueberry bushes. This can be attributed to the limited number of studies highlighting the effects of pruning methods on the berries’ quality and shelf life. Some studies report that hard pruning leads to better fruit production and size due to a better distribution of photosynthates but has no effect on nutritional attributes [8–10]. Other studies, in contrast, show that light pruning, resulting in a 45–55° angled bush conformation, leads to very productive yields [11–13]. Finally, many trials conducted in North America support the idea that growing blueberry bushes in a V-shape is easier for mechanical harvesting [14]. Nevertheless, this method cannot be used in italian production because orchards are commonly on slopes. Moreover, consumers’ desire for high product quality limits the mechanical harvesting of blueberries for fresh markets [15].
Considering these issues, the objective of this study was to compare two pruning techniques applied to highbush blueberry plants grown in three landscapes (lowland, hill, and mountain) and to identify which pruning method and cultivation site provided the best balance of blueberry quality characteristics and shelf-life performance. Quality traits were evaluated at harvest and monitored over a period of 21 days in cold storage to identify the best blueberry growing conditions to optimize shelf life.
Materials and methods
The study was carried out in six commercial orchards of highbush blueberry (Vaccinium corymbosum) located in the Saluzzo area (Piedmont, Italy). Five growing sites located at different altitudes were used: lowland < 300 m a.s.l. (Revello, Envie); hill 300–600 m a.s.l. (Castellar, Pagno), and mountain > 600 m a.s.l. (Sanfront).
Plant material and climate characterization
The study was performed from April to August 2021 on even-aged (10 y) blueberry cv ‘Duke’ orchards managed according to the organic agriculture protocol (Reg. CE n° 834/2007). Six orchards were selected based on the type of pruning. Three of the six (Table 1) were pruned using hard techniques (production on vigorous shoots), and the remaining three received light pruning (production on light shoot –brindile). Each of the three selected locations (lowland, hill, and mountain) had one light-pruning orchard and one hard-pruning orchard. Both pruning methods were applied to 8–10 productive branches, a procedure that is usually performed every year in the winter (last 10 days of February) during the dormancy phase of the plant. The difference between the techniques is that hard pruning is carried out to obtain production mainly on vigorous shoots, and light pruning is done for production predominantly on light shoot - brindle. In other words, hard pruning removes more wood from the bush than light pruning does.
Properties of the six blueberry orchards selected for research purposes
Properties of the six blueberry orchards selected for research purposes
Meteorological data were collected from the Arpa Piemonte [16] database to study the climate characteristics of each selected location. The data from 2021 were collected until June, the month of blueberry harvest.
In April, three bushes located near the centre of the orchard were chosen. These bushes were similar in vigour and number of flowering bunches. The blueberries were hand-harvested from June 14 to July 14 through weekly pickings. Samples of blueberries from the second week were stored at 1°C and 90% RH (relative humidity) for 21 days at the Lagnasco Group’s warehouse in Saluzzo (Piedmont, CN, Italy). The storage conditions were chosen based on those normally used by the company. Defect-free fruits were randomly divided into 48 RPET baskets of 500 g each: 8 baskets were selected for each treatment (orchard/pruning method).
Blueberry quality was evaluated at harvest (day 0) and after 10 and 21 days of cold storage at the DISAFA laboratory, University of Turin (Grugliasco, TO) after they were transported from the warehouse to the laboratory.
Firmness
The fruit firmness of each treatment group was evaluated by performing a digital durometer test (DDT) using a digital durometer (53215 TP-Turoni, Forlì, Italy), with firmness measurements expressed on the Shore scale (10–90). The analyses were performed at room temperature in the equatorial zone on 30 fruits per sample.
Mechanical properties were also determined using a Texture Analyzer TA-XT2i (Stable Micro System, United Kingdom). Two tests were performed: a penetration test (PT) and a deformation/compression test (DT). The samples were cooled to 6°C before testing to ensure the same fruit surface temperature, as the texture analyser is a very accurate instrument.
The PT was performed at a speed of 1 mm/s with a 3-mm Ø (P/3) cylindrical probe and a 3-mm penetration in the berries’ equatorial zone. The DT was carried out by applying 2% compression to the sample with 50% deformation using a 75-mm Ø flat probe (P/75) and a speed of 1.2 mm/s.
Firmness was measured as the maximum force recorded (N) in a force-time curve obtained during the penetration and deformation cycles. The PT and DT were carried out in the berries’ equatorial zone at room temperature on 15 fruits per sample.
Titratable acidity (TA)
Total acidity was measured on 10 ml of clear blueberry juice and titrated automatically with 0.1 N NaOH to a pH of 8.1 (Titralab AT1000-HACH, France). The analysis was performed in triplicate, and the results were expressed as meqNaOH/l.
Total soluble solids (TSS)
The total soluble solid content (TSS) of clear blueberry juice was determined using a digital refractometer (ATAGO-PR-32, Italy). The juice was obtained with a juice extractor and then centrifuged at 2,500 rpm for 10 minutes using the AVANTIM J-25 centrifuge (Beckamn Instruments Inc.) to obtain clear juice. The analysis was performed using the supernatant in triplicate, and the results were expressed in °Brix.
Total anthocyanin content (TAC)
The total anthocyanin content (TAC) analysis followed the pH differential protocol [17]. From the blueberry samples, clear juice was extracted by adding 12.5 ml of MeOH (100%) to 5 g of fruit and homogenising the result at 16,128 g for 1 min using an Ultra-Turrax T18 basic (Janke and Kunkel, IKA®-Labortechnik, Germany). The juice (20μl) was diluted separately with 2 ml each of pH 1 (potassium chloride 0.025 mol/L) and pH 4.5 (sodium acetate 0.4 mol/l) buffer solution. The absorbance values of the solution were determined spectrophotometrically at both λ 520 nm and λ 700 nm (U-5100, Hitachi, Japan).
The TAC was calculated using the following formula:
TAC: total anthocyanin content in mg pelargonidin-3-glucosidine/l.
A: difference in absorbance ((A520 _ nm - A700 _ nm) pH1 - (A520 _ nm - A700 _ nm) pH4.5))
MW: molecular weight of pelargonidin (433.2 g/mol)
DF: dilution coefficient (10)
L: optical path in cm
E: extinction coefficient (48,340 l/mol*cm)
Three replicates per treatment were used.
Total phenol compounds (TPC) and antioxidant activity (AA)
For the tests, fruit extracts were prepared according to the protocol in Šavikin et al. [18]. Extraction was performed by adding 12.5 ml of MeOH (100%) to 5 g of fruit and homogenising the result for 1 min with an Ultra-Turrax T18 basic (Janke and Kunkel, IKA®-Labortechnik, G). The samples were then placed in an ultrasonic bath (VWR Ultrasonic cleaner, Germany) containing water at 50°C for 20 minutes. The solutions were centrifuged at 2.5 g for 10 minutes using the AVANTIM J-25 centrifuge (Beckamn Instruments Inc.). The clear juice (supernatant) was collected and stored at - 26°C until analysis.
Total phenol compounds (TPCs) were determined with the Folin–Ciocalteu reagent [19], using gallic acid as a standard. Absorption was measured at 760 nm. The results were expressed as mg gallic acid equivalents (GAE) per 100 g of fresh berries. Three replicates of each treatment were performed.
Antioxidant activity (AA) was determined according to the ferric-reducing antioxidant power (FRAP) method [20] modified for fruits [21]. It is based on the reduction of the Fe3 +-TPTZ (2,4,6-tripidyl-s-triazine) complex to an Fe2 + (ferrous) iron form at a low pH.
The reduction of iron in the TPTZ-ferric chloride solution (FRAP reagent) results in the formation of a blue-coloured product (ferrous tripyridyltriazine complex), the absorbance of which was read spectrophotometrically at 595 nm 4 min after the addition of berry extract to the FRAP reagent. The results were expressed as mmolFe2 + /kg of fresh berries. Three replicates per treatment were used.
Statistical analysis
A statistical analysis was conducted using R Studio software version 4.1.2 (Integrated Development for R., R Studio, PBC, Boston, MA, USA). Factor-designed analysis of variance (one-way ANOVA) was applied to the quality data. The factors considered were pruning (hard/light), growing area (lowland/hill/mountain), storage (0/10/21 days) and their interactions. Least significant differences at a significance level of 0.05 (p≤0.05) were used to compare means with Tukey’s test.
Results and discussion
Meteorological data
The meteorological data obtained from the Arpa Piemonte database provided the thermo-hygrometric values recorded by the automatic weather stations. Based on the locations of the case study areas, three weather huts were selected: one in Revello (Table 2) as a representative of the lowland area, one in Saluzzo (Table 3) for the hilly area and one in Paesana Erasca (Table 4) to represent the mountain area.
Blueberry firmness (determined by DDT: digital durometer test, PT: penetration test and DT: deformation test) as affected by storage period (0, 10 and 21 days of storage). Results: means, standard deviation (SD) and Tukey’s post hoc test (same letters indicates no statistical difference among column; p≤0.05)
Blueberry firmness (determined by DDT: digital durometer test, PT: penetration test and DT: deformation test) as affected by storage period (0, 10 and 21 days of storage). Results: means, standard deviation (SD) and Tukey’s post hoc test (same letters indicates no statistical difference among column; p≤0.05)
Blueberry firmness (determined by DDT: digital durometer test, PT: penetration test and DT: deformation test) as affected by the growing area (lowland, hill and mountain). Results: means, standard deviation (SD) and Tukey’s post hoc test (same letters indicates no statistical difference among column; p≤0.05)
Blueberry firmness (determined by DDT: digital durometer test, PT: penetration test and DT: deformation test) as affected by pruning technique (hard and light). Results: means, standard deviation (SD) and Tukey’s post hoc test (same letters indicates no statistical difference among column; p≤0.05)
Concerning rainfall (Fig. 1), it emerged that February and March were characterised by low rainfall, compared to January and May, when precipitation was most abundant. In addition, it should be noted that the hilly area, represented by the weather hut in Saluzzo, was characterised by less rainfall than the lowland and mountain areas.

Cumulative monthly rainfall (mm) of the case study areas; source: Arpa Piemonte database.
Regarding the temperature trend (Figs. 2, 3), it appeared that January and June recorded the lowest and highest average maximum temperatures, respectively. On the contrary, the highest and lowest average minimum temperatures were attributed to June and February, respectively. The mountain environment, represented by the weather hut in Paesana Erasca, reported the coldest climate compared to the plains and hills. However, it appeared that the climatic trends of the average maximum temperatures in the mountain and hilly cultivation areas were almost coincident (Fig. 2). A similar trend was also recorded in the average minimum temperature values among the lowland and hill environments (Fig. 3).
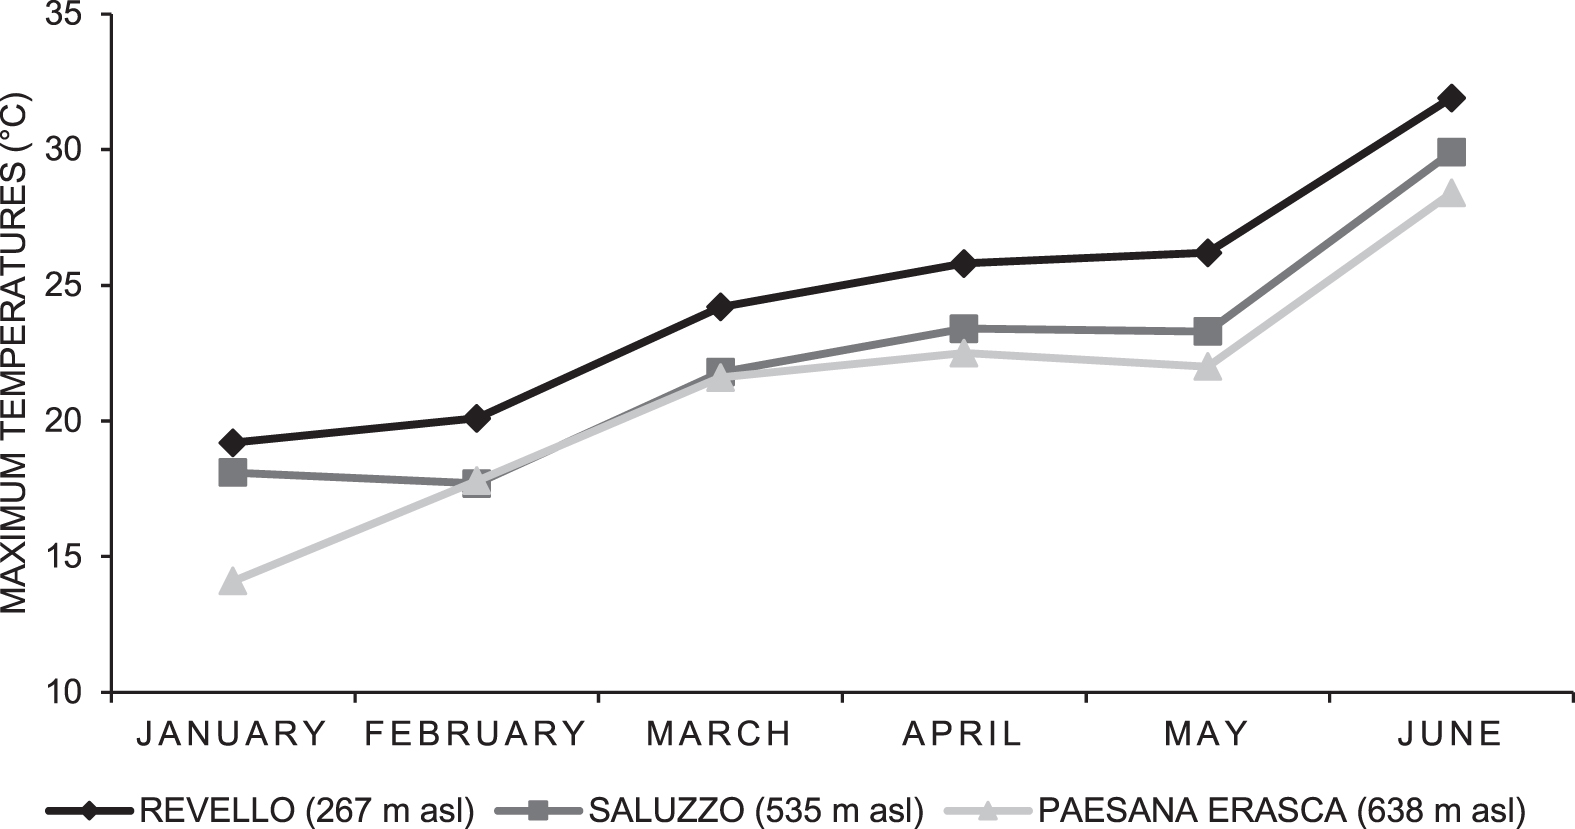
Average maximum temperatures (°C) of the case study areas; source: Arpa Piemonte database.

Average minimum temperatures (°C) of the case study areas; source: Arpa Piemonte database.
Firmness is one of the most important quality traits for soft fruits such as blueberries and is often considered a shelf-life-limiting factor. For this reason, it was decided to evaluate three different parameters of berry consistency. The DDT evaluates surface hardness thorough the measurement of the maximum force to the compression distance. The PT is linked to the thickness of the fruit epidermis, and the DT measures the compactness of the berry itself. These tests conducted on textural properties showed how storage and growing area significantly affected the blueberries’ texture.
Table 2 displays the significant differences resulting from days of storage as indicated by the DDT and DT. The samples were found to be firmer after 10 or 21 days of storage than at day 0. In several works, it has been observed that the firmness of blueberries increases in the early stages of storage and then decreases with prolonged storage [22, 23]. Such behavior is due to moisture loss, which is the major cause of textural changes during cold storage [24], mainly initially, when moisture loss is greater than intercellular cohesion loss [25].
The lowland cultivation areas provided more consistent fruits than the hill and the mountain (Table 3). The DDT and PT revealed that the softest berries were those grown on hills and mountains, while the DT only indicated the mountainous zone, with no significant differences between the lowland and hill areas. The DT generally gives information on the compactness of the fruit itself. The differences in PT (which is a much more accurate measurement than DDT and is closely linked to the thickness of the fruit epidermis) can be attributed to differences in the skin structure, as previously observed [26]. These results, however, are not in agreement with those of Rolle et al. [27], who found a trend of increasing grape skin thickness with increasing altitude. The discrepancies could be due to the diversity of the fruits, which belong to different species despite all being berries, and especially to the agronomic techniques used.
Turning to the pruning techniques, the statistical analysis demonstrated how the blueberries’ textural properties were not influenced by the choice of either hard or light pruning. The ANOVA, in fact, did not reveal any significant differences between the samples (Table 4).
Higher DDT values were found after 10 days of storage with both hard and light pruning (Fig. 4). By contrast, the PT and DT identified the hardest berries at 10 days of storage with hard pruning only. These findings are in agreement with those of other researchers; e.g. some studies [28] have found that a low canopy density, which results from intense pruning, creates more consistent berries, while other studies [29] discovered that a strong-cut mango tree provides firmer fruits. The least consistent blueberries were recorded in low-cut orchards and not cold-stored (day 0). These results, therefore, indicate that a short period of conservation and hard pruning produce more consistent fruits.

Blueberry firmness (determined by DDT: digital durometer test, PT: penetration test and DT: deformation test) as affected by storage period (0, 10, and 21 days of storage) and pruning technique (hard and light). Results: means, standard deviation (SD) and Tukey’s post hoc test (same letters indicates no statistical difference among column; p≤0.05).
The interaction between storage period and growing area (Fig. 5) indicated that the firmest fruits (according to the DDT, PT and DT) were those collected on the hill zone without cooling (day 0). The ANOVA revealed the softest samples to be from day 10 in fruits grown in the lowland. The interpretation of the data in relation to the PT and DT was more complex; however, one trend that could be observed is that the lowest data for the penetration test were found for the lowland plot as early as after 10 days, while it was after 21 days in the hilly and mountain zones. For the compression test, instead, the results highlighted how the lowest values occurred after 10 days (lowland) and 21 days (mountain) of cold storage.
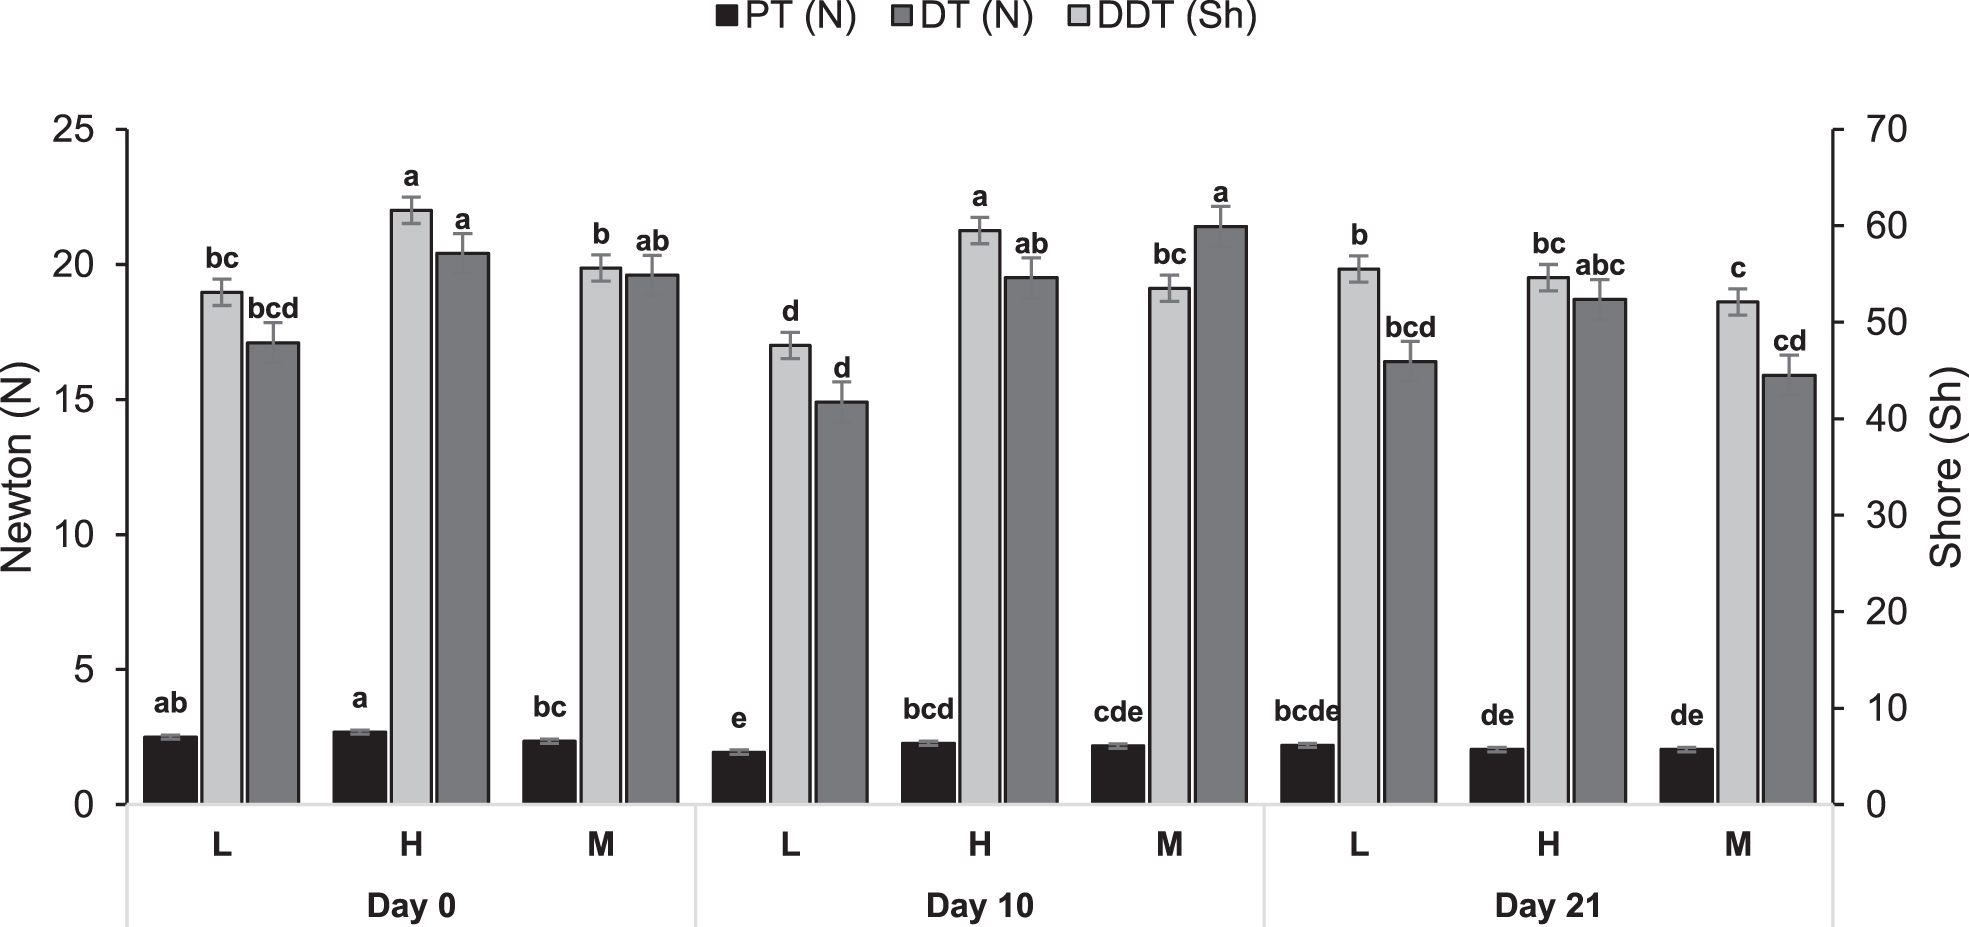
Blueberry firmness (determined by DDT: digital durometer test, PT: penetration test and DT: deformation test) as affected by storage period (0, 10 and 21 days of storage) and growing area (L: lowland, H: hill and M: mountain). Results: means, standard deviation (SD) and Tukey’s post hoc test (same letters indicates no statistical difference among column; p≤0.05).
Considering the interaction between pruning technique and growing area (Fig. 6), the DT findings did not show statistically significant differences. By contrast, the fruits defined by the best firmness (DDT) were those collected on lowland-grown plants with both hard and light pruning systems. The softest berries were found in hill areas with both hard and light pruning and in mountain-cultivated berries grown with a hard pruning of the bush. The results of the PT showed strong consistency in berries grown in the lowland with hard pruning and in the hilly environment with light pruning.

Blueberry firmness (determined by DDT: digital durometer test, PT: penetration test and DT: deformation test) as affected by pruning techniques (hard and light) and growing area (L: lowland, H: hill and M: mountain). Results: means, standard deviation (SD) and Tukey’s post hoc test (same letters indicates no statistical difference among column; p≤0.05).
The chemical traits assayed suggested that the storage period does not affect TA (Table 5) and the pruning techniques do not influence the TSS (Table 6). On the other hand, TSS showed an increasing trend from day 0 to day 21. This pattern may be related to weight loss. As the fruit loses moisture, the sugar concentration increases. Since blueberry fruit does not have starch to support soluble sugar synthesis after harvest, the small increase in TSS may be a consequence of cell wall degradation [30]. Furthermore, light pruning provides a lower blueberry acidity than hard cutting.
Blueberry titratable acidity (TA) and total soluble solids (TSS) as affected by storage period (0, 10 and 21 days of storage). Results: means, standard deviation (SD) and Tukey’s post hoc test (same letters indicates no statistical difference among column; p≤0.05)
Blueberry titratable acidity (TA) and total soluble solids (TSS) as affected by storage period (0, 10 and 21 days of storage). Results: means, standard deviation (SD) and Tukey’s post hoc test (same letters indicates no statistical difference among column; p≤0.05)
Blueberry titratable acidity (TA) and total soluble solids (TSS) as affected by pruning technique (hard and light). Results: means, standard deviation (SD) and Tukey’s post hoc test (same letters indicates no statistical difference among column; p≤0.05)
Among the chemical traits evaluated, ANOVA indicated how the growing area is one of the most influential factors for TA and TSS (Table 7). Specifically, the blueberries with the lowest acidity and highest sweetness were those grown in lowland areas. While hill and mountain cultivation areas provided more acidic and less sugary fruits than the plains area, this charateristic is therefore the most appropriate in terms of chemical properties. These results are in agreement with the rainfall recorded in 2021. The hill, in fact, turned out to be the least rainy area, a phenomenon that could be responsible for increased sugar concentration in the blueberries.
Blueberry titratable acidity (TA) and total soluble solids (TSS) as affected by growing area (lowland, hill and mountain). Results: means, standard deviation (SD) and Tukey’s post hoc test (same letters indicates no statistical difference among column; p≤0.05)
The storage area factor interaction (Fig. 7) showed significant TSS differences. These results demonstrate that lowland-cultivated blueberries can maintain high TSS during cold storage. The results also revealed how TA is not impacted by the storage area factor interaction. Accordingly, the pruning area interaction (Fig. 8) suggested that the sweetest and least sour fruits came from plains-grown orchards managed with light pruning. Furthermore, it is interesting to observe how the samples were able to preserve TA and TSS during storage with both hard and light pruning (Fig. 9).
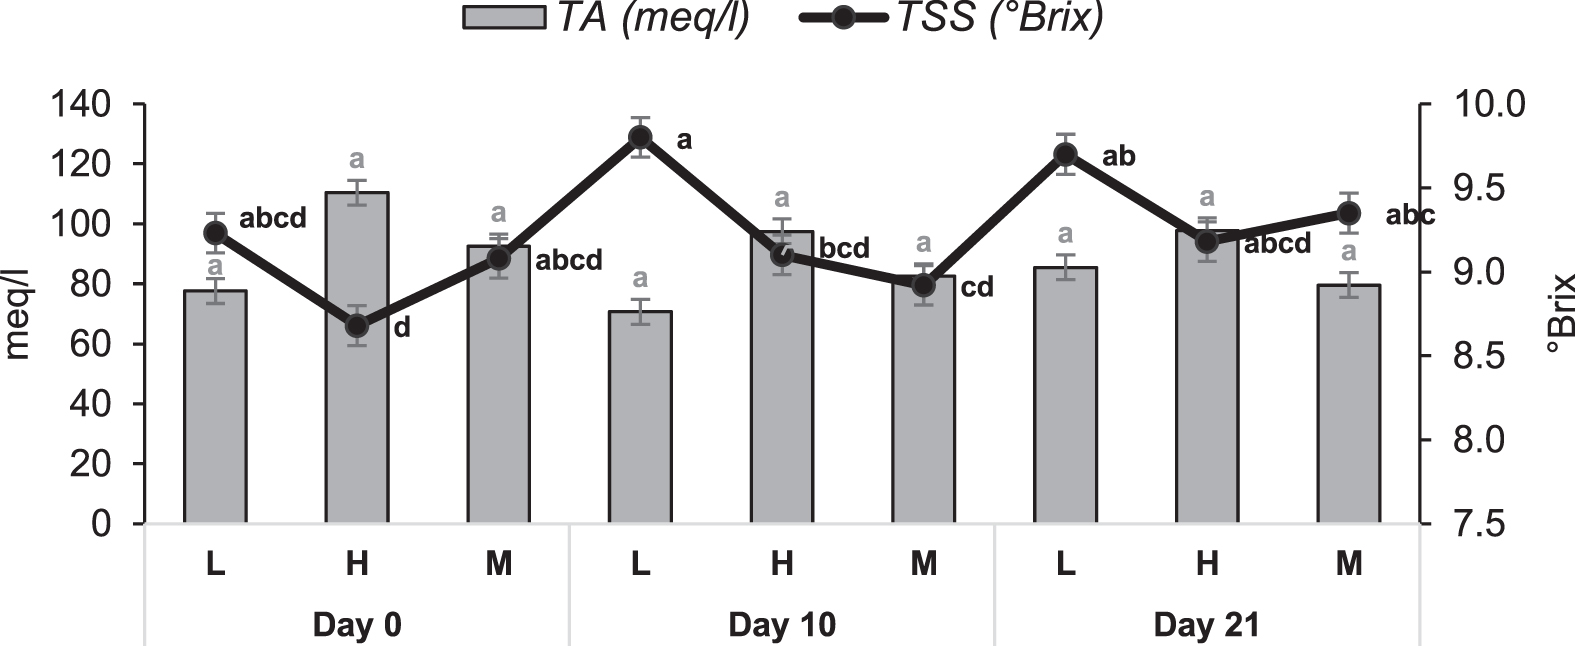
Blueberry titratable acidity (TA) and total soluble solids (TSS) as affected by storage period (0, 10 and 21 days of storage) and growing area (L: lowland, H: hill and M: mountain). Results: means, standard deviation (SD) and Tukey’s post hoc test (same letters indicates no statistical difference among column; p≤0.05).

Blueberry titratable acidity (TA) and total soluble solids (TSS) as affected by pruning techniques (hard and light) and growing area (L: lowland, H: hill and M: mountain). Results: means, standard deviation (SD) and Tukey’s post hoc test (same letters indicates no statistical difference among column; p≤0.05).
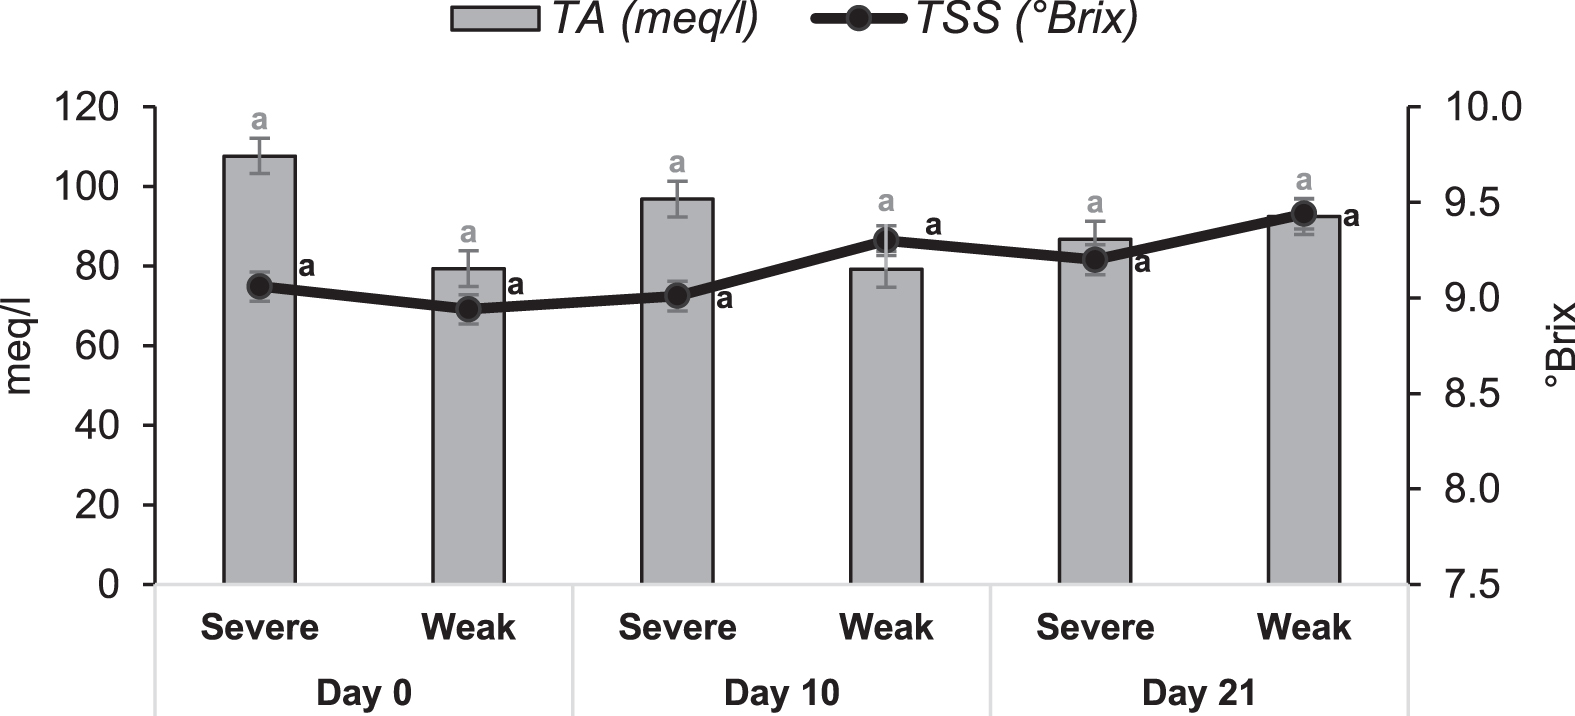
Blueberry titratable acidity (TA) and total soluble solids (TSS) as affected by storage period (0, 10 and 21 days of storage) and pruning techniques (hard and light). Results: means, standard deviation (SD) and Tukey’s post hoc test (same letters indicates no statistical difference among column; p≤0.05).
The TAC and AA suffered significant losses during storage, while the TPC remained unchanged until the 21st day of storing (Table 8). During the 21 days of storage, TAC and AA decreased significantly (p < 0.05). This TAC reduction may be related to greater use as a respiratory substrate of anthocyanins compared to the non-anthocyanin component of polyphenols [31]. These values are in accordance with other studies that reported an enzymatic degradation of anthocyanin during storage in the presence of oxygen [32]. This is compatible with the current study since the fruits were stored was in cold cells without atmospheric control. Thus, in the presence of high O2 concentrations, there is greater degradation of anthocyanin fraction and total antioxidant capacity than of total polyphenols.
Blueberry total anthocyanin content (TAC), total phenol content (TPC) and antioxidant activity (AA) as affected by storage period (0, 10 and 21 days of storage). Results: means, standard deviation (SD) and Tukey’s post hoc test (same letters indicates no statistical difference among column; p≤0.05)
Blueberry total anthocyanin content (TAC), total phenol content (TPC) and antioxidant activity (AA) as affected by storage period (0, 10 and 21 days of storage). Results: means, standard deviation (SD) and Tukey’s post hoc test (same letters indicates no statistical difference among column; p≤0.05)
The pruning methods did not affect the nutraceutical properties. The synthesis of these compounds is connected to several factors, e.g. soil, agronomic practices and climatic trends [33, 34]; in this situation, based on the results in Table 9, it is clear that the pruning method alone is not a source of variation in blueberries’ nutraceutical profiles.
Blueberry total anthocyanin content (TAC), total phenol content (TPC) and antioxidant activity (AA) as affected by pruning technique (hard and light). Results: means, standard deviation (SD) and Tukey’s post hoc test (same letters indicates no statistical difference among column; p≤0.05)
As for the cultivation region, the results highlighted that the blueberries’ best performance was in the lowland area, where the samples showed the statistically highest TAC (Table 10). Similar studies on blueberries [35] and other fruits, such as strawberries and pomegranates [36], found a lower amount of anthocyanins in fruits collected at higher-altitude regions. These studies indicated a clear negative correlation between altitude and anthocyanin synthesis, as was also indicated by the present research [37]. Otherwise, the cultivation region did not affect TPC and AA, which were constant regardless of the growing area.
Blueberry total anthocyanin content (TAC), total phenol content (TPC) and antioxidant activity (AA) as affected by growing area (lowland, hill and mountain). Results: means, standard deviation (SD) and Tukey’s post hoc test (same letters indicates no statistical difference among column; p≤0.05)
Significant P-values were estimated for interactions between storage and environmental conditions. The two-way ANOVA factors of storage and pruning were significant for TAC and PC (Fig. 10). The TAC was considerable in non-stored (day 0) blueberries pruned with both techniques, but the highest TPC was linked to light-pruned fruits cold-stored for 10 days. There were no statistically significant differences in AA between treatments (data not reported).
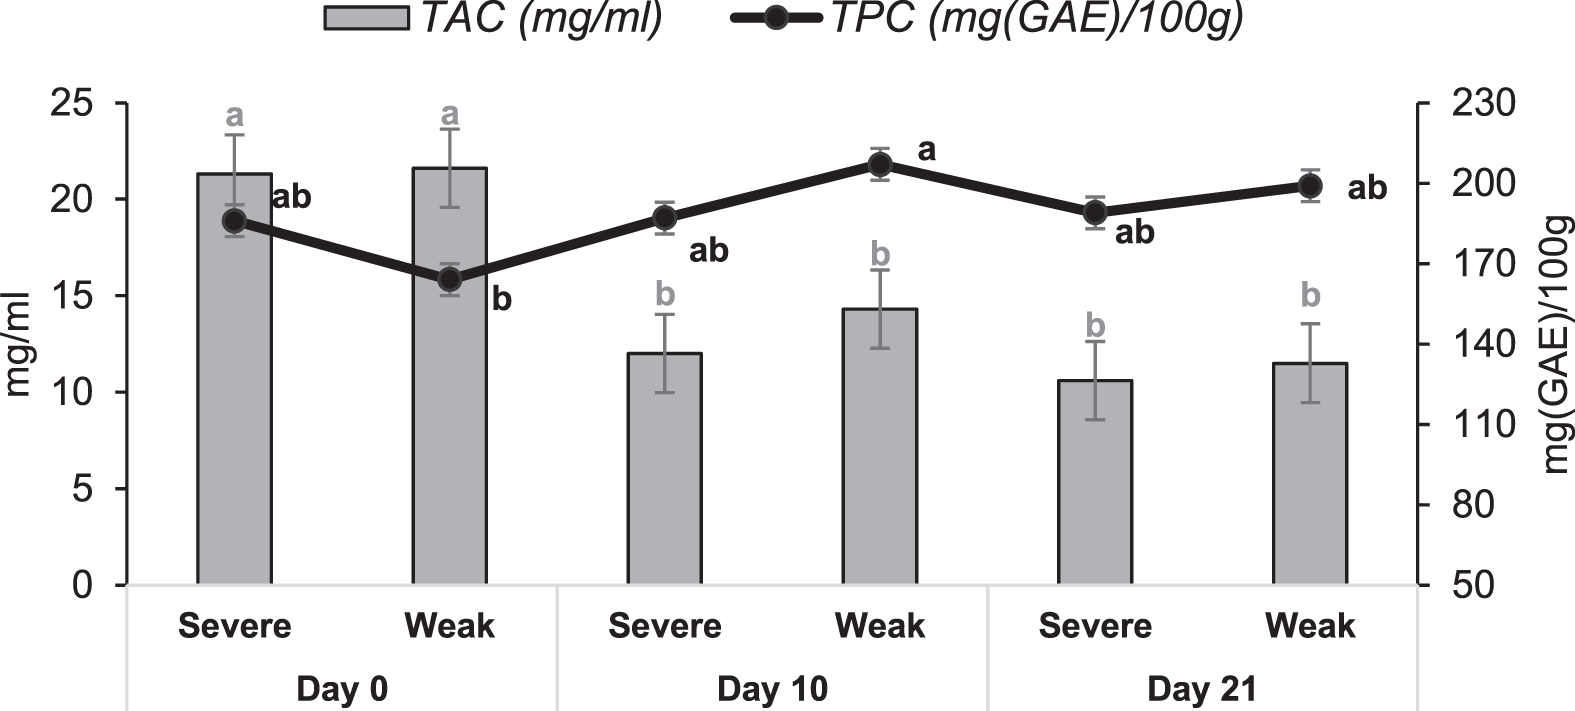
Blueberry total anthocyanin content (TAC), total phenol content (TPC) as affected by storage period (0, 10 and 21 days of storage) and pruning techniques (hard and light). Results: means, standard deviation (SD) and Tukey’s post hoc test (same letters indicates no statistical difference among column; p≤0.05).
The interaction between storage and growing area indicated the highest TAC quantity at day 0, without significant differences among the growing areas (Fig. 11). Blueberries with a higher TPC were associable with hill-grown fruits stored for 10 days and lowland-grown fruits stored for 21 days. As in the previous case, AA showed no statistically significant differences between treatments (data not reported).
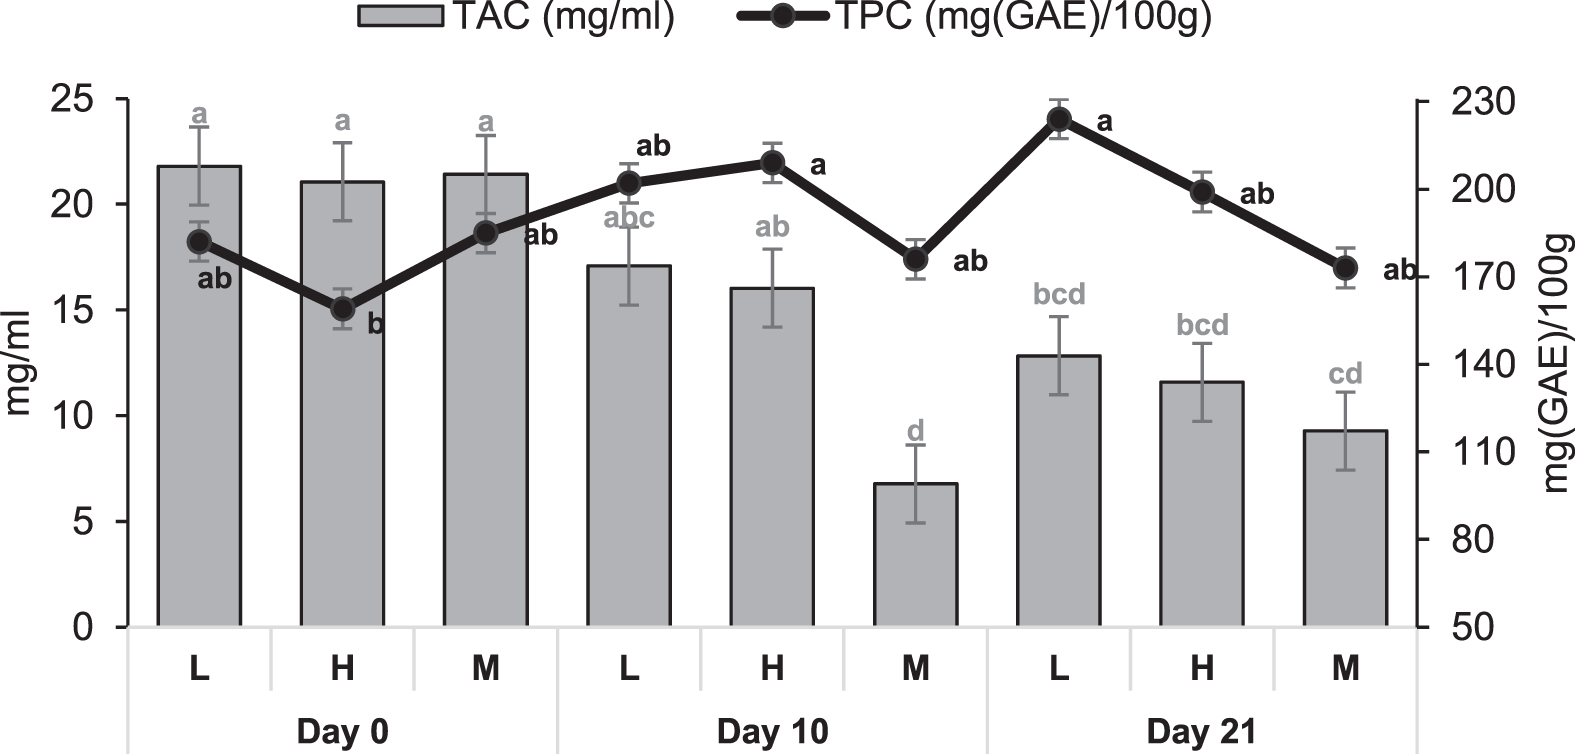
Blueberry total anthocyanin content (TAC), total phenol content (TPC) as affected by storage period (0, 10 and 21 days of storage) and growing area (L: lowland, H: hill and M: mountain). Results: means, standard deviation (SD) and Tukey’s post hoc test (same letters indicates no statistical difference among column; p≤0.05).
The influence of the two factors –pruning and area –did not yield statistically significant differences (Fig. 12). Accordingly, no strong positive influence can be attributed to a specific growing region or pruning technique in terms of obtaining better nutraceutical properties (AA data not reported).
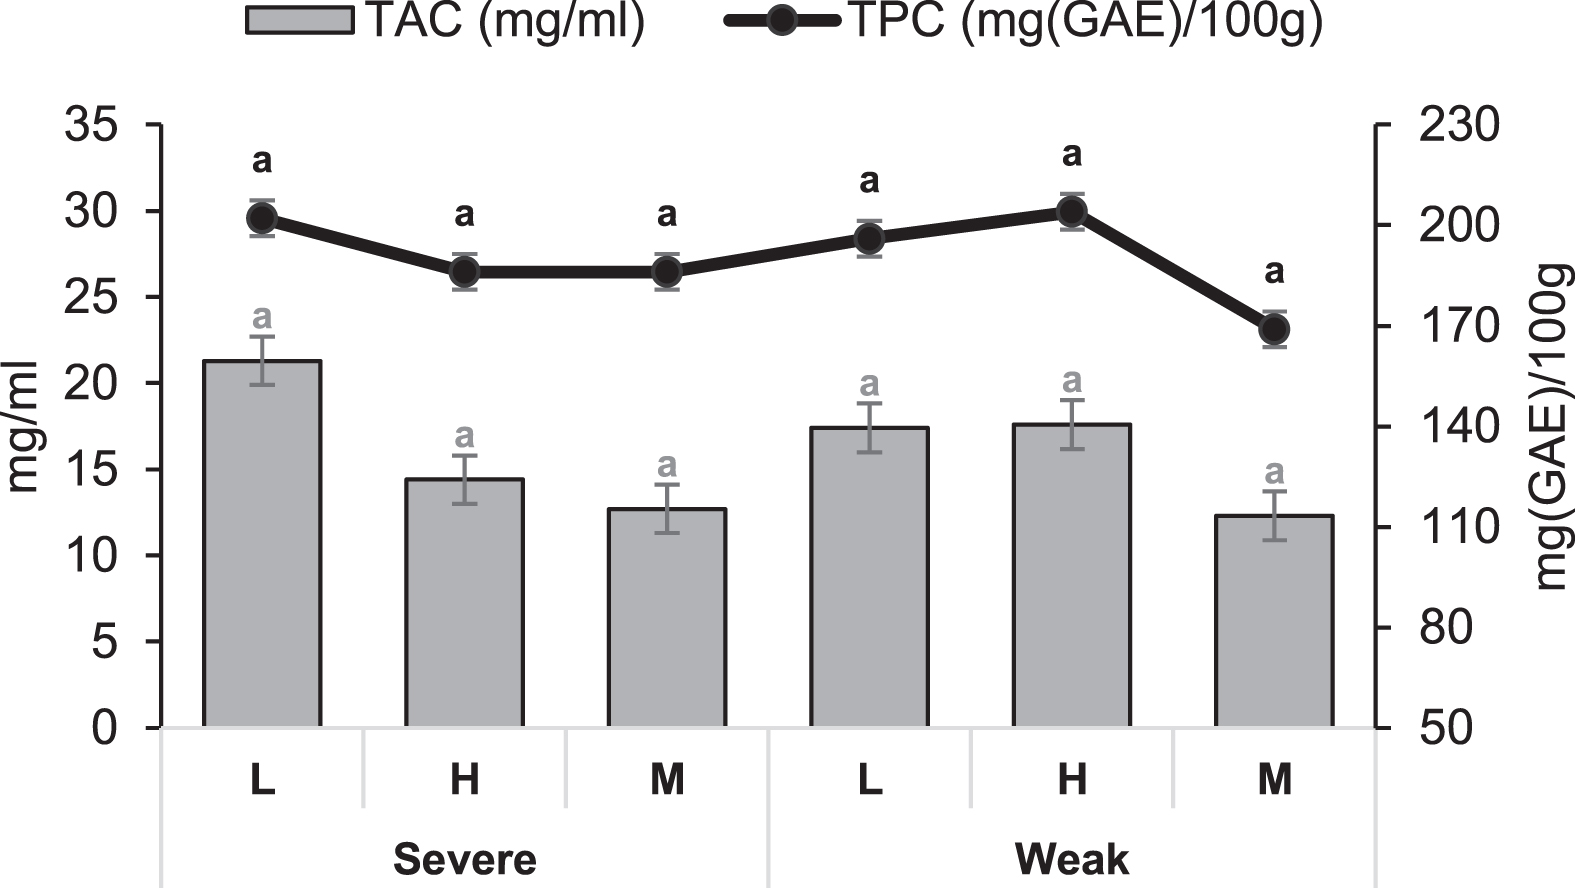
Blueberry total anthocyanin content (TAC), total phenol content (TPC), as affected by pruning techniques (hard and light) and growing area (L: lowland, H: hill and M: mountain). Results: means, standard deviation (SD) and Tukey’s post hoc test (same letters indicates no statistical difference among column; p≤0.05).
The constant values of AA were in accordance with the TPC, which remained unchanged in the one-way ANOVA results for the three factors considered in the present study (Tables 8, 9 and 10).
The present study was designed to identify the best pruning method and cultivation area for V. corymbosum production to preserve the best quality characteristics during post-harvest storage. As a result of the data processing, it was possible to determine that a lowland cultivation area and light pruning technique allows a longer blueberry shelf-life. These results are interesting since other studies on consumer preferences have outlined how sweet, intense blueberry flavours yield the most positive purchase interest, whereas poor texture attributes are the most detrimental to interest [38].
In terms of the fruits’ consistency, it was found that lowland areas produce firmer fruits that retain their characteristics after 10 days of storage, especially if harvested from plants cultivated with hard pruning.
As for the blueberries’ chemical properties, it emerged that, at the harvest, the plains area produced more sugary and less acidic fruits and that, because of cold storage, they better preserved these characteristics compared to fruits grown in other environments. Moreover, by associating the lowland cultivation area with light pruning, we could observe improved performance from the point of view of the maintenance of chemical properties.
Bioactive compounds, on the other hand, are not affected by the pruning method. However, if combined with 10 days of storage, it was found that light pruning better preserves TPC. Finally, the lowland area yields blueberries (at day 0 of storage) that are richer in TAC and retain their nutraceutical properties better than those in hilly and mountainous growing areas, even after 21 days of storage.
In conclusion, although the research identified the environmental characteristics that most positively affect blueberry quality traits, future studies should focus on the main agricultural techniques involved, as well as other cultivars. This could help overcome the limits of this research, which did use surveys or focus on other agronomic practices, such as irrigation and fertilisation. It should also be stressed that conducting the research over a single year did not allow definitive answers to be provided as to what the best pruning method is in relation to the cultivation area. It would therefore be useful to continue this research in subsequent years by enlarging the investigation to a wider number of cultivars, as each cultivar could exhibit different behaviours with respect to the area in which it is grown.
Author contributions
G.G. conceived and designed the research; A.V. and V.C. performed the experiments. A.V. wrote the paper and performed data analysis. G.G. reviewed and edited the paper. All the authors drafted and approved the final manuscript.
Funding
The authors report no funding.
Conflict of interest
The authors have no conflict of interest to report.