
Abstract
BACKGROUND:
In todays’ society, the rapid development of the wine industry and the improvement of peoples’ living standards make people pay more and more attention to wine grape quality.
OBJECTIVE:
To evaluate the wine grape varieties in Northeast Chinas’ grape growing regions for better wine grape quality, we evaluated the quality of different varieties of wine grapes.
METHODS:
The grape varieties ‘Hassan’ ‘Zuoshaner’ ‘Beibinghong’ ‘Zuoyouhong’ ‘Beta’ ‘Shuanghong’ ‘Zijingganlu’ ‘Cabernet Sauvignon’ and ‘Syrah’ were planted in the grape growing area of Jilin, Northeast China, were used as the subjects of this study. The grape berries were analyzed and tested for morphological indicators, basic physicochemical indicators, color, and phenolic and aromatic composition.
RESULTS:
According to lab results, ‘Hassan’ contained the highest amount of total phenolics; ‘Zuoyouhong’ had the highest solids and total sugar content; ‘Shuanghong’ had the most elevated total acid and anthocyanin content; ‘Zijngganlu’ had the highest tannin content and acid fixation ratio; Seventy-one volatile compounds were detected in nine grape varieties.
CONCLUSIONS:
Each of the nine grape varieties has a distinctive flavor, and because of this, grape processing products with regional flavors can be created. The same offer valuable data for future scientific grape resource collection, conservation, and exploitation.
Introduction
Grapes are deciduous woody plants of the family Vitis with high health benefits, and researchers know their juice as “plant milk” [1]. As one of the most broadly circulated, generally developed, and early developed natural product species, its essential purposes incorporate eat directly, winemaking, and dried organic product [2]. Approximately 70% of the worlds’ grapes are used for wine production and 30% for fresh and processed grape products [3]. In China, grapes were planted earlier, and the planting of Eurasian species began in the Western Han Dynasty. Furthermore, they were widely planted in China in the 1950 s and 1960 s and the late 1970 s and early 1980 s [4]. Despite Chinas’ wine grape industry taking on an international perspective and the countrys’ extensive grape resources, Eurasian, European, and American varieties of grapes still dominate most international markets. In China, wine grape cultivation and wine production are mainly concentrated in 26 provinces and cities, including Xinjiang, Ningxia, and Gansu. In 2021, Cultivated area for wine grapes about 80,000 hectares, generating employment for about 1.5 million people, so from an overall perspective, there is still a lot of room to still develop Chinese grapes and wine [5]. In order to promote the rapid development of the grape industry and the promotion of distinctive varieties of grapes and wines, the priority is to enhance the taste of grapes, optimize the flavor of grapes in terms of varieties, growth techniques, and environment, and organically combine new technologies and techniques with traditional cultivation patterns to support the internationalization of the Chinese characteristic grape industry.
The Vitis amurensis is a wild grape widely distributed in East Asia and can safely overwinter at extremely low temperatures below –30°C. It is extremely hardy and ideal for breeding grapes for cold resistance. The main varieties include ‘Zuoshaner’, ‘Shuanghong’, ‘Beibinghong’, ‘Zijingganlu’, ‘Zijingmenglu’ etc. Vitis amurensis is rich in anthocyanins and resveratrol with a light grassy aroma. As a very characteristic germplasm resource in northeastern China, it has received extensive attention recently due to its cold resistance, disease resistance, and typicality. Furthermore, research on Vitis amurensis has made extensive progress, and the scope of comprehensive utilization has been expanded [6]. For wine, the quality of grapes is a critical factor in determining its excellence of wine [7]. The external quality of grapes includes grain weight, juice yield, and cluster weight, and the internal quality mainly contains sugars, acids, total phenols, anthocyanins, tannins, and volatile compounds [8]. Among the many indicators used to evaluate grapefruit, the aroma of grapefruit is an intuitively perceptible quality that highlights the differences between varieties and is an essential sensory characteristic [9]. There are a number of studies that have characterized grape and wine aroma profiles by multivariate statistical analysis of the aroma compounds they contain. Meanwhile, to identify volatile compounds affecting grape flavor, PCA (Principal Component Analysis, PCA), OAV (Odor Activity Value) analysis, and VIP (Variable Importance in Projection) analysis are used. The volatile compounds released from grapes are formed during the ripening process, such as alcohols, esters, acids, aldehydes, ketones, and terpenoids. The effect of these compounds on olfaction, however, depends on their concentration and threshold, and only a few are key aroma compounds in grape fruit. Therefore many studies on aroma compounds screened essential aroma compounds based on OAV values. Some studies found that aromatic compounds with OAV greater than 1, particularly medium-chain fatty acid ethyl esters and aromatic compounds, were the primary characteristic flavors of aged yellow wine [10]. In studies on tea, combining OAV values with sensory description analysis, it was hypothesized that the compounds with significant contributions to black tea aroma could be (E)-β-pirolone, geraniol, β-laurelene, linalool, and hexanal [11]. The application of OAV values for screening the main contributing aroma compounds has been a standard tool for food aroma analysis. It has been used in the study of food aroma in different years [12, 13], identification of different varieties [14, 15], characterization of volatile compound components from different origins [16, 17] food aroma preservation techniques [18], food freshening [19], and identification of essential active compounds [20–23] have significant applications. OPLS-DA (orthogonal partial least squares discriminant analysis) is often applied in the comprehensive quality evaluation [24–26]. However, in analyzing volatile aroma compounds, in many studies, volatile aroma compounds in fruits were investigated using OPLS-DA. It should be noted that some aroma compounds, despite their high content, also have high threshold values and are difficult to detect via olfaction. Therefore, this study uses the OAV value as an evaluation index and combines it with the VIP value for the analysis, which results in more convincing.
There are several methods for detecting volatile compounds, including gas chromatography-mass spectrometry (GC-MS) and electron noses, headspace solid-phase microextraction-gas chromatography-mass spectrometry (HS-SPME/GC-MS), and headspace gas chromatography-ion mobility spectrometry (HS-GC-IMS)[27–30]. Despite the various studies on grape berries, research on grapes used for winemaking needs strengthening. First, many studies have only analyzed grape aromas without identifying their main components. Second, to evaluate the quality of grapes, in addition to detecting the aroma components, the color of the grapes and the basic physicochemical properties are also significant indicators of their superior quality.
These are the primary objectives of our study: (1) Compare the intrinsic and extrinsic physicochemical properties of different grape varieties. Compare the differences between Vitis vinifera, Vitis amurensis and Vitis labrusca. (2) Identify key odor active compounds in different grape varieties, and determine the effect of odor active compounds on grape berries by HS-GC-IMS and odor activity value (OAV) > 1. (3) VIP values were calculated by partial least squares and combined with OAV values to identify key aroma compounds.
Materials and methods
Materials and reagents
Materials
Nine varieties were selected for harvesting in September 2021 (Table 1). The sampling site was the National Vitis amurensis Germplasm Resource Nursery of the Institute of Special Products of the Chinese Academy of Agricultural Sciences, the locations sampled are shown in Table 2. The sampling period was during fruit ripening. From late April to early May 2002, nine varieties were planted in a single-armed hedge frame with a 1.0 m ×2.5 m spacing. We were weeding 4-5 times a year and fertilizing thrice, mainly with organic fertilizer. It is critical to manage orchards in a uniform way.
Introduction of tested varieties
Introduction of tested varieties
Overview of sampling origins
As part of test, each variety of pest-free, mold-free bunch was selected as a sampling object, and 100 grains of fruit from each variety were randomly selected; The samples were then placed in the thermal box and brought back to the laboratory, where after treating them with liquid nitrogen, the backups were stored in a refrigerator at –80°C.
The sampling sites are shown in Table 2.
Reagents
Analytical purity: sulfuric acid, sodium chloride, potassium chloride, sodium bicarbonate (Beijing Chemical Factory); tannic acid (Tianjin Guangfu Fine Chemical Research Institute); Folin-Denis reagent (American sigma company); anhydrous sodium carbonate (Tianjin Hengxing Chemical Reagent Manufacturing Co., Ltd.); glacial acetic acid, hydrochloric acid, anhydrous ethanol, sodium hydroxide, phosphoric acid (Beijing Chemical Factory); potassium hydrogen phthalate, anthrone (Sinopharm Group Chemical Reagent Co., Ltd.); anhydrous sodium acetate (Shanghai Hutian Chemical Co., Ltd.); glucose (Guangzhou Jinhuada Chemical Reagent Co., Ltd.).
Chromatographic purity: methanol (TEDIA Reagent Company, USA); succinic acid, fumaric acid, malic acid, anhydrous citric acid (Shanghai Yuanye Biotechnology Co., Ltd.); 4-methyl-2-pentanol (Shanghai Lianshuo Biotechnology Co., Ltd.); glacial acetic acid, tartaric acid, lactic acid (Tianjin Fine Chemical Research Institute)
Instruments and equipment
Agilent High-Performance Liquid Chromatograph (Agilent Technologies, America); FlavourSpec® Flavour Analyzer (G.A.S.); Electronic Balance - purchased from Sartorius Scientific Instruments (Beijing Co., Ltd.), Digital Vernier Calipers - purchased from Seda Tools (Shanghai) Co. Wine refractometer (ATAGO), CJJ-931 type two-connected magnetic heating stirrer (Jiangsu Jintan Jincheng Guosheng Experimental Instrument Factory, HWS-12 type electric constant temperature water bath, KQ-300E type ultrasonic cleaner, snowflake ice machine (Beijing Changliu Scientific Instrument Company), FA1004B type electronic balance (Shanghai Yue Ping Scientific Instrument Co., Ltd.), DHG- 9240 (Shanghai Yiheng Scientific Instruments Co., Ltd.), WAX column (RESTEK, USA).
Test methods
Grapefruit trait detection
Determination of single berry mass by weighing method in g; The volume of a hundred grape berries is measured by draining: 100 grape berries are placed in a measuring cylinder containing 200 ml of water, and the volume raised is the volume of 100 grape berries in cm3. One hundred grape berries are weighed in g, and the volume to mass ratio is calculated in g/cm3; determination of fruit diameter length by digital vernier calipers, Units in cm; Weighing 100 berries mass, juice extraction, weighing pulp juice mass, and calculating juice yield according to the formula (1).
Quantitative calculation formula (1).
Determination of the basic physicochemical indicators of grape juice
Measurement of soluble solids content with a hand-held refractometer. The determination of titratable acids is based on GB / T 15,038–2006 General Analysis Method of Wine and Fruit Wine. Based on the principle of acid–base titration, phenolphthalein is used as an indicator and titrated with standard alkali solution; The total sugar content of grape juice was determined using anthrone and sulfuric acid colorimetry; The Folin-Denis reagent method was used to determine tannin content in grapes Juice; Total anthocyanin content in grape juice was determined by the pH difference method; Total phenol content - Folin-Ciocalteu colorimetric method, the gallic acid developed after the reaction was scanned at the full wavelength in the range of 400nm–900nm, and the maximum absorption peak was found at 765 nm. The absorbance values were measured at 765 nm and the absorbance was included in the regression equation to calculate the total phenol content.
Colorimetric measurement
The spatial measurement of the grape berries color characteristics is based on a chromaticity analysis using CIEL* a * b * standard. The picked grapes were de-stemmed and de-seeded, ground to powder under liquid nitrogen and stored at –80°C for colourimetric testing, we measured absorbance at 450nm, 520nm, 570nm and 630nm using a Lanbda 365 UV-Vis spectrophotometer with a continuous scan (400–700nm) and a tenfold dilution of the filtrate, using distilled water as a control, and the values of L*, a*, b*, Cab*, hab*, and ΔEab* were calculated based on the four absorbances. L* represents brightness, a * represents red-green deviation, b * represents blue-yellow deviation, Hab * represents hue angle, Cab* represents red grape color index, and ΔEab* represents total chromatic aberration.
Organic acid content determination
The grapes were de-stemmed and de-seeded, ground to a powder under liquid nitrogen conditions, weighed to 0.2 g, added to 2 m L of 0.2% hydrochloric acid, extracted by ultrasound for 20 min, centrifuged at 12 000 r/min for 10 min, and we extracted the fruit supernatant for the analysis of organic acids. Determination of organic acids by high performance liquid chromatography [31] under these conditions: aqueous phosphoric acid solution with pH = 2.3 and methanol as mobile phase, and the test conditions were: a C18-XT column (4.6*250*5), the column temperature was set at 25°C, and the flow rate was set at 0.4 ml/min, injection volume of 10μl. Prior to the experiment, the samples were first diluted twice with the mobile phase and filtered through a 0.22μm pinhead filter.
Grapefruit volatile compounds quantified by headspace gas chromatography-ion mobility spectrometry
HS-GC-IMS was used to determine volatiles in fruit without special pretreatment of the samples. In this experiment, GAS-flavorSpec® flavor analyzer was used. The fresh grapes frozen at –80°C were beaten into a homogenate, and 1 mL of the upper liquid layer was placed in a 20 ml headspace vial; 20μg/mL of 4-methyl-2-pentanol was added for 10μL, samples were incubated at 60°C for 15 minutes, then injected. Chromatographic conditions: C18-XT column (15m×0.53mm, 1μm) with a column temperature of 60°C, the carrier gas was N2, and the IMS temperature was 45°C. This was the automatic headspace injection condition: injection volume of 100μl, incubation time of 10 min, incubation temperature of 60°C, injection needle temperature of 65°C, and incubation speed of 500 r/min; 4-methyl-2-pentanol was used as the internal standard; The concentration of 4-methyl-2-pentanol was 198μg/mL, signal peak volume was 493.34, and peak intensity was 0.401μg/ml. Flow gradients were used to optimize the separation and shorten the analysis time. There is no split injection on this instrument. The retention index (RI) and drift time (DT) of the compounds in the database were determined by orthogonal tests, which were verified by standards. The quantitative analysis was performed using 4-methyl-2-pentanol as the internal standard, and the quantitative calculations were performed by the standard internal standard method according to Equation (3).
For quantitative calculations (3).
Ci is the mass concentration of a component in grams per liter. Cis represents the mass concentration of the internal standard in grams per liter. Ai/AIS is the volume ratio between any signal peak and the signal peak of the internal standard. The qualitative analysis of the substances was conducted using the IMS and NIST databases.
Odor Activity Value (OAV) calculation
Calculate the OAV value by dividing the volatile compound concentration by the odor threshold. Compounds with OAV > 1 are considered to be vibrant aroma compounds, which play a significant role in forming the aroma characteristics of grape berries [10].
Statistical analysis of data
Excel 2010 was used to organize the test data statistically, and the significant differences between each result were checked using SPSS 23 statistical analysis. Each trait was repeated three times in biology. We expressed all data as mean± standard deviation. There was a significant difference between the two groups at P < 0.05. Simca software is used to analyze OPLS-DA and VIP values. Savitzky Golay was used to smooth and denoise the GC-IMS assay. The migration time was normalized by placing the RIP position at 1, i.e., dividing the actual migration time by the RIP peak exit time. Using this method, we were able to estimate migration time. Direct com-parison of spectral differences between samples using the Reporter plug-in and com-parison of fingerprint profiles using the Gallery Plot plug-in for visual and quantitative comparison of volatile organic compound differences between different samples; OmicShare tools were used for heat map, PCA and correlation analysis (https://www.omicshare.com/tools).
Results and analysis
Comparison of fruit agronomic traits of different grape varieties
The external indicators of the grape fruit are shown in Table 3. And as we can see from the physical and chemical characteristics of the different grape varieties(Table 4), among the nine grape varieties, the grape size ranged from 1.21cm to 1.58cm, with ‘Syrah’ having the largest grape size and mass to volume ratio of 1.58cm and 1.27cm, significantly different from the other eight varieties (P < 0.05); overall, the mass to volume ratio of the nine grape varieties was close to one, with the mass to volume ratio of ‘Syrah’> ‘Hassan’> ‘Zijingganlu’> ‘Beibinghong’> ‘Beta’. The weight of bundle was 271.63g, which was significantly different from the other eight varieties (P < 0.05), and the most bundle weight was 93.07g for ‘Hassan’; The weight of the single grape berry and juice yield were 1.88g and 64.8% for ‘Beta’, which was significantly higher than the other eight varieties (P < 0.05). ‘Hassan’> ‘Zuoshaner’> ‘Zijingganlu’> ‘Cabernet Sauvignon’> ‘Shuanghong’> ‘Beibinghong’. The most negligible single grape berry mass was 1.17g for ‘Beibinghong’, the juice yield rate of ‘Beta’> ‘Syrah’> ‘Cabernet Sauvignon’> ‘Hassan’> ‘Beibinghong’> ‘Zuoshaner’> ‘Zuoyouhong’> ‘Shuanghong’> ‘Zijingganlu’,the lowest juice yield rate was 49.6% for ‘Zijingganlu’.
Botany Characteristics of Fruits of Different Grape Varieties
Botany Characteristics of Fruits of Different Grape Varieties
Comparison of external properties of different grape varieties
Means with different letters in the same column express significant differences (Duncan’s test P < 0.05).
On the whole (Table 5), the solids and total sugar content of ‘Zuoyouhong’ were the highest, at 20.53°Brix and 196.62g/L(P < 0.05), respectively. On the other hand, the total acid and anthocyanin content of ‘Suo;huanghong’ was the highest, at 21.6g/L and 186.47mg/L, respectively, compared with the other eight varieties, these were significantly different. Phenols not only affect the sensory quality of wine grapes but also determine many physiological activities of wine grapes. They are an excellent indicator of the quality of grapes and grape winemaking. ‘Huo;assan’ had the highest total phenolic content of 0.97 g/L, which differed significantly (P < 0.05) from the other eight varieties. Tannins are mainly found in the skins, seeds, flesh, and stalks of grapes and may directly affect the color, flavor, quality, and stability of the wine and are an essential component of its astringency. Therefore, tannin content is a critical factor in producing high-quality red wines. ‘Zijingganlu’ had the highest tannin content of 1.22 g/L (P < 0.05); The most elevated pH was found in ‘Syrah’ (P < 0.05), and the lowest pH was found in ‘Shuanghong’; the total sugar content can affect both the sweetness and the perception of acid in grape products, and the taste of grapes depends not only on the mass concentration of sugar and acid but also on the sug-ar-acid ratio. The higher the sug-ar-acid ratio, the sweeter the grapes, and the higher the sug-ar-acid ratio of the nine varieties of wine grapes at maturity, from 0.24 to 0.16, with the highest sug-ar-acid ratio for the ‘Zuoyouhong’ grapes and the lowest for the ‘Syrah’ grapes.
Nutritional indicators of wine grapes
Nutritional indicators of wine grapes
Means with different letters in the same column express significant differences (Duncan’s test P < 0.05).
The CIE 1976Lab (or L*a*b*) system is the complete color model customarily used to describe all colors visible to the human eye and has now been officially adopted by countries around the world as an international standard for color measurement, which applies to the representation and calculation of all light source colors or objects colors [32]. As mentioned in the Table 6, wine grape fruit color indexes differ significantly among nine varieties, indicating that each variety had a different color, with the largest L* being ‘Syrah,’ which had the brightest color and better juice luster, followed by ‘Cabernet Sauvignon,’ and the smallest being ‘Hassan,’ which had the darkest color compared to the other varieties; the color a* values indicated the red hue of the juice, with the most prominent being ‘Beta’ and ‘Hassan’ and the smallest being ‘Syrah’—indicating that the red tones of the juice of ‘Beta’ and ‘Hassan’ are slightly higher than those of the other varieties. The chroma b* value indicates the yellow hue of the grape juice, with sample values ranging from 2.85–18.14, with ‘Zijingganlu’ being the highest and ‘Hassan’ the lowest; the saturation cab * value is a combination of chroma a* and chroma b*, indicating the degree of color saturation of the grape juice color, with the most excellent saturation being ‘Beta’ and ‘Zijingganlu,’ followed by ‘Hassan’ and ‘Shuanghong,’ ‘Zuoyouhong,’ ‘Cabernet Sauvignon’ and ‘Syrah,’ and the lowest saturation being ‘Zuoshaner’ and ‘Beibinghong’; the nine grape juice samples had hab* between 8.98 and 77.55, closer to zero close to the purple-red hue, the largest hab* was ‘Beibinghong’,indicating that the color of the wine grape ‘Beibinghong’ juice was not as red compared to the other eight varieties, and the smallest hab* was ‘Hassan,’ indicating that ‘Hassan’ was closer to the purple-red hue. Describe the degree of color difference of grape berries according to the range of color difference value units (National Bureau of Standards Unit (NBS)) given by the CIE1976Lab color space system [33]. From the Table 6, it can be seen that there are significant color differences between large color differences between all varieties.
CIELab* parameters of different grapefruit samples
CIELab* parameters of different grapefruit samples
Means with different letters in the same column express significant differences (Duncan’s test P < 0.05).
The types and contents of organic acids affect the sour taste of grapes and the taste of grape products. We can see from the Table 7, the organic acid content of various varieties is different. The highest tartaric acid content was found in ‘Shuanghong’ at 10.81 g/L (P < 0.05), followed by ’Zuoyouhong‘ and ’Zijingganlu‘, ‘Cabernet Sauvignon’ has the lowest tartaric acid content at 3.92 g/L. The malic acid in the fruit can inhibit the damage of bacteria to the flesh, which is beneficial to fruit preservation [34, 35]. The highest malic acid content was 16.27g/L for ‘Beta’, followed by ‘Shuanghong’ and ‘Beibinghong’, and the lowest malic acid content was 3.79g/L for ‘Syrah’; ‘Beta‘ had the highest citric acid content, 0.84 g/L(P < 0.05), followed by ‘Shuanghong’ and ‘Zijingganlu’.
Comparison of organic acids in fruit samples of different grape varieties
Comparison of organic acids in fruit samples of different grape varieties
Means with different letters in the same column express significant differences (Duncan’s test P < 0.05).
In addition to determining the quality of grapes and wines, volatile compounds also determine the uniqueness of wines [36]. During the test, 71 volatile compounds were detected. As seen in the Fig. 1, the blue areas indicate that the substance is lower in this grape variety, and the red areas indicate that the sample has a higher concentration of the substance. The darker the color, the greater the variation is indicated. As a whole, the volatile compounds varied considerably among the varieties.
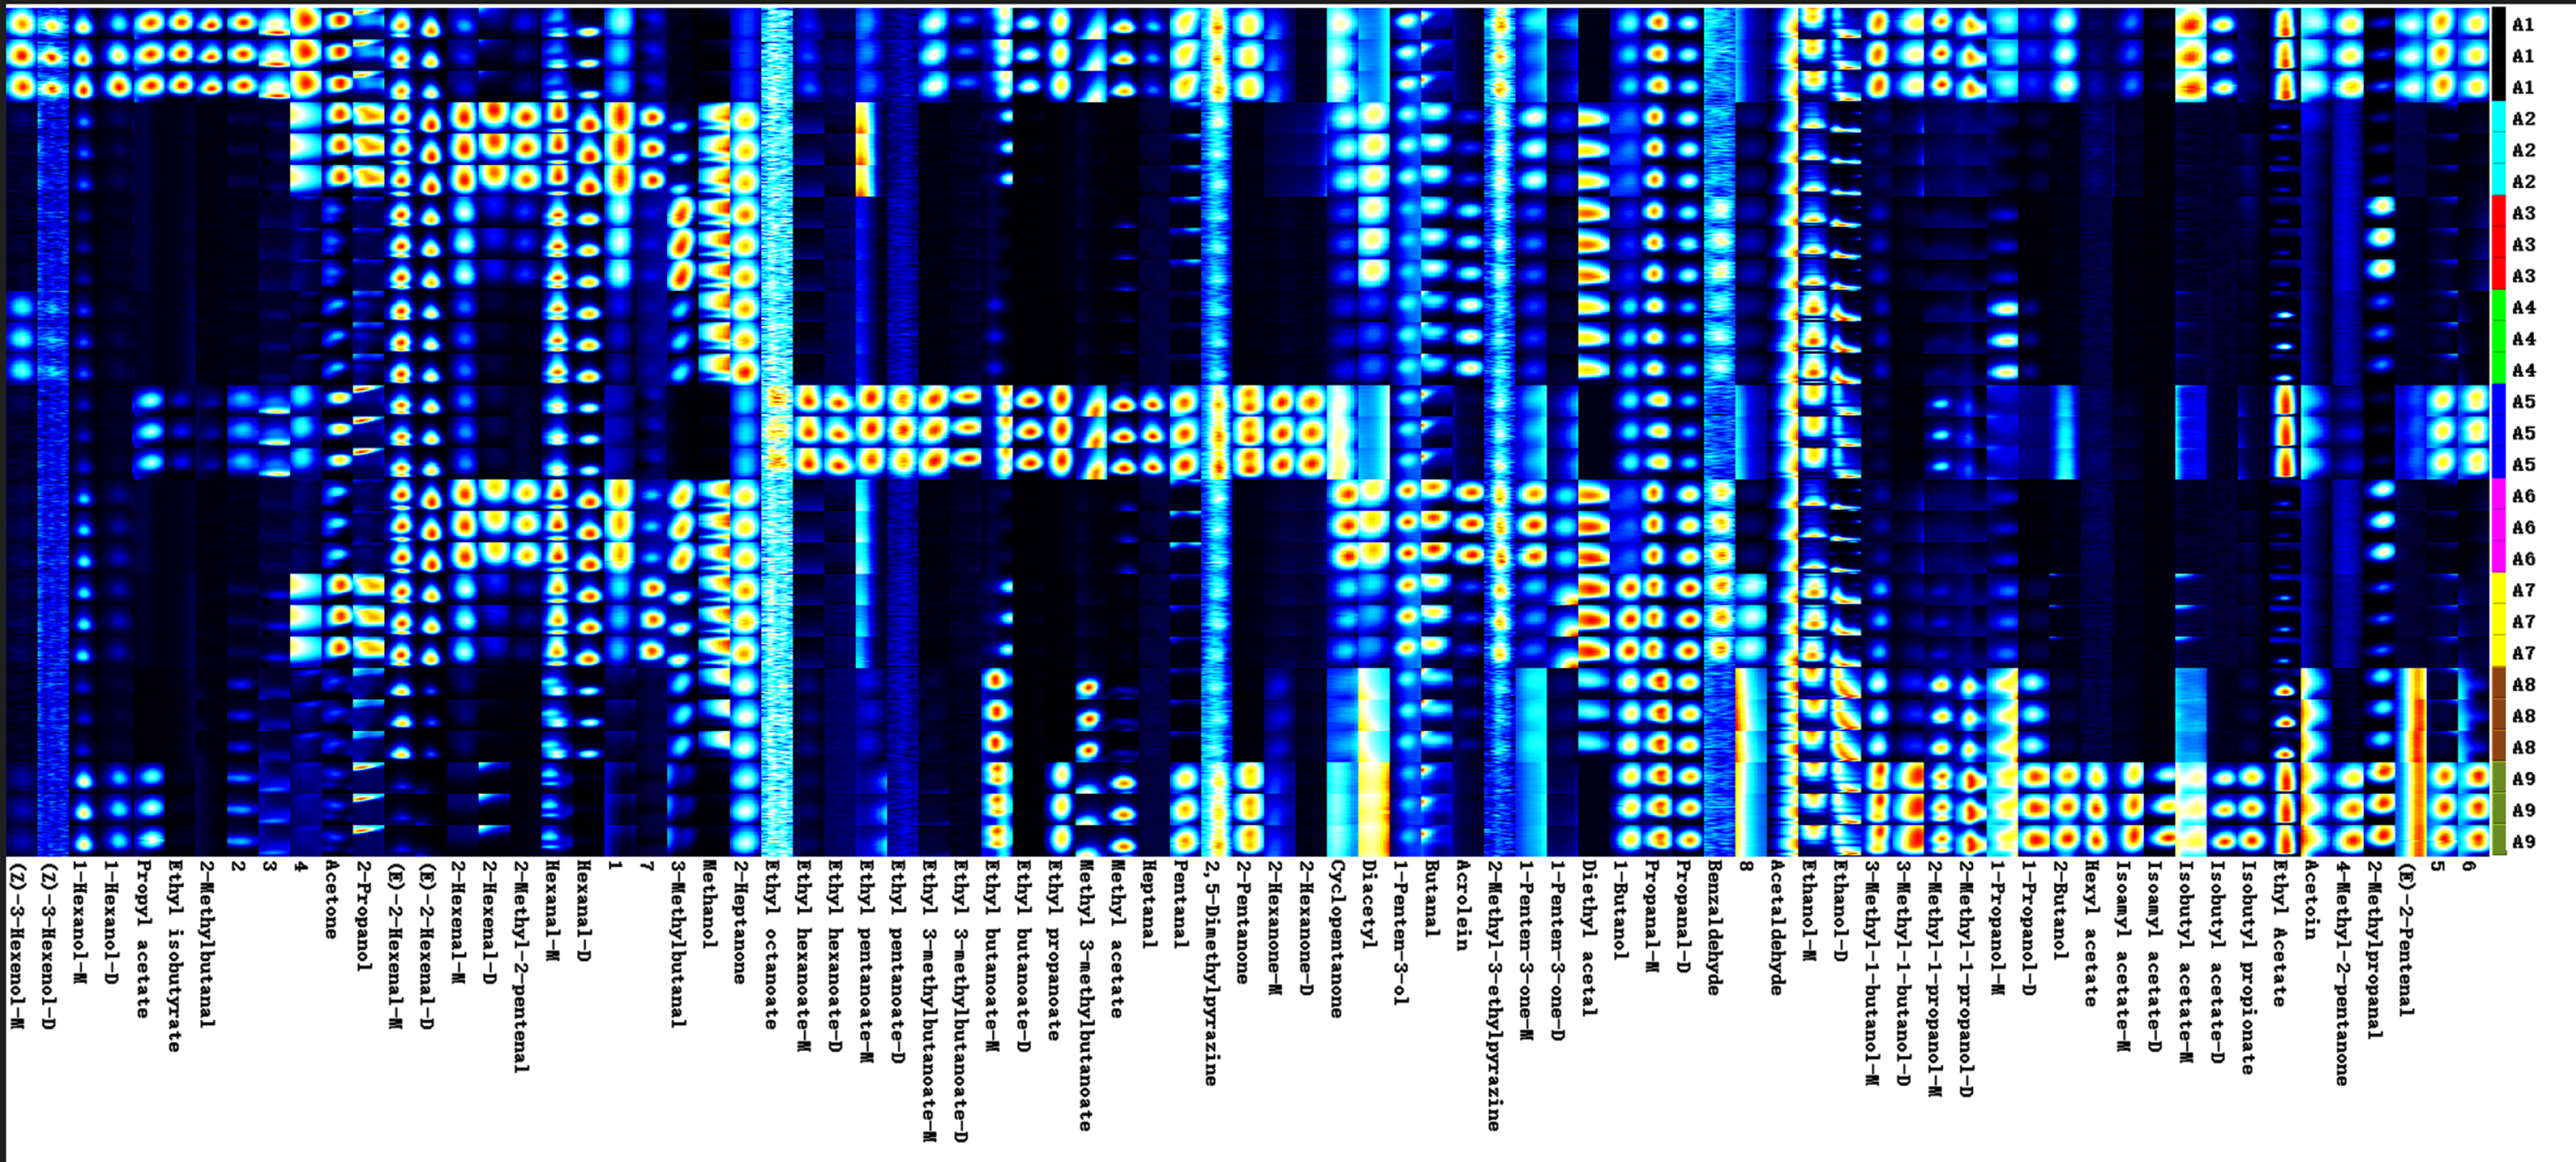
Fingerprints of volatile compounds in different varieties of grapes. Note: A1-A9 are ‘Hassan’, ‘Zuoshaner’, ‘Beibinghong’, ‘Zuoyouhong’, ‘Beta’, ‘Shuanghong’, ‘Zijingganlu’, ‘Cabernet Sauvignon’, ‘Syrah’ Each row in the figure represents all the signal peaks selected in each sample, and each column represents the signal peaks of the same volatile organic compounds in different samples, Some substances are followed by-M and-D, which are Monomer and Dimer of the same substance. The numbers are the unidentified peaks, and the colors represent the concentration of the substance, with white indicating a lower concentration, red indicating a higher concentration, and darker colors indicating a greater concentration.
‘Hassan’ grapes contain higher levels of Z-3-hexenol, 1-hexanol, propyl acetate, ethyl isobutyrate, 2-methylbutyraldehyde and acetone than other varieties. ‘Zuoshaner’ grapes contain higher levels of 2-propanol, E-2-hexenal, 2-hexenal, 2-methyl-2-pentenal, 2-methyl-2-pentenal and hexanal than other varieties; ‘Beibinghong’ contains higher levels of 3-methylbutyraldehyde and methanol than other varieties. ‘Zuoyouhong’ has a higher content of substances such as 2-heptanone than other varieties. ‘Beta’ grapes contain higher levels of ethyl octanoate, ethyl hexanoate-M, ethyl pentanoate, ethyl 3-methylbutanoate, ethyl butanoate, ethyl propanoate, methyl 3 methyl butanoate, methyl acetate, heptanal, pentanal, 2,5-dimethylpyrazine, 2-pentanone and 2-hexanone than other varieties. ‘Shuanghong’ grapes contain higher levels of cyclopentanone, 1-penten-3-ol, butanal, acrolein, 2-methyl-3-ethylpyrazine than other varieties; ‘Zijingganlu’ grapes contain higher levels of 1-penten-3-one, acetaldehyde, 1-butanol, 1-propanol, and benzaldehyde than other varieties; ‘Cabernet Sauvignon’ grapes contain higher levels of acetaldehyde and ethanol than other varieties; ‘Syrah’ grapes contain higher levels of 3-methyl-1-butanol, 2-methyl-1-propanol, 1-propanol, 2-butanol, hexyl acetate, isoamyl acetate, isobutyl acetate, isobutyl propionate, ethyl acetate, 4-methyl-2-pentanone and 2-methylpropanal than other varieties.
Table 8 shows the concentrations of volatile compounds determined by HS-GC-MS. The table below lists 71 typical volatile aroma compounds, and nine different varieties of grapes contained the same types of volatile compounds, but their contents varied greatly. Volatile compounds as a whole detected in ‘Hassan’ fruit was 58160.24μg/L, as compared to the other eight varieties, this was significantly higher, followed by ‘Beta’ 53287.78μg/L,’ Syrah’ 52144.75μg/L, ‘Zijingganlu’ 43863.56μg/L, ‘Cabernet Sauvignon’ 43678.17μg/L, ‘Zuoshaner’ 42201.41μg/L, ‘Shuanghong’ 39846.59μg/L, ‘Zuoyouhong’ 37576.72μg/L, and ‘Beibinghong’ 34187.72μg/L. Among the 71 aroma compounds detected, 21 esters, 19 aldehydes, 18 alcohols, 11 ketones, and two pyrazines were detected; In terms of the percentage of each type of compound in the total volatile compounds of each variety, alcohols, aldehydes and Esters take into account a relatively large proportion.
Composition of volatile compounds in different varieties of grapes
Means with different letters in the same column express significant differences (Duncan’s test P < 0.05). -M and -D, which are the Monomer and Dimer of the same substance.
Esters are abundant in each species, and as can be seen from the aroma descriptions in the table, fruit flavors dominate the esters; Ethyl acetate was the highest content among the Esters in each variety, and ethyl acetate best reflected the fruit flavors, with the wine grape varieties ‘Beta’ and ‘Syrah’ containing the highest ethyl acetate content at 11385.5μg/L and 11339.68μg/L, followed by ‘Hassan’ 10286.71μg/L, ‘Cabernet Sauvignon’ 4253.74μg/L, ‘Zouyouhong’ 1686.93μg/L, ‘Zijingganlu’ 1413.18μg/L, ‘Zoushaner’ 968.93μg/L and ‘Beibinghong’ 830.38μg/L.
Alcohols also accounted for a large proportion of the volatile compounds detected, with the highest alcohol content in ‘Cabernet Sauvignon’ and ‘Syrah’, with 25817.85μg/L and 25463.55μg/L, respectively. Followed by Hassan 22089.13μg/L, ‘Zijingganlu’ 18469.46μg/L, ‘Zouyouhong’ 17618.16μg/L, Beta 15348.81μg/L, ‘Zoushaner’ 11385.69μg/L, ‘Beibinghong’ 11035.42μg/L and ‘Shuanghong’ 10149.63μg/L.
The Aldehydes content of each variety ranged from 7587.31μg/L-26105.77μg/L, accounting for 14.55% –65.52%, with the highest content being ‘Shuanghong’ at 26105.77μg/L, followed by ‘Zoushaner’ 25763.4μg/L, ‘Beibinghong’ 20185.95μg/L, ‘Zijingganlu’ 20129.38μg/L, ‘Zouyouhong’ 16252.3μg/L, ‘Hassan’ 15661.31μg/L, ‘Beta’ 14060.6μg/L, ‘Cabernet Sauvignon’ 10477.4μg/L and ‘Syrah’ 7587.31μg/L.
The total concentration of Ketones and Pyrazines was low, varying from variety to variety of wine grapes, accounting for 2.72% –6.87% and 0.37% –0.56% of the total volatile compounds, respectively.
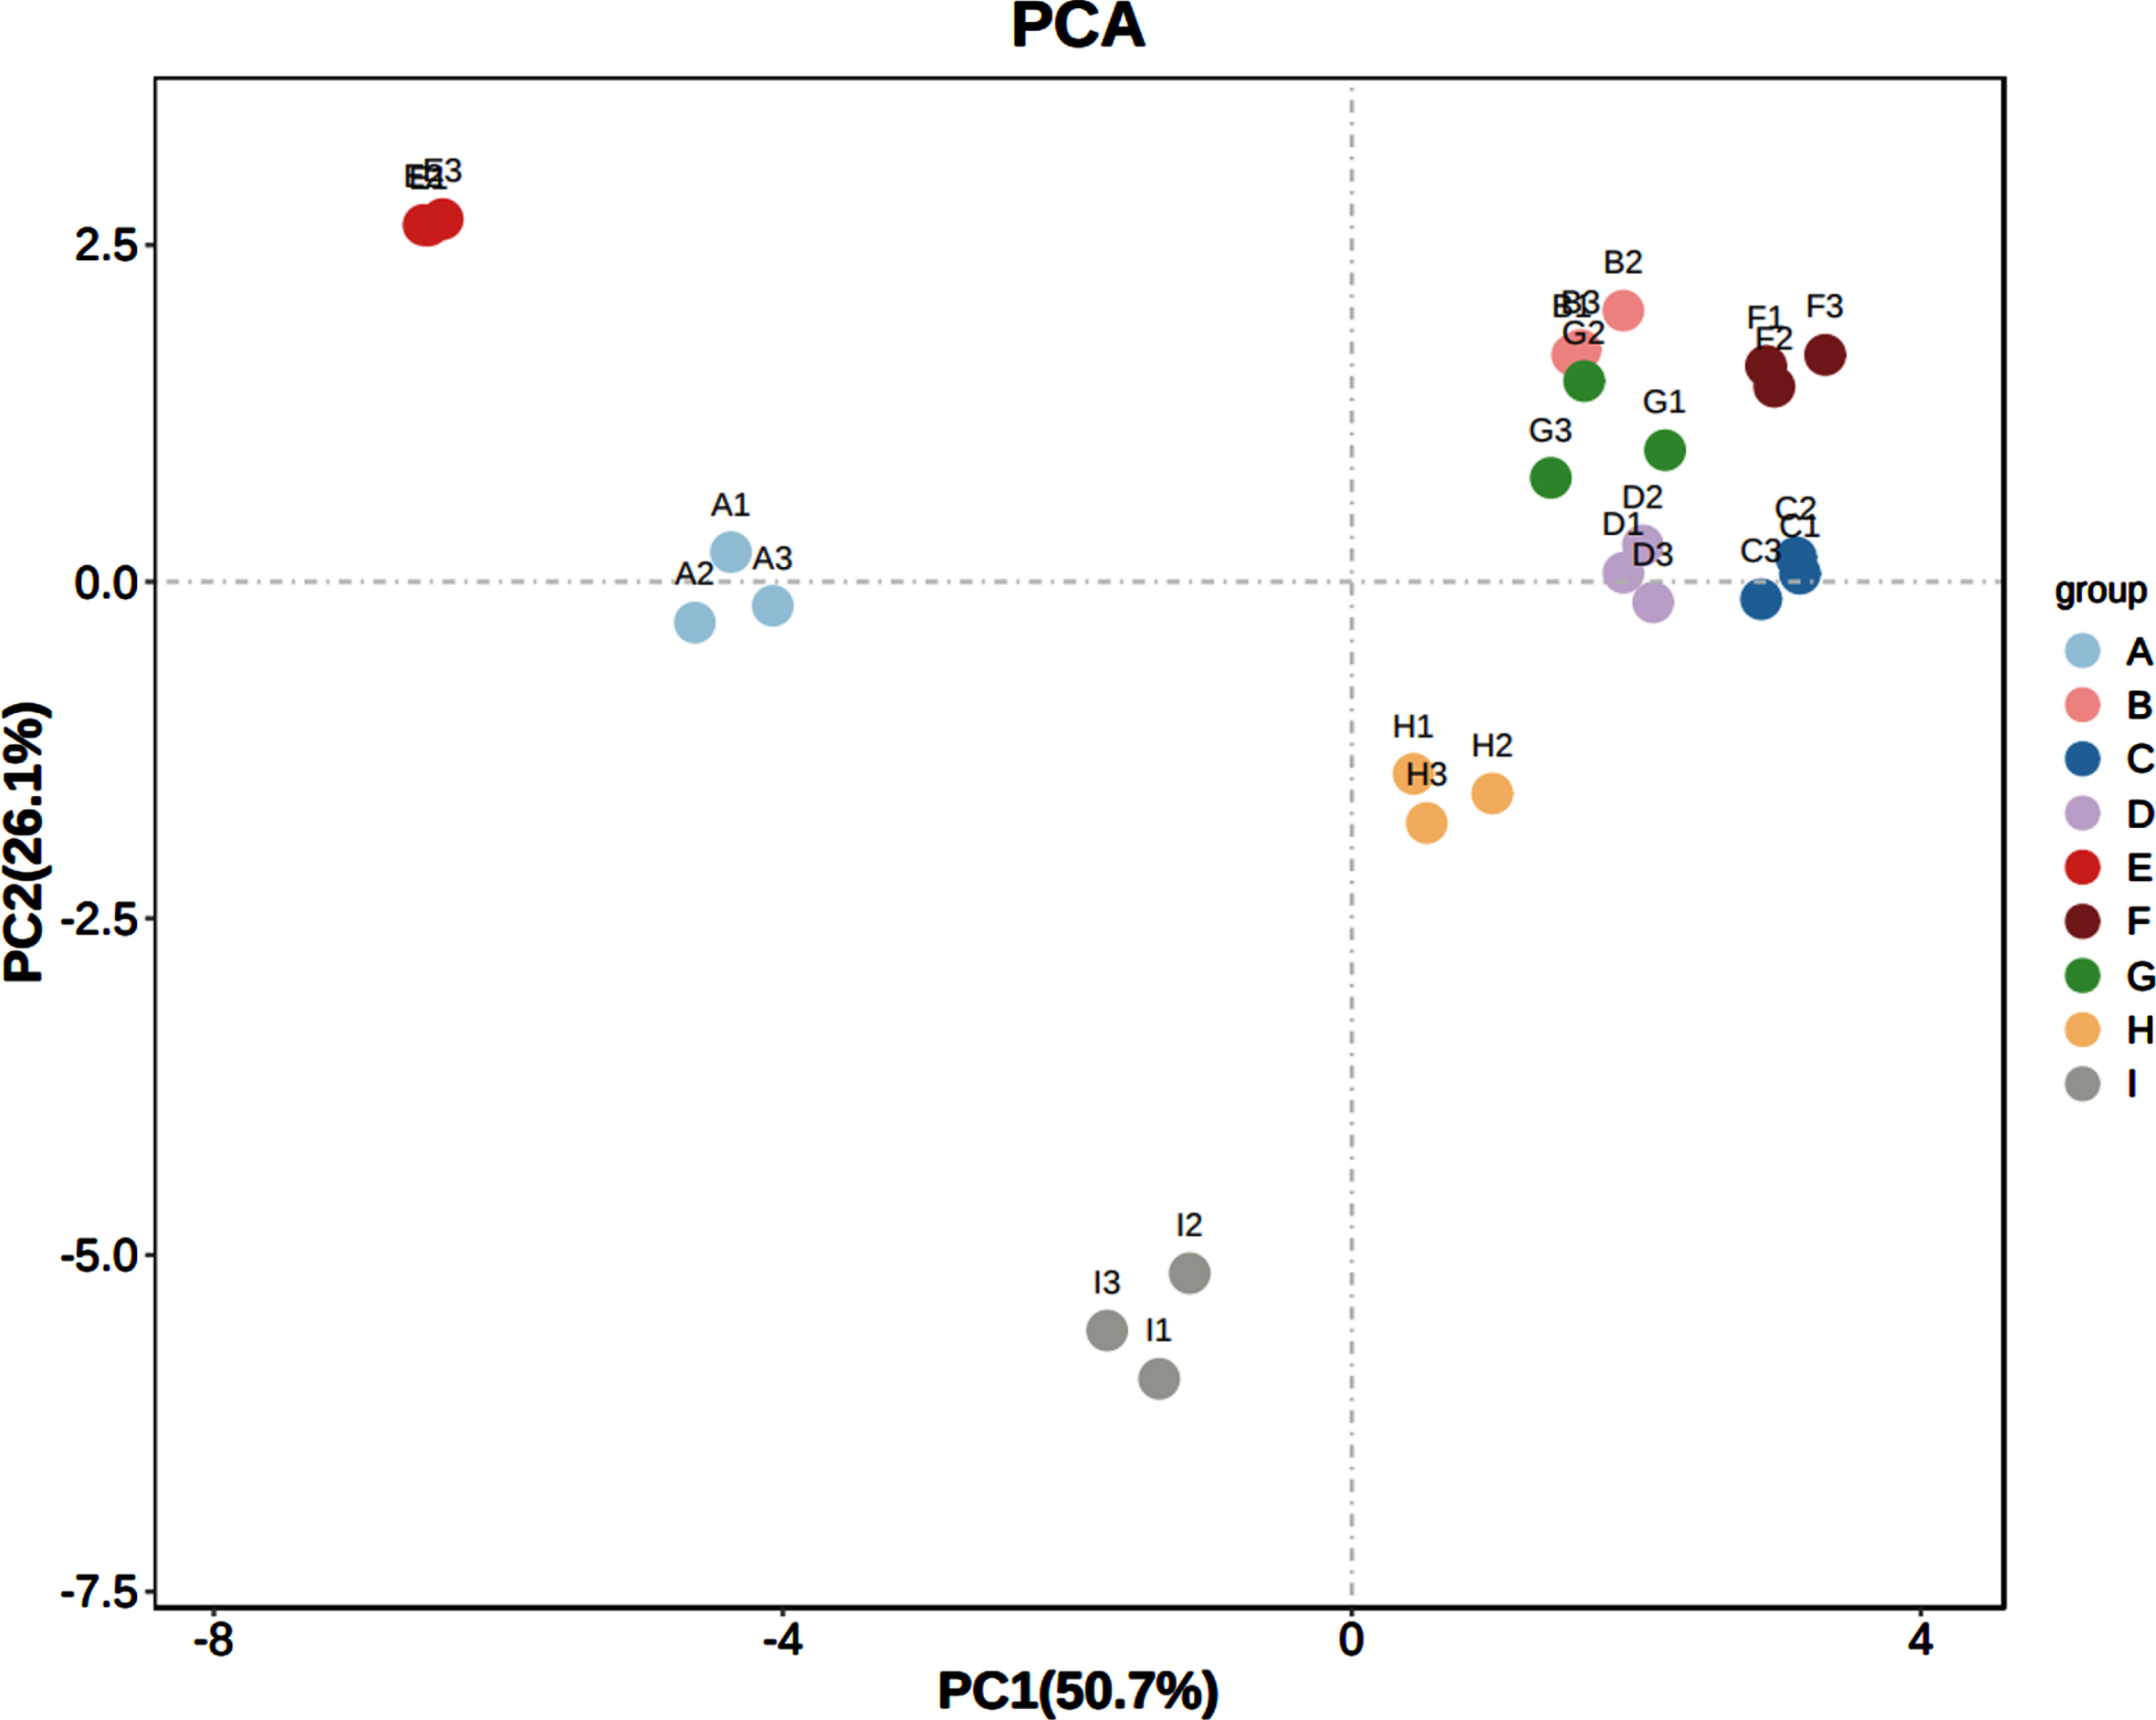
As a way of better presenting and distinguishing the differences between wine samples of different varieties, PCA was used to analyze volatile compounds identified by HS-GC-IMS. Nine samples could be distinguished according to their aroma characteristics and varieties. ‘Zoushaner’, ‘Beibinghong’, ‘Zouyouhong’, ‘Shuanghong’, and ‘Zijingganlu’ samples were closer to each other, while ‘Hassan’, ‘Beta’, ‘Cabernet Sauvignon’, and ‘Syrah’ were farther away, which indicated that there were significant differences between the aroma characteristics of different samples (Fig. 2, Fig. 3).

PCA analysis of the sample. Note: A-I are ‘Hassan’, ‘Zuoshaner’, ‘Beibinghong’, ‘Zuoyouhong’, ‘Beta’, ‘Shuanghong’, ‘Zijingganlu’, ‘Cabernet Sauvignon’, ‘Syrah’.

Heat map analysis of aromatic compounds with OAV > 1 in nine grape fruits. Note: A-I are ‘Hassan’, ‘Zuoshaner’, ‘Beibinghong’, ‘Zuoyouhong’, ‘Beta’, ‘Shuanghong’, ‘Zijingganlu’, ‘Cabernet Sauvignon’, ‘Syrah’.
Flavor is generally believed to be directly affected by components with OAV greater than one. Based on the qualitative and quantitative results of HS-GC-IMS, the thresholds of the corresponding aroma compounds in water were found through the literature, and their OAV values were calculated [37–42].
HS-GC-MS measures volatile compound odor activity values (OAV). 19, 17, 16, 16, 18, 16, 19, 18, and 20 aroma compounds with OAV > 1 were calculated to be detected in the nine wine grape samples (Table 9), which were considered to contribute to the grapefruit aroma. Among them, as a whole, the aroma compounds with OAV > 1 were 13 in the ester group, namely Isoamyl acetate-M, ethyl 3-methylbutanoate-M, Ethyl 3-methylbutanoate-D, ethyl butanoate-M, ethyl butanoate-D, ethyl hexanoate-M, ethyl isobutyrate, ethyl acetate, ethyl pentanoate-M, ethyl pentanoate-D, ethyl hexanoate-D, ethyl octanoate, isoamyl acetate-D. Six aldehydes types: hexanal-M, hexanal-D, isobutyraldehyde, acetaldehyde, 2-methylbutyraldehyde, and isovaleraldehyde; two types of pyrazines, namely 2,5-dimethylpyrazine and 2-methyl-3-ethylpyrazine. Although the OAV values of key aroma compounds in the nine wine grape fruit samples varied, in general, aldehydes had higher OAV values than other types of compounds because, although most aldehydes produce specific green, fatty, or fat beef aromas at low concentrations, they can also cause sourness, coloration or other unpleasant flavors at high concentrations due to their low threshold values. For example, Hexanal contributes to a desirable green, fresh and fatty aroma at low concentrations, but When concentrations reach critical levels, it can exhibit an “oxidized” off-flavor. Therefore, it is generally recommended to limit the content of aldehydes within a certain range, and the OAV values of hexanal monomer and dimer were found to be 44.7–125.04 and 8.78–341.78 for each variety. The OAV values of 2-methylbutyraldehyde and acetaldehyde in all varieties were more significant than 1. Among the esters, the OAV values of ethyl isovalerate-D in ‘Hassan’ and ‘Beta’ were higher than in the other varieties. Ethyl butyrate in ‘Beta’ had OAV values greater than 100, higher than those of the other varieties, making an essential contribution to providing estery aromas in wine grapes; the OAV values of pyrazine compounds in all varieties were around 1.
OAV analysis of main aroma compounds in different grape varieties
OAV analysis of main aroma compounds in different grape varieties
High concentrations are represented in red; low concentrations are represented in blue. The attention of aroma substances with OAV values greater than 1 in the volatile compounds of the nine grapes samples was clustered using hierarchical analysis, and similarity was calculated using Pearson distance. A heat map analysis was conducted for each fruit sample. The example shows a high expression of the compound in red, while the selection highlights a low expression of the compound in blue, clearly showing the difference in concentration between the various types of substance.Clustering of the concentrations of aroma substances with OAV values greater than 1 in nine grape samples with volatile compounds by PCA (Fig. 4). Among the different varieties of wine grape fruit, ‘Zijingganlu’, ‘Beibinghong’, ‘Zuoshaner’, ‘Zuoyouhong’, and ‘Shuanghong’ were clustered together with more similarities among them and located in the first quadrant of the score, with positive values on PC1 and PC2, ‘Cabernet Sauvignon’ fruit samples were located in the second quadrant, with positive values on PC1 and PC2, ‘Syrah’ was located in the third quadrant with negative scores on PC1 and PC2, ‘Hassan’ fruit samples were located at the junction of the third and fourth quadrants with negative scores on PC1, and ‘Beta’ fruit samples were in the fourth quadrant with negative scores on PC1 and positive scores on PC2.
Scatter diagram of PCA analysis of volatile aroma compounds with OAV value greater than 1 in grapefruit. Note: A-I are ‘Hassan’, ‘Zuoshaner’, ‘Beibinghong’, ‘Zuoyouhong’, ‘Beta’, ‘Shuanghong’, ‘Zijingganlu’, ‘Cabernet Sauvignon’, ‘Syrah’.
0.8 to 1.0 is indicative of significant correlations between substances, 0.6 to 0.8 is indicative of strong correlations, 0.4 to 0.6 is indicative of moderate correlations, and 0.2 to 0.4 is indicative of weak correlations.
In the correlation analysis of Fig. 5, the Pearson correlation coefficient of the red box was significantly correlated. The correlation between ethyl hexanoate-M, ethyl 3-methylbutanoate-D, ethyl butanoate-D, ethyl hexanoate-D, and 2,5-Dimethylpyrazine was very significant, Isoamyl acetate-M was strongly correlated with Ethyl butanoate-M, Hexanal-M was very strongly correlated with Hexanal-D, Ethyl 3-methylbutanoate was strongly correlated with M-Ethyl butanoate-M and Ethyl Acetate was very significant, Ethyl 3-methylbutanoate showed a strong correlation with M-Ethyl butanoate-D, Ethyl isobutyrate, Acetaldehyde, 2-Methylbutanal, 2,5-Dimethylpyrazine, Ethyl butanoate-M showed a strong correlation with Acetaldehyde, 2-Methylbutanal, Ethyl Acetate, Ethyl butanoate-D showed a strong correlation with 2,5-Dimethylpyrazine, 2-Methylbutanal, Ethyl isobutyrate showed a strong correlation with Ethyl pentanoate-D, Ethyl Acetate, Ethyl Acetate showed a strong correlation with 2,5-Dimethylpyrazine, 2-Methylbutanal, Acetaldehyde, Acetaldehyde showed a strong correlation with 2-Methylbutanal. -Ethyl pentanoate-M was strongly correlated with Ethyl hexanoate-D.

Analyses of the correlation between aroma compounds and OAV greater than 1 in nine grape varieties.
There was a very significant negative correlation between Hexanal-M and Ethyl Acetate, Ethyl 3-methylbutyrate-M and 3-methylbutyraldehyde, and Ethyl Acetate and 3-Methylbutyraldehyde.
In OPLS-DA analysis, differences between samples are not only identified, but also characteristic markers of the differences can be acquired [41]. To analyze the OPLS-DA results, we used OAV values greater than 1 for grapefruit aroma components as Y variables., and the magnitude of VIP values of crucial variables formed by OPLS-DA was used for critical variable analysis. Generally, variables with VIP values greater than 1 were considered to be metabolites that contributed to differences between groups. Grapefruits’ aroma quality relies on the interaction of multiple aroma compounds. VIP values > 1 were screened for compounds (Table 10). The results revealed that the compounds 2-Methylpropanal, Hexanal-D, 2-Methylbutanal, Ethyl octanoate, Ethyl butanoate-D, and Ethyl butanoate-M, which may influence aroma differences, were related (Fig. 6).
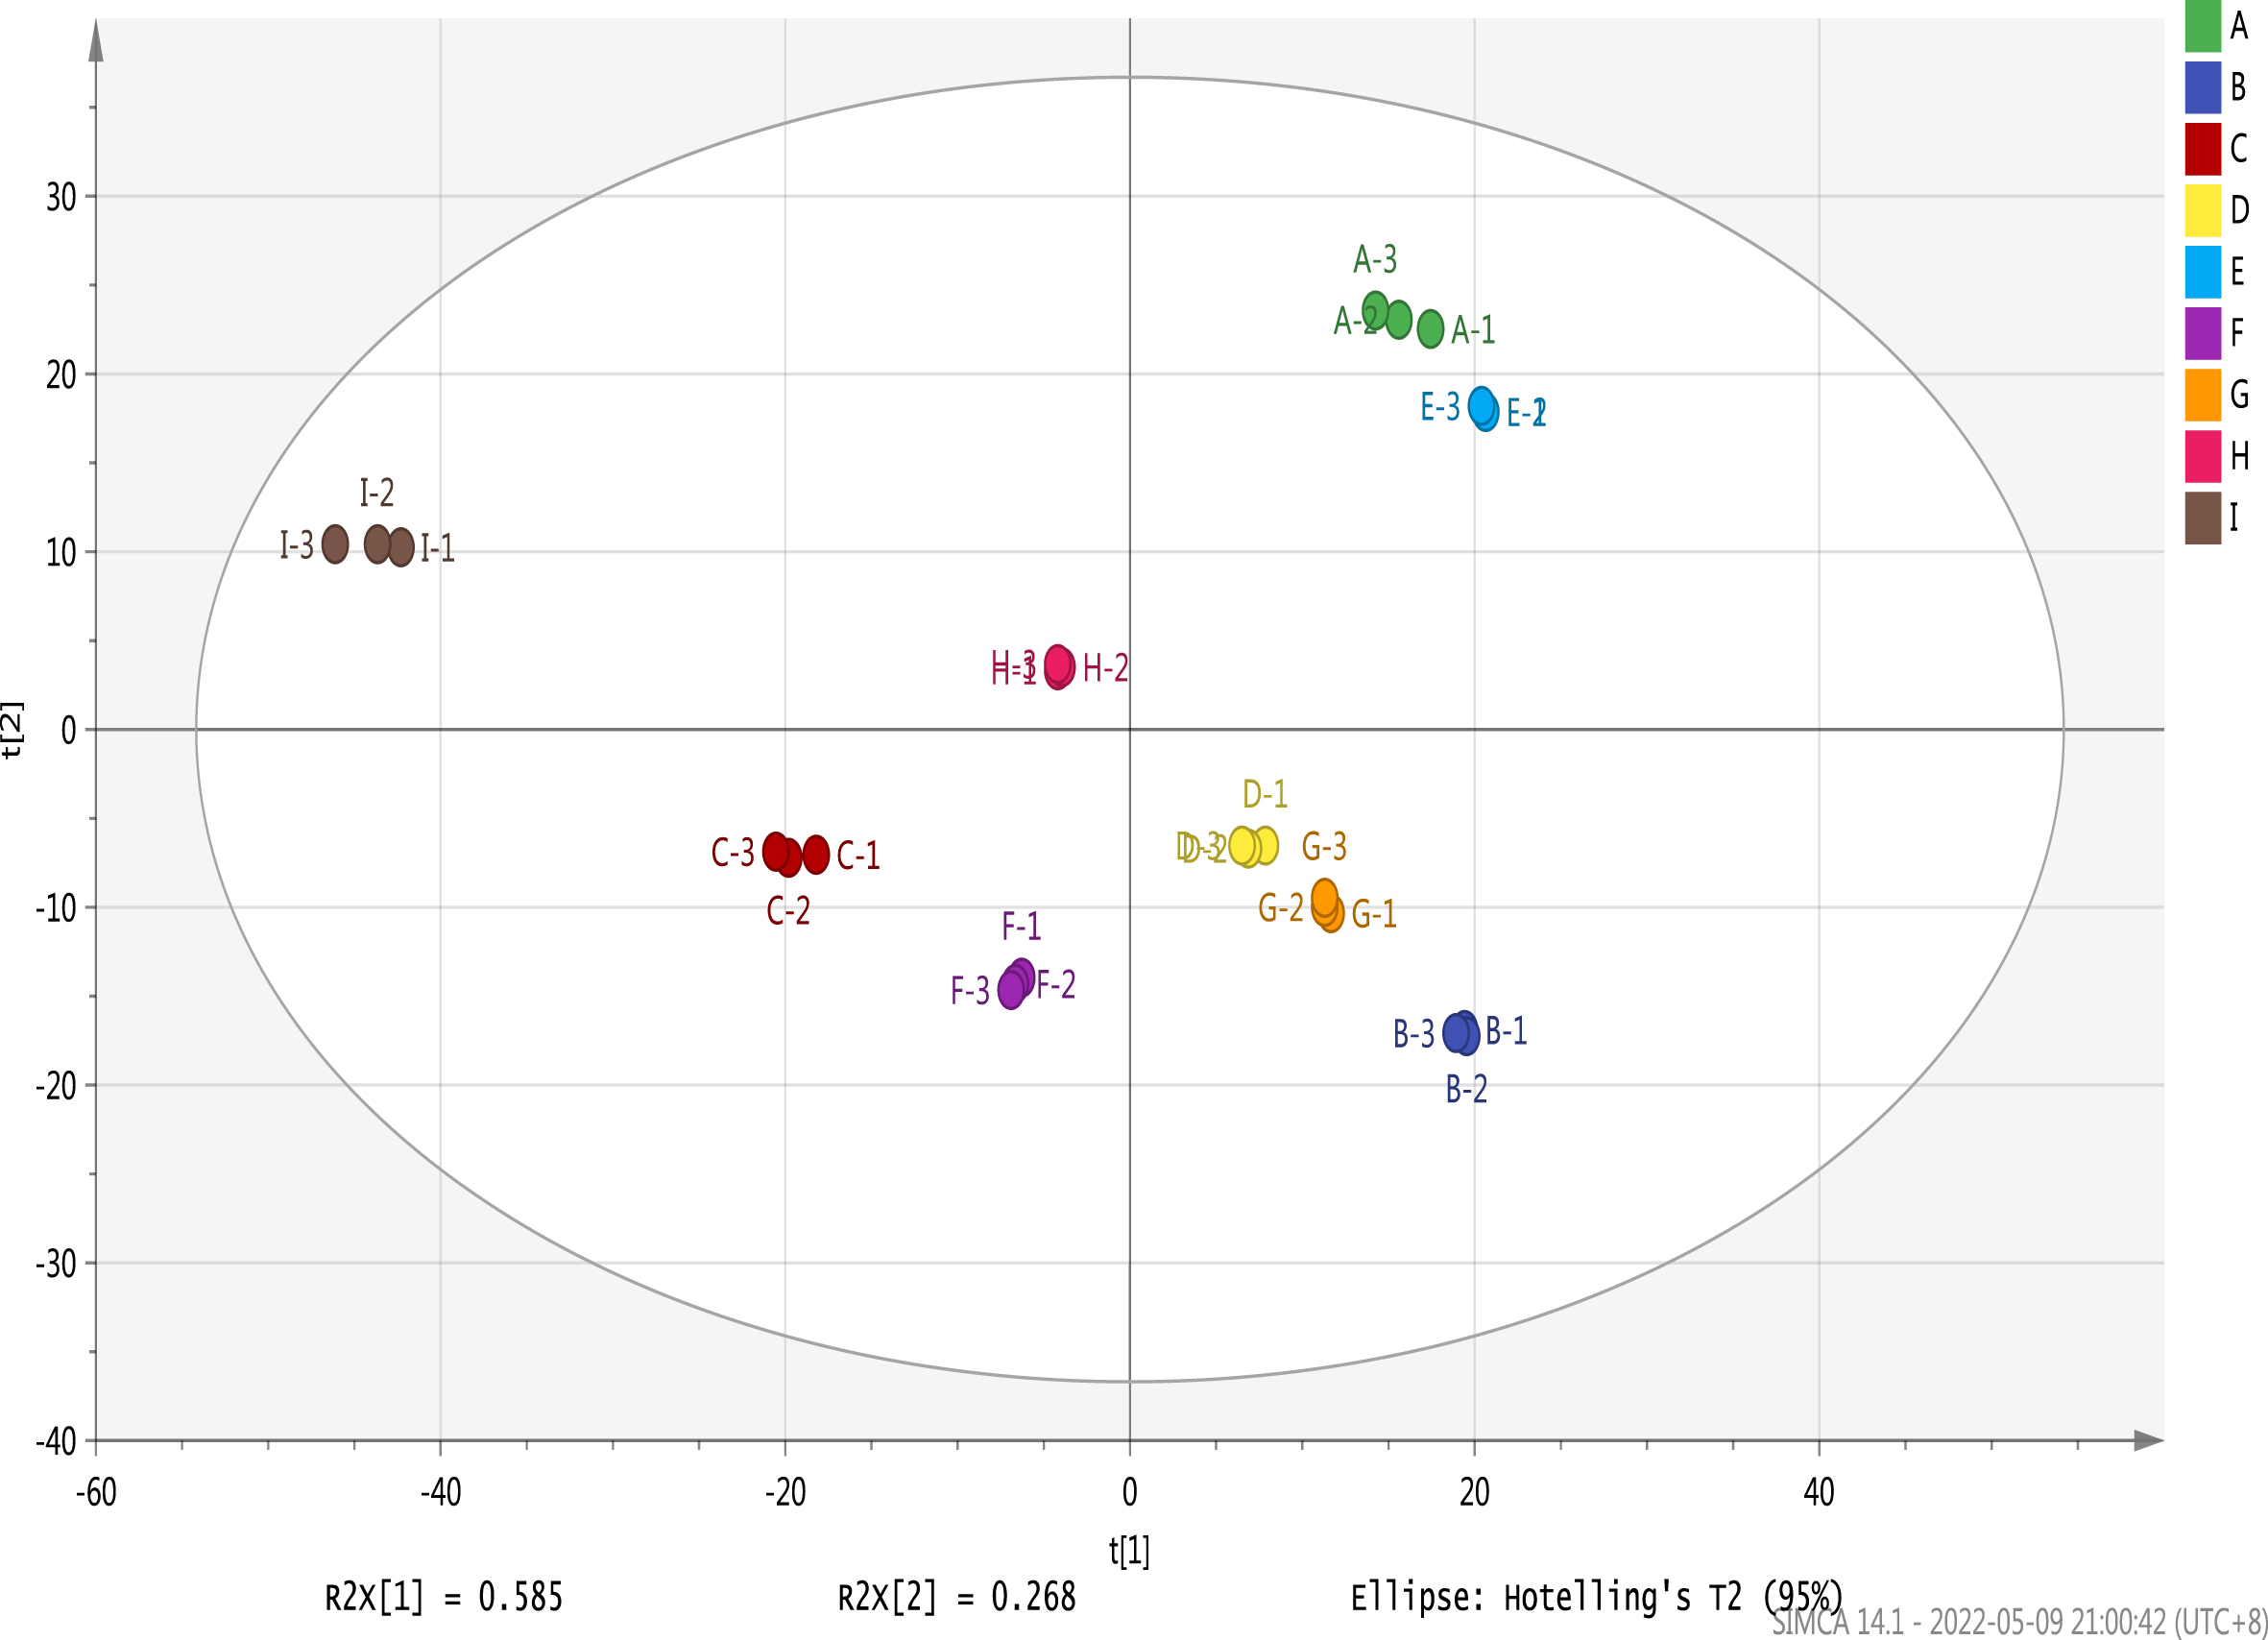
A volatile aroma compound with OAV value greater than 1 in grape fruit OPLS-DA. Note: A-I are ‘Hassan’, ‘Zuoshaner’, ‘Beibinghong’, ‘Zuoyouhong’, ‘Beta’, ‘Shuanghong’, ‘Zijingganlu’, ‘Cabernet Sauvignon, ‘Syrah’.
Analysis of VIP Values of Aroma Compounds in Different Grape Varieties
Variety is, to some extent, a key factor in the aromatic characteristics of the fruit. There are significant genetic differences between different wine grape varieties, which result in different aromatic compositions. The characteristic compounds of grape varieties are flavor specific, allowing for different types and styles of wine. Rapp [44] classifies German wines made from different varieties of white grapes into three main categories: “Riesling", “Rosé” and “Pinot Blanc", depending on the content of the 12 monoterpenes in the wine. Hu Boran [45] et al. examined the aroma composition of ‘Cabernet Sauvignon’, ‘Merlot’, ‘Serrano’, and ‘Chardonnay’ grapes at the eastern foot of the Helan Mountains, from which 43, 47, 51, and 81 aromatic substances were detected, respectively, all of which were identical to each other as well as unique to each other. This is similar to the results of our study. Desheng Zhao [46] on Hebei shore mather and ‘cabernet sauvignon’ berries aromas in composition analysis found the evidence difference existed in the composition and content of aroma, octylic acid ethyl ester, 4 - methyl amyl alcohol, 3, 4 - dimethyl - l - amyl alcohol, geraniol, linalool is region offers mather distinguished from ‘Cabernet sauvignon’ grapes of the characteristic aroma substances. Mather orchid acetic acid in the grapes The contents of butyl ester, butanol, 2-heptanol, and cis-3-hexene-L-alcohol were significantly higher than those in ‘Cabernet Sauvignon’. In contrast, the contents of 2-ethyl-L-hexol and trans-2-octene-L-alcohol were significantly lower than those in dry ‘Cabernet Sauvignon’.
This study analyzed and detected the morphological indexes, fundamental physicochemical indicators, and color and aroma substances of grape fruits collected in 2021 from nine varieties at the maturity stage. The results of the study found that, in terms of morphological indicators, the nine varieties had berry sizes between 1.21cm and 1.58cm, with ‘Syrah’ having the largest berry size to mass to volume ratio, ‘Beta’ having the highest juice yield and ‘Beibinghong’ having the highest bunch weight. The tests carried out on the basic physicochemical properties of the grapes revealed that ‘Hassan’ had the highest total phenolic content, ‘Zuoyouhhong’ the highest solids and total sugar content, ‘Shuanghong’ the highest total acid and anthocyanin content, and ‘Zijingganlu’ the highest tannin content and acid fixation ratio. The CIELab parameters show that the closest of the nine varieties of grape juice to the purple-red hue is the ‘Hassan’ variety, the’ Syrah ‘juice has a good gloss, the ‘Beta’ and ‘Hassan’ juices have an excellent red hue, and the ‘Zijingganlu’ juice has a pleasing yellow hue, with the ‘Beta’ and ‘Zijingganlu’ juices being the most saturated. It was found that 71 kinds of volatile aroma compounds were detected in nine kinds of grapefruits, mainly esters, and the highest total content of volatile aroma compounds was ‘Beta’. In this study, OAV values were used as evaluation indicators for the comprehensive analysis of the aromas of nine grape varieties. The OAV values of each aroma compound in the different varieties were calculated using the thresholds of each volatile compound, and 19, 17, 16, 16, 18, 16, 19, 18, 20 volatile components with OAV greater than 1 were screened out, respectively. To further discuss the aroma characterization compounds, VIP values > 1 were calculated for six combinations, 2-Methylpropanal, hexanal-D, 2-Methylbutanal, ethyl octanoate, ethyl butyrate-D, and ethyl butyrate-M, between groups by OPLS-DA calculations, indicating that the compounds that may affect the aroma differences may be related to 2-Methylpropanal, Hexanal-D, 2-Methylbutanal, Ethyl octanoate, Ethyl butanoate-D, and Ethyl butanoate-M.
Fruit flavor, color, and nutrients are the main factors of investigation to evaluate fruit quality differences [47]. In contrast, the intrinsic quality performance of grapes is the key to determining their commercial value and can be an essential basis for inter-varietal adaptability evaluation and promotion [48]. The Vitis amurensis -growing center in northeastern China is a characteristic grape growing base in China [49], and by analyzing and comparing the flavor, color, and nutrient composition of grape berries in northeastern China, we characterized the volatile aroma and essential aroma-presenting substances to find the varietal differences of different grape varieties.
In future research, the varietal uniqueness of different types of grapes can be used to develop processed grape products with varietal characteristics, such as color, aroma, and taste analysis of raw grape wine made from different varieties of grapes, and in the future, the mechanism of the formation of grape aroma substances can be explored. In addition to analyzing different varieties of grapes, the quality of grapes grown in different regions and habitats is also necessary for research in the field of grapes, high-throughput assays can also be used to detect and analyze metabolites affecting interspecies variation, allowing for a more intuitive screening of differential metabolites. This study provides valuable information for future scientific collection, conservation, and utilization of grape resources. Compared with other regions, there are still gaps in the development of Chinese grapes and processed grapes, and the international market share is small. Exploring the differences in grape variety quality and improving the quality of Chinese grapes in different aspects will help the development of the Chinese grape industry.
Footnotes
Acknowledgments
We thank the Fruit Tree Research Laboratory of the Institute of Special Animal and Plant Sciences of Chinese Academy of Agricultural Sciences for their great help in the experiment.
Funding Statement
This work was supported by the Science and Scientific and Technologic Foundation of Jilin Province (20200402076NC).
Conflict of interest statement
The authors declare that they have no competing interests.
Author Contributions
Conceptualization, Weiyu Cao and Wenpeng Lu; Data curation, Weiyu Cao and Jinli Wen; Formal analysis, Weiyu Cao, Nan Shu, Yiming Yang and Jinli Wen; Funding acquisition, Wenpeng Lu; Investigation, Nan Shu; Methodology, Weiyu Cao;Project administration, Wenpeng Lu; Resources, Wenpeng Lu; Software, Weiyu Cao and Nan Shu; Supervision, Wenpeng Lu; Validation, Weiyu Cao and Yiming Yang; Visualization, Weiyu Cao and Yiming Yang; Writing –original draft, Weiyu Cao; Writing –review & editing, Weiyu Cao.