
Abstract
Barberries are versatile shrubs with diverse applications, including ornamental, medicinal, and edible purposes. In this study, we employed molecular markers to assess the genetic diversity and genetic base of superior barberry genotypes selected from an F1 population obtained through Shahrood University Barberry Breeding Program (SUBBP), alongside their parents. We utilized nine ISSR markers and 10 RAPD markers to analyze the population’s genetic diversity. From these markers, we obtained 98 polymorphic bands using ISSR markers and 112 polymorphic bands using RAPD markers. The average PIC value was 0.16 for ISSR markers and RAPD markers, while the average genetic resolution power was 3.93 for ISSR markers and 2.11 for RAPD markers. Furthermore, we calculated the genetic dissimilarity coefficient (GDC) based on ISSR and RAPD markers, which ranged from 0.23 to 0.86 (average 0.62) and 0.21 to 0.85 (average 0.60), respectively. The ISSR data analysis classified the genotypes into three main clusters, with genotypes 0515, R5N1, ‘Bth’, ‘Seedless (BD)’, and R2N1 being genetically distant from the others. Similarly, the analysis of 10 RAPD primers resulted in the classification of genotypes into three main groups. Notably, genotype 0609 exhibited greater genetic distance from other genotypes in this subgroup. The Principal Coordinates Analysis (PCoA) using both ISSR and RAPD marker data further supported the grouping of genotypes into three distinct clusters. These results provide valuable insights into the genetic composition of the F1 population and contribute to the advancement of barberry breeding strategies.
Introduction
Barberries are versatile shrub with ∼ 500 species distributed across mountainous regions in the northern and southern hemispheres [1]. They are used for ornamental, medicinal, and edible purposes, and its fruit contains high levels bioactive compounds such as phenolic acids, antioxidants [2–4]. Iran is a major producer of barberry for juice and dried fruit consumption, with more than 20,000 hectares of land devoted to the cultivation of a cultivar, ‘Zereshk Bidaneh’ (BD) in the central deserts [5, 6]. This cultivar has dark red seedless berries. Wild barberries are also found in mountainous and cold regions of Iran, and their dark-blue fruits are mostly used locally for juice extraction [6]. In Shahrood University Barberry breeding program (SUBBP), an F1 population was obtained from the diallele crossbreeding between some superior selections obtained from intercrossing elite cultivars ‘Zereshk Bidaneh’ and genotypes with superior traits (R2N1, R4N1 and R5N1). The population was evaluated for morphological traits in this initial experiment and several superior genotypes were introduced [7].
Estimating genetic diversity is a foundational and essential component in the design and management of breeding programs. It serves as a crucial tool for mitigating the risk of inbreeding depression, enhancing the adaptability and productivity of populations. This process empowers breeders to make informed decisions when selecting individuals for breeding, ultimately contributing to the enduring success and sustainability of the program [8]. The application of molecular markers, especially DNA-based markers, can complement classical genetic methods and shortening the time of genetic programs, enhancing accuracy, and saving labor and costs [9]. Molecular markers such as ISSR, RAPD, AFLP, and SSR, show differences between individuals at the molecular DNA level, are well distributed across the genome, and they can be present in coding and non-coding sequences [10–12]. Molecular DNA markers in studies of wild barberry species from a range of geographical areas indicate high genetic diversity inter and intra species of Berberis [13–16]. Koteswara Rao, Kapadia [17] showed that RAPD and ISSR markers have a high level of polymorphism, which can be used to assess genetic diversity in future studies. The objective of this study was to use RAPD and ISSRs to estimate the genetic diversity of 34 barbery accessions in SUBBP. This information can provide valuable insights into the extent of genetic diversity within the population and can aid in the development of breeding strategies that can enhance the quality and productivity of barberry crops.
Materials and methods
Plant materials
Thirty-four genotypes, including 29 hybrid genotypes from an F1 population of SUBBP resulting from reciprocal crosses between selected wild berberis genotypes (R2N1 and R4N1 from the B. integerrima, and R5N1 from the B. crataegina) and ‘Zereshk Bidaneh’, are used in this study. The parents of the hybrid genotypes were also included in the study. In addition, an ornamental Japanese barberry was used as a control for comparison (Table 1).
Collection details, offspring, and parent codes of Barberry genotypes investigated in this study
Collection details, offspring, and parent codes of Barberry genotypes investigated in this study
*: OP: Open Pollination, P: Parent.
Fresh leaves were sampled and stored at –80°C until DNA extraction. Genomic DNA was extracted from young leaves of each plant using a modified CTAB method. The quality and quantity of the extracted DNA were assessed using a NanoDrop spectrophotometer. PCR amplification was conducted using Mastermix X2 from Sinacolon Co, Iran, which contains Ampliqon Taq DNA polymerase, MgCl2, dNTPs, and a neutral blue dye and stabilizer. The primers, provided by Sinacolon Co, Iran, were diluted and added to the reaction mixture along with DNA and deionized water. In each PCR reaction, combine 5μl of Mastermix X1, 1μl of the specific primer (at a concentration of 1 picomole), and 1μl of DNA template (ranging from 20 to 30 nanograms). To achieve a final reaction volume of 10μl, add 3μl of deionized water. The mixture was briefly mixed and placed in a 96-well block Thermocycler PCR machine, BIORAD T100, with specific temperature settings for each primer. PCR reaction for each primer used the optimum annealing temperature (Table 2). The appropriate thermal profile for amplifying the studied samples was determined based on several stages of testing different temperatures and programs. The PCR product was analyzed by agarose gel electrophoresis, and ethidium bromide staining was used to visualize the bands. The primer sequences are listed in Table 2. The PCR reaction was performed using specific thermal profiles for each primer set. For ISSR primers, the thermal profile included an initial denaturation step at 94°C for 240 seconds, followed by 36 cycles of denaturation at 94°C for 30 s, annealing at 48–54°C for 30 s, and extension at 72°C for 60 s. The final extension step was performed at 72°C for 420 s, followed by a final hold at 4°C. For RAPD primers, the thermal profile included an initial denaturation step at 94°C for 180 s, followed by 42 cycles of denaturation at 94°C for 30 s, annealing at 34–36°C for 30 s, and extension at 72°C for 60 s. The final extension step was performed at 72°C for 240 seconds, followed by a final hold at 4°C.
Name, sequence, and annealing temperature of ISSR and RAPD primers
Name, sequence, and annealing temperature of ISSR and RAPD primers
The molecular marker data was analyzed by recording binary data (presence or absence of bands) for each genotype based on the observed bands. This was done using Excel 2016 software. For each primer, the range of amplified bands, total number of bands, number of polymorphic bands, and percentage of polymorphic information content (PIC) were calculated with folowing formula: PIC = 1-Σpi2, where pi is the frequency of the i allele [18]. The resolving power (Rp) was also determined using the Prevost and Wilkinson [19] from informative bands (Ib) produced by each primer. A genetic dissimilarity matrix and dendrogram were constructed using the Jaccard index and the UPGMA algorithm in DARwin 5.1 software [20], respectively. Additionally, a two-dimensional scatter plot was drawn for each marker separately. The highest, lowest, and average dissimilarity, as well as the determination of distance and similarity between genotypes, were determined based on Jaccard dissimilarity coefficients for all genotypes and each primer separately.
Results and discussion
Fragment amplification and genetic diversity
The data presented in Table 3 indicate that out of the nine ISSR markers used, a total of 98 bands were produced, which were found to be polymorphic in one or more genotypes. The amplified fragments ranged in size from 150 to 1500 bp, with an average of 10.8 bands per marker. Marker UBC-890 exhibited the highest number of polymorphic bands [14], while markers UBC-884 and UBC-853 had the lowest number of polymorphic bands [8]. The average PIC across all markers was 0.16 with the lowest PIC value observed for marker UBC-826 (0.10) and the highest for marker UBC-890 (0.23). Based on the PIC classification proposed by Serrote, Reiniger [21], the ISSR markers used in this study were found to be moderately informative. This level of informativeness is similar to that observed in a previous study by Júnior, Souza [22], where ISSR markers were used to assess the genetic diversity of Schizolobium amazonicum in the State of Espírito Santo, Brazil (PIC = 0.37). Another study by Silva, Amorim [23] that used ISSR markers to characterize trees, fruits, and the genetic diversity of natural populations of Mangaba in Sergipe, Brazil, reported an average PIC value of 0.26. According to the Rp coefficient calculated in this study, the average genetic resolution power was 3.93, with the highest genetic resolution power observed for marker UBC-890 and the lowest for marker UBC-853 (Table 3). A total of 112 polymorphic bands also were obtained from the analysis of 34 barberry genotypes using 10 RAPD markers. The average number of bands per marker was 11.2, with the lowest number of bands observed in marker TIBMBE-08 (9 bands) and the highest in marker OPM-16 (13 bands). The average PIC value across all genotypes was 0.16, with the lowest value observed in marker TIBMBE-17 (0.13) and the highest in marker TIBMBE-08 (0.26). Panyanitikoon, Khanobdee [24] assessed the genetic variation in cucumber (Cucumis sativus L.) germplasm using RAPD markers with an average PIC value of 0.27. The size of the generated bands ranged from 150 to 1500 base pairs (Table 3). The RAPD analysis yielded an Rp coefficient with an average value of 4.84, suggesting a moderate level of genetic diversity among the analyzed genotypes. Notably, marker BD-13 exhibited the highest resolution power (6.11), indicating that it can effectively detect genetic variation among the samples. Conversely, marker BD-12 had the lowest resolution power (4.8), indicating that it may be less effective in detecting genetic variation among the Berberis genotypes. Shahri, Dehvari [25] examined the genetic diversity of 15 different grape cultivars using 7 ISSR markers and observed 58 bands, of which 52 were polymorphic and 6 were monomorphic. Pinar, Yahya [26] used twenty ISSR primers in 32 barberry genotypes from Turkey and Kyrgyzstan and revealed 150 bands of which 111 bands were polymorphic.
Characteristics of ISSR and RAPD primers used in the analysis of 34 barberry genotypes
Characteristics of ISSR and RAPD primers used in the analysis of 34 barberry genotypes
The genetic dissimilarity coefficient (GDC) based on ISSR markers ranged from 0.23 between genotypes 0205 and 0402 to 0.86 between genotypes R2N1 and 0202, with an average of 0.62 (Fig. 1). This indicates a medium genetic distance and diversity among the studied genotypes. The GDC calculated using RAPD markers ranged from 0.21 to 0.85, with an average of 0.60. The highest genetic similarity was observed between genotypes 0517 and 0518, while the lowest genetic similarity was observed between genotype 0609 and genotypes 0506 and 0511.

The frequency distribution of genetic distance coefficient between 34 different genotypes of barberry was calculated using the Jaccard coefficient, based on the results obtained from 9 ISSR primers (A) and 10 RAPD primers (B).
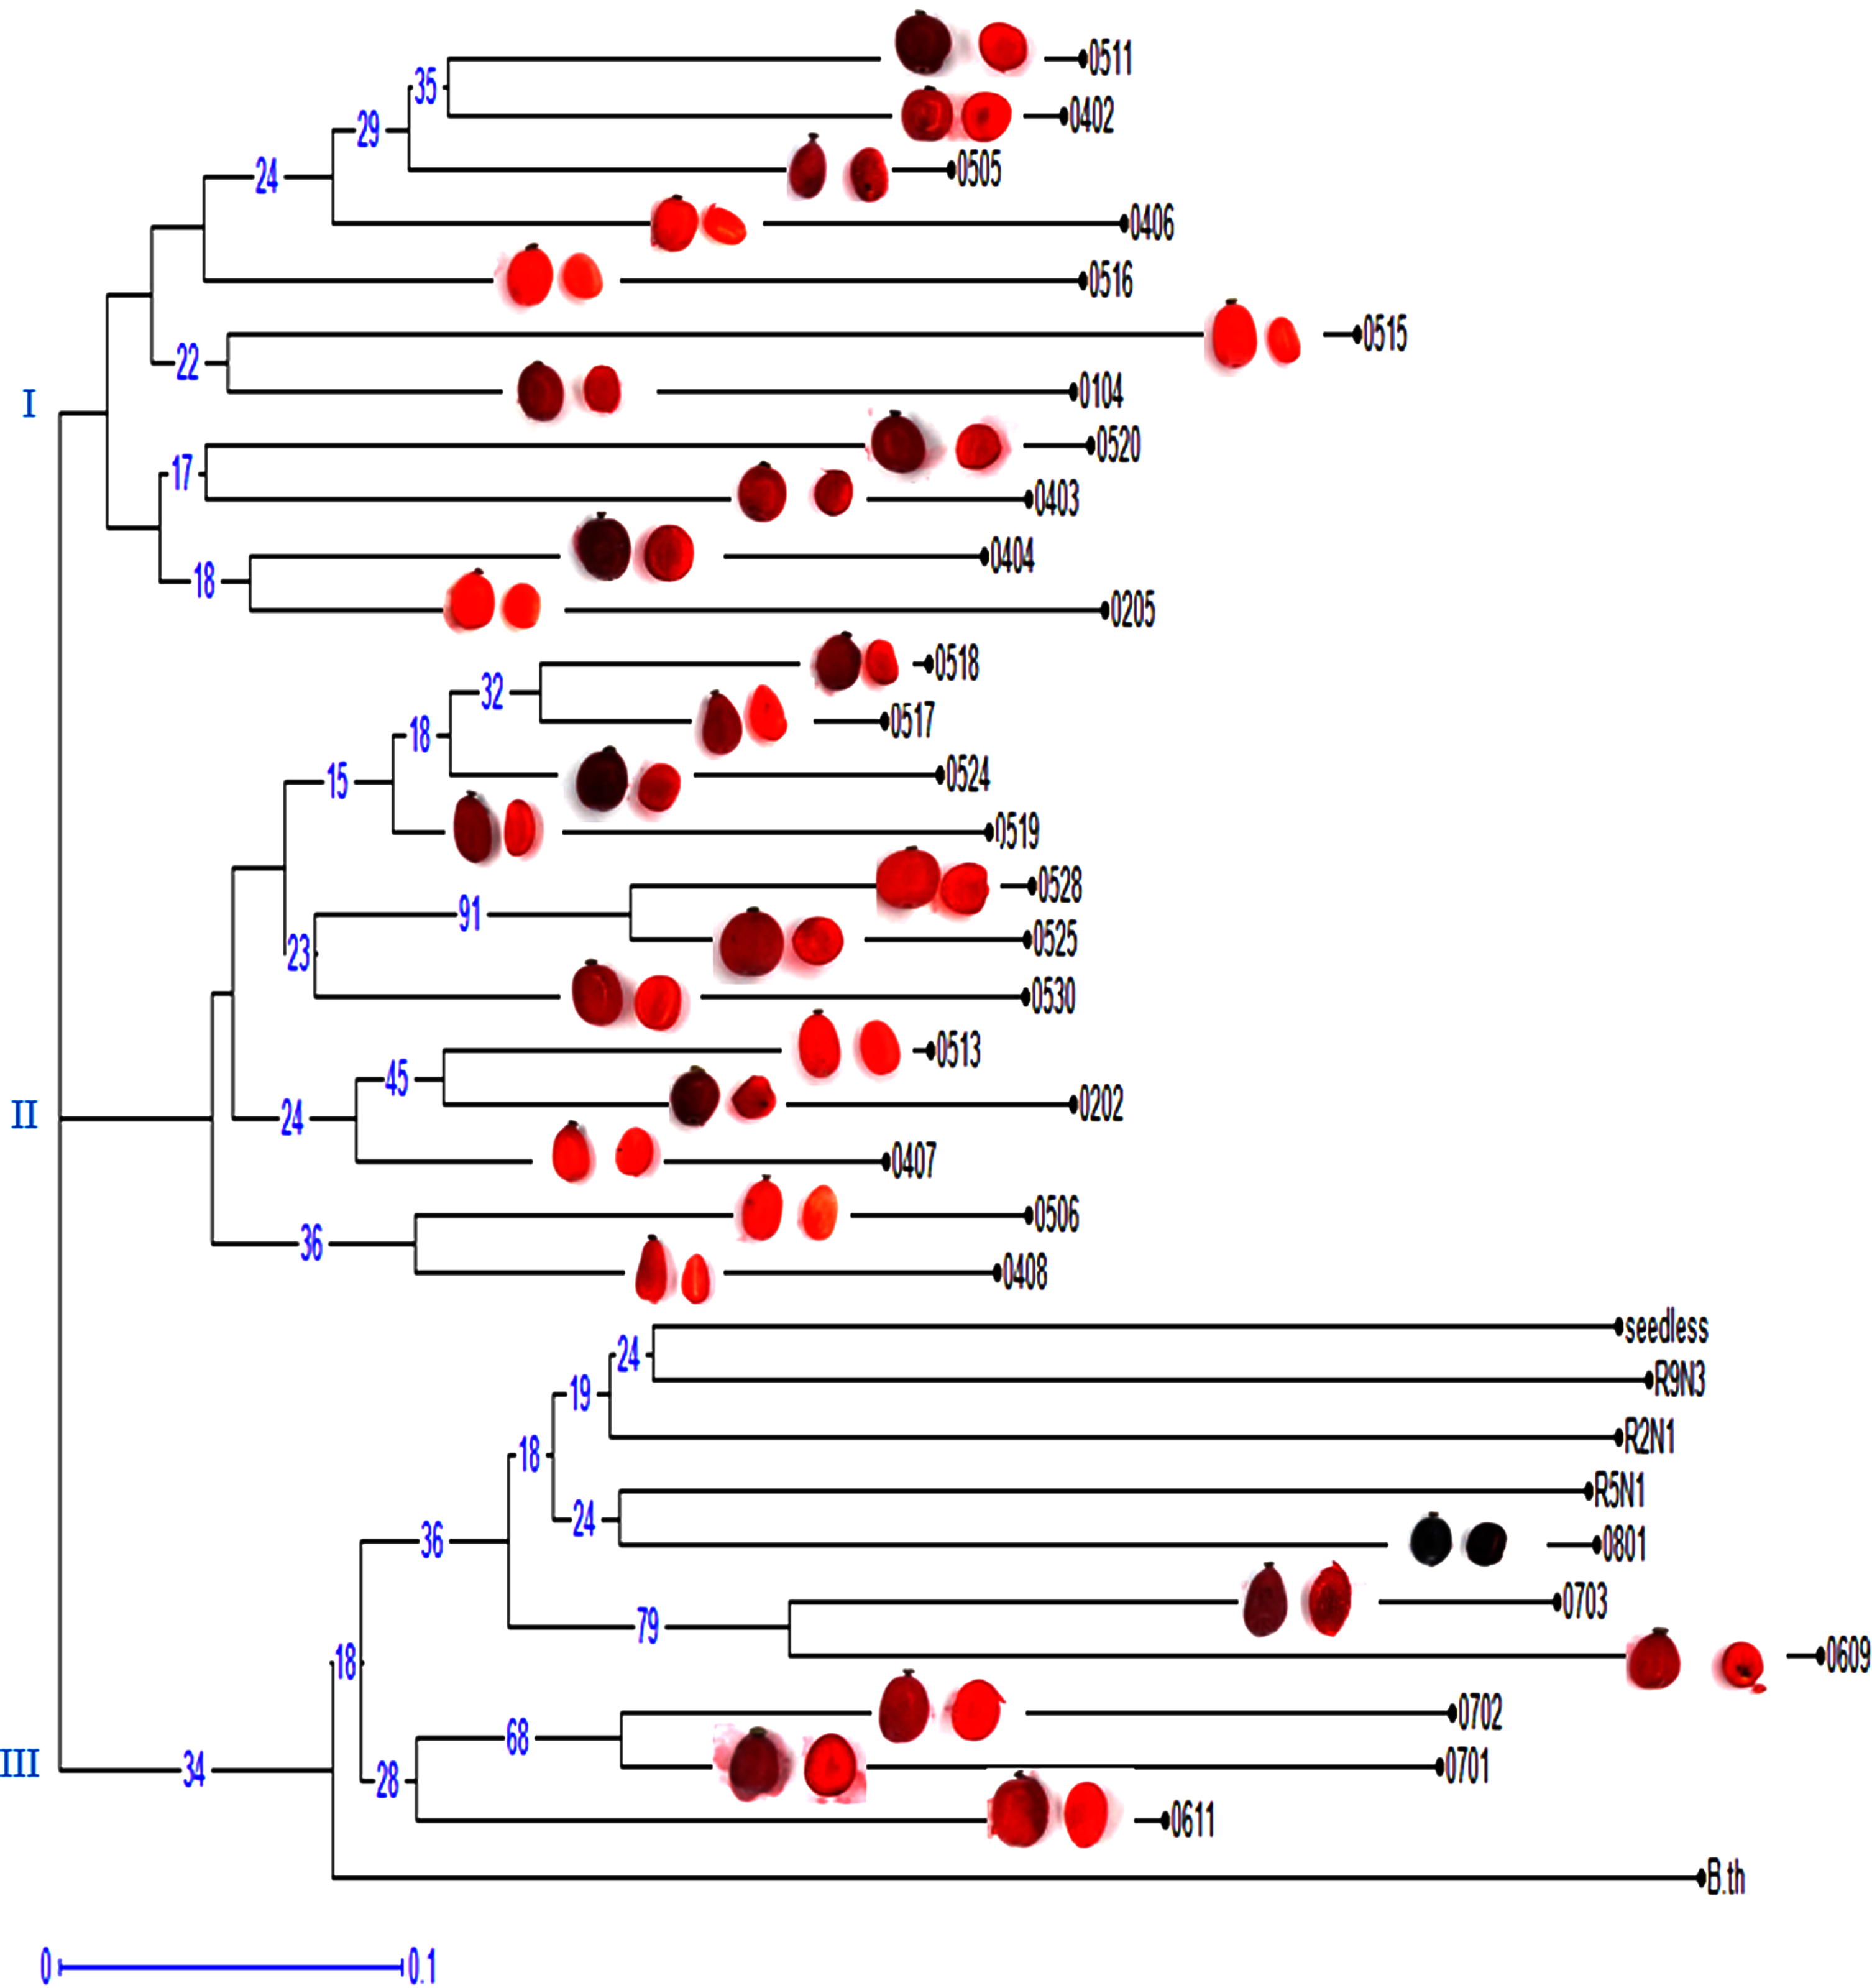
The ISSR data analysis resulted in the classification of genotypes into three main clusters (Fig. 2). Notably, genotypes 0515, R5N1, ‘Bth’, ‘Seedless’ (BD), and R2N1 were found to be genetically distant from the other genotypes (Fig. 2). The first cluster was further divided into three subgroups. Subgroup 1 included genotypes 0403, 0202, 0404, 0402, 0205, 0505, 0408, 0407, 0518, and 0406, while genotype 0104 was in subgroup 2 alone. Genotypes 0511, 0506, 0513, and 0516 which all belong to R4N1 ♀×BD ♂ were classified into subgroup 3, with lower genetic distances between them. The second cluster was the largest and was also subdivided into three subgroups. Subgroup 1 consisted of parental genotypes R5N1, R2N1, ‘Seedless’, and 0801, 0703, R9N3, 0702, 0701, 0609, and 0515. Genotypes 0611 and 0525 were classified into subgroup 2, while genotypes 0530, 0520, 0528, and 0519 were in subgroup 3. Finally, genotypes 0524 and 0517, which exhibited a high degree of similarity, were placed in the third cluster.

Dendrogram of cluster analysis for 34 barberry genotypes based on data obtained from 9 ISSR primers and with a picture of their berry. The genetic distance index is shown below the figures, P: Parent.
The analysis of 10 RAPD primers resulted in the classification of genotypes into three main groups (Fig. 3). Genotype 0609 exhibited greater genetic distance from other genotypes and was placed in the third group. The first group was divided into two subgroups, with subgroup 1 including genotypes 0511, 0402, 0505, 0406, 0516, 0104, and 0515, and subgroup 2 including genotypes 0520, 0403, 0404, and 0205, which showed high levels of similarity. The second group was also divided into two subgroups, with subgroup 1 including genotypes 0518, 0517, 0524, 0519, 0528, 0525, 0530, 0513, 0202, and 0407, where genotype 0202 exhibited greater genetic distance from other genotypes in this subgroup, and genotypes 0506 and 0408 were clustered together due to their high similarity. The third group was also divided into two subgroups, with genotypes R9N3, R2N1, R5N1, 0801, 0703, 0702, 0701, and 0611 in this group, where genotype 0609 exhibited greater genetic distance from other genotypes in this subgroup. The ornamental japonica barberry genotype was classified into a separate subgroup due to its dissimilarity, which included all parental genotypes (R5N1, R2N1, ‘Seedless’) along with the genotypes resulting from open pollination (08* and 07*).
Dendrogram of cluster analysisfor 34 barberry genotypes based on data obtained from 10 RAPD primers with apicture of their berry. The genetic distance index is shown below the figures.P: Parent.
PCoA is a vector space technique that is mostly used to reduce the dimensionality of a dataset. This analysis involves the decomposition of the eigenvalues of the covariance matrix. This technique is also used in the analysis of molecular data for genetic diversity analysis, but it can also be used to represent the three-dimensional distribution of genotypes. Based on the PCoA plot (Fig. 4) using ISSR marker data, the genotypes were classified into third groups. The first group consisted of genotypes 0404, 0403, 0406, 0104, 0202, 0205, 0505, and 0402. The second group included genotypes 0407, 0408, 0506, 0517, 0518, 0524, 0511, 0516, 0524, 0513, 0528, 0515, 0520, 0530, 0525, 0611, and 0609. The genotypes of R5N1, 0801, 0702, 0703, 0701, R9N3, R2N1, and ornamental barberries, which clustered with the third group. This group also included parents and genotypes resulting from open pollination (08* and 07*).
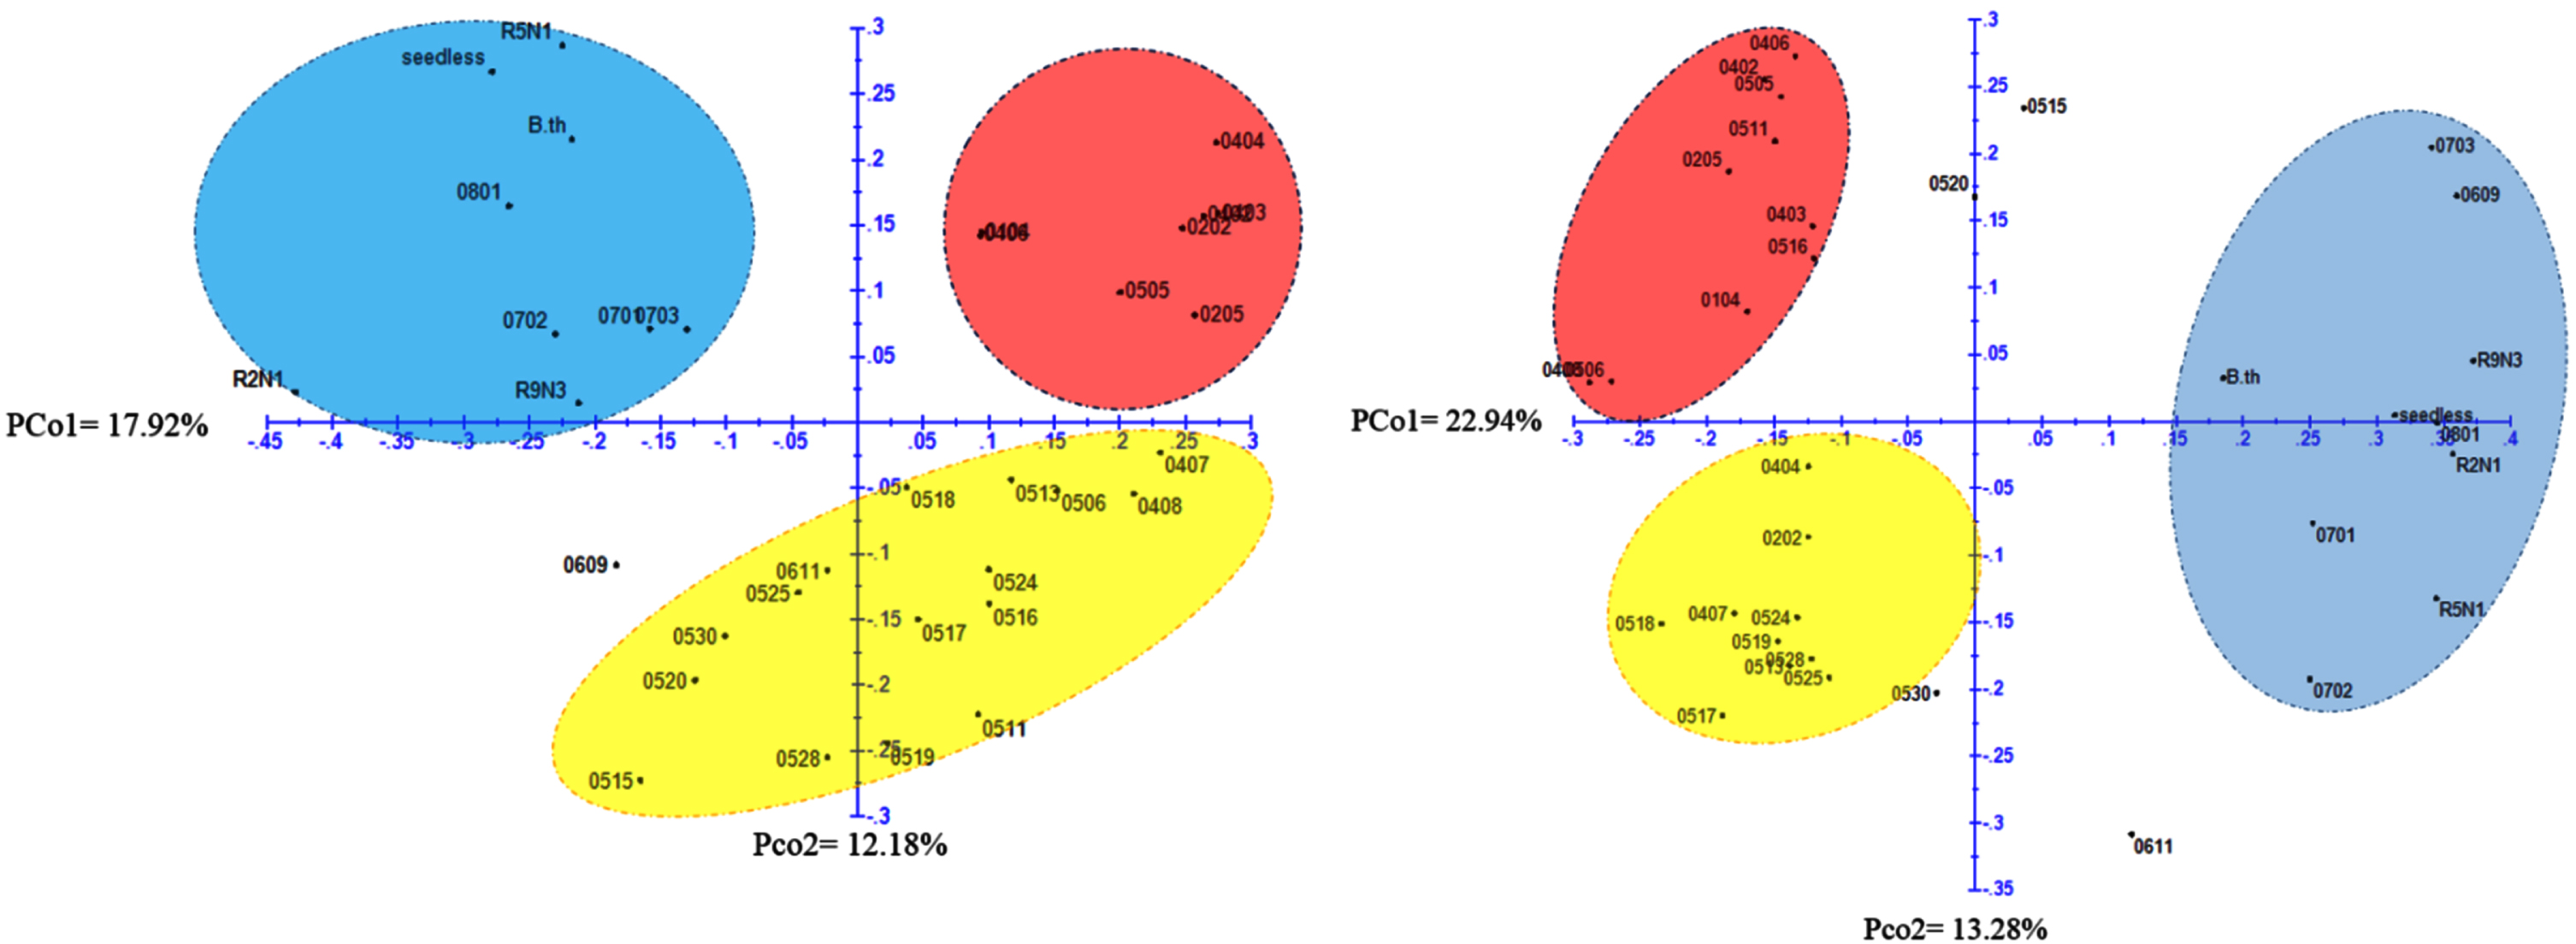
Principal Coordinates Analysis (PCoA) of 34 genotypes and interspecific barberry hybrids using data from 9 ISSR primers (Right image) and 10 RAPD primers (Left image).
Based on the plot obtained from PCoA using RAPD marker data, the genotypes were classified into three groups (Fig. 3). The first group consisted of genotypes 0701, 0702, 0703, 0609, 0801, R2N1, R5N1, R9N3, ‘B.th’, and ‘seedless’. The second group included genotypes 0406, 0402, 0505, 0511, 0205, 0403, 0516, 0104, 0506, and 0403. The third group consisted of genotypes 0404, 0202, 0524, 0407, 0518, 0519, 0528, 0513, 0525, 0530, and 0517. The results obtained from the plot were mostly consistent with the cluster analysis grouping and confirmed the results obtained from the grouping analysis. The results of the PCoA analysis provide further evidence of the genetic diversity of barberry genotypes. The three groups of genotypes identified in the PCoA analysis suggest that barberry has a wide range of genetic variation. This genetic variation can be used to develop new barberry cultivars with improved traits.
The utilization of molecular markers in this study provides valuable scientific insights for similar research endeavors. The data obtained from ISSR and RAPD markers allow for the assessment of genetic diversity and genetic base, enabling breeders to make informed decisions in the selection of genotypes with specific genetic traits. These markers can be employed to identify genetically distant genotypes (e.g., 0609, 0515, 0611 and 0501), which may serve as potential parents in crossbreeding programs to introduce novel genetic variations into the breeding pool. Hybridization between genetically diverse parents can lead to the development of novel genotypes with a wider range of desirable traits. Moreover, the genetic distance between genotypes, calculated using the GDC and PCoA, can be used for future selections. Superior genotypes identified through the genetic diversity analysis can be propagated through clonal techniques such as cuttings or tissue culture to maintain their desirable genetic traits.
The results of this study showed that the selected superior genotypes of barberry have a high level of genetic diversity, which is important for breeding programs. The high level of genetic diversity in these genotypes provides a pool of genetic variation that can be used to improve the quality and productivity of barberry crops. The cluster analysis showed that the genotypes 0609, 0515, 0611 and 0501 were genetically distant from the other genotypes. This suggests that these genotypes may have unique genetic traits that could be useful for breeding new barberry cultivars. The two selections, 0202 and 0205, inherited the seedless trait from their parent ‘Zereshk Bidaneh’ (BD) but did not cluster with it. Further research is required to pinpoint the genetic base of desirable traits in these Berberis hybrids, which can then be used to assess their potential for future selection. Overall, the results of this study provide valuable insights into the genetic diversity of new barberry genotypes. This information can be used to guide future breeding programs for barberry and to develop new cultivars with improved traits.
Conflicts of interest
The authors have no conflict of interest to report.
Funding
No funding was received for conducting this study.