
Abstract
Synthetic aperture radar (SAR) is a powerful technology for measuring the change of earth surface and man-made structure. In order to monitor the safety status of transmission line and electric wire under the condition of natural disasters, this paper has studied a simulation method of high resolution synthetic aperture radar image for the South-to-North transmission line, for the identification of transmission line. The spatial distribution characteristics of transmission lines are analyzed, and spatial model of transmission lines is selected and constructed. It is able to extract the characteristics of transmission line in SAR image. The SAR radiation model of transmission line is built based on backscattering technology of spaceborne SAR image and the characteristics of transmission line’s spatial position. Finally, the proposed simulation model is verified by the electromagnetic simulation experiment. Experimental results have shown that the proposed method can truly reflect the bright line phenomenon in SAR image of the South-to-North transmission line, and it can be analyzed quantitatively, which will provide a new theoretical method for analyzing working status of transmission lines in future.
Introduction
Regular inspection shall be carried out on transmission lines to grasp the operation status of transmission lines and environmental conditions along the lines, and timely detect the existence of any defects or safety hazards. In particular, special inspection shall be carried out in special cases, such as climate change, natural disasters, external damage and abnormal operation, etc., so as to timely identify and handle any abnormal conditions of transmission lines. Transmission lines in China often stretch for hundreds or even thousands of kilometers, and are mostly located in sparsely populated areas. High mountains and complex terrain along the lines lead to great difficulty and high cost for transmission line monitoring and inspection. Such inspection and monitoring techniques as manual inspection, robot inspection [1, 2], helicopter inspection [3] and online monitoring devices [4, 5, 6] can hardly realize fast, wide range, low cost and high safety coefficient inspection under the conditions of extreme weather and large area natural disasters.
The rapid development of satellite platforms makes it possible to apply the spaceborne synthetic aperture radar (SAR) remote sensing technology to electrical power system. The all day, all weather and wide range detection capability of satellite remote sensing technology based on SAR can realize wide-area monitoring on transmission lines under the condition of large area disasters, and overcome a variety of difficulties in transmission line inspection under complex meteorological and topographical conditions.
However, radar imaging is very special. Due to different radiation characteristics of different surface objects, it is quite difficult to quantitatively analyze the radiation characteristics of electrical towers and wires, which results in great difficulties in interpreting radar images [7]. Therefore, it’s of great importance to extract useful information from the spaceborne SAR images to inspect transmission lines and analyze the abnormal segments of transmission lines.
Currently, related studies mainly focus on the position detection and state recognition of electric towers in radar images. Liao et al. distinguished the target point of the transmission tower from the airborne SAR images of the Huaihe flood inundated area in 2003 [8]. Yang et al. proposed a point target recognition model for transmission towers, which could extract the transmission line vector and line direction in high resolution polarimetric SAR images [9]. Novak et al. used the polarimetric whitening filter to SAR image and identified the transmission tower target [10]. Ping et al. detected the power transmission tower from SAR image based on the fusion method of CFAR and EF feature [11]. These studies used SAR images to monitor transmission towers which were considered as point target and the analysis and extraction of transmission wires were not considered. The studies of Yan, Yi et al. took into account the fine structure of the transmission towers, and proposed structure extraction methods to identify the destroy of towers [12, 13, 14]. The working status of electric tower is analyzed according to the changes of electric tower information in radar images at different moments, which can meet current demand for inspection and monitoring of transmission lines. However, the complex topography, obscuration and background interference make it impossible to comprehensively and effectively monitor transmission line in some regions. Moreover, these studies cannot recognize damages of transmission lines such as loosening and disconnection.
A great deal of SAR satellite remote sensing data showed the common existence of bright lines in SAR image of the South-to-North transmission line. This paper has conducted theoretical analysis based on relevant data, proposed an electromagnetic simulation method for spaceborne SAR image of transmission lines, simulated the high resolution SAR characteristics of transmission lines based on spatial position model of transmission lines and radar backscattering model. It analyzed the imaging properties of transmission lines in SAR image, and provided a theoretical model and simulation algorithm for analyzing operation status and damage of transmission lines.
Spatial position model of transmission lines
There are three calculation models for overhead transmission lines (overhead lines are mainly composed of phase conductors, overhead ground wires, towers, insulators and hardware fittings, etc.), including accurate catenary calculation model, simplified oblique parabola calculation model and simplified flat parabola calculation model [5]. These three models are ideal models that only take gravity and tension into account and apply to homogenous materials without other influences.
Accurate catenary calculation model
Due to the large span of wires hanging on the tower, the rigidity of the wire has little impact on geometrical shape of overhead wires, and thus can be negligible. Therefore, the transmission line can be assumed as a flexible chain, which only bears tension without resisting bending. The tension direction at any point is consistent with the tangential direction at this point of overhead line. Load on the wire is evenly distributed along the wire, noting that it only considers a static mode without any wind load or electromagnetic force during a fault condition.
Hanging arc of transmission lines.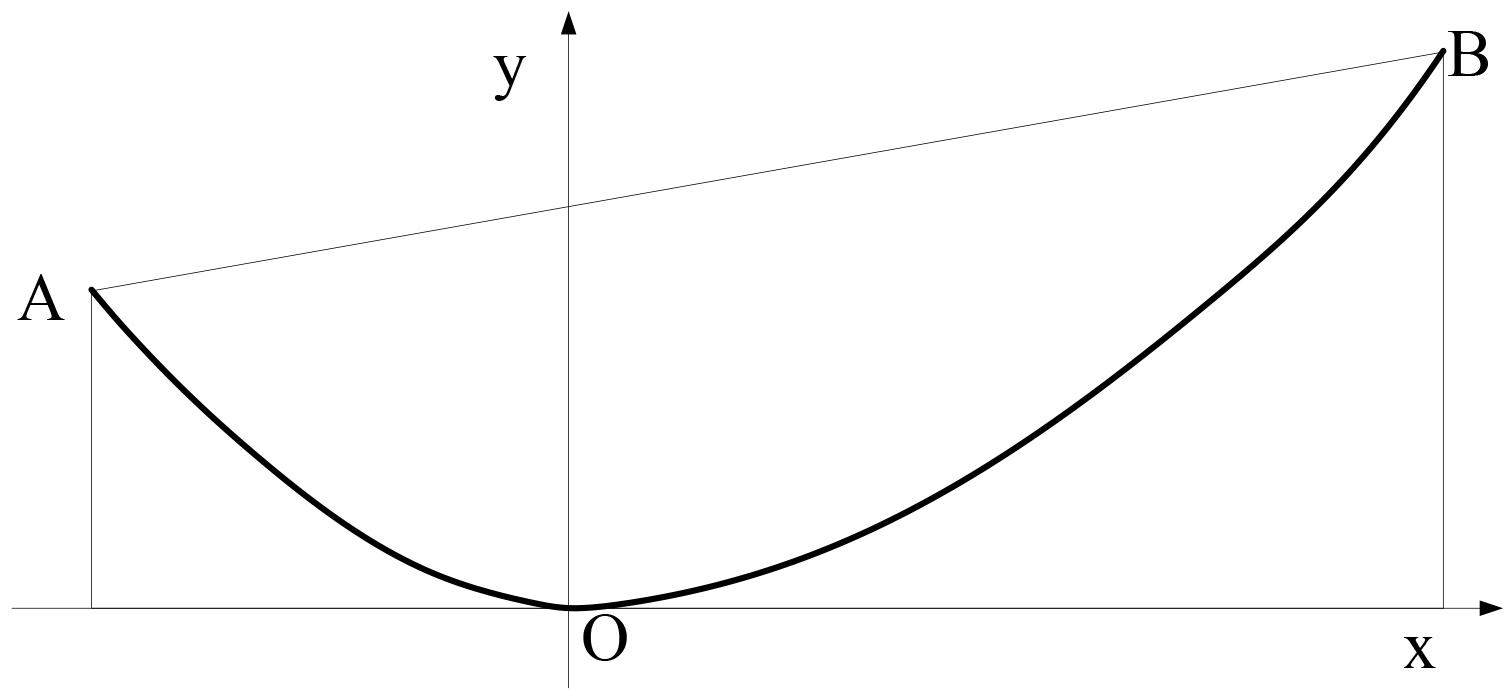
As shown in Fig. 1, and are two suspension points of overhead wires. O is the lowest point of the wire. Accurate catenary calculation equation is as follows [5]:
Where,
Calculation equation can be simplified by oblique parabola. The method of calculating the sag, length and tension of overhead wire by oblique parabolic equation is called oblique parabola method. As shown in Fig. 1, a coordinate system is established, and the simplified oblique parabolic calculation equation is as follows [5]:
Where,
Under the premise of within the allowable range of engineering error, the load uniformly distributed along the overhead wire can be simplified as the load uniformly distributed along the line span. As shown in Fig. 1, the derived analytical equation becomes flat parabolic equation. The method of calculating the sag, length and tension of overhead wire by flat parabolic equation is called flat parabola method.
Load analysis when the suspension points are located in the equal height.
Suppose the load is uniformly distributed along the wire, the load acted on the wire section OP is located in the point G. As shown in Fig. 2, the derived flat parabolic equation is as follows [5]:
Synthetic aperture radar technology evolves from real aperture radar technology. With respect to radar image resolution, range resolution is determined by the pulse width of radar beam, while azimuth resolution is determined by beam width. Real aperture radar has higher range resolution, but lower azimuth resolution due to limitations of beam width. For the real aperture radar, the size of aperture directly affects the beam width. In order to improve the azimuth resolution, the real aperture antenna is synthesized into a larger equivalent aperture antenna via signal processing based on the principle of the Doppler effect [15] .
SAR imaging is quite different from optical imaging. SAR Imaging is equivalent slant range and side looking imaging, and its resolution is reflected by slant range. SAR Imaging can only distinguish echo signals from targets at different distances. The formula for calculating slant range of ground target point is as follows [16, 17]:
Where,
Scattering model of ground target point is:
Where,
As transmission wire is a good conductor, it has large dielectric constant and high backscattering coefficient. During modeling calculation, it is necessary to first precisely calculate the orbital position of satellite and spatial position of transmission line respectively.
State vector calculation of satellite orbit
SAR satellite remote sensing data provides both specific image data information and relevant operating parameters of satellites and SAR platform, including the discrete state vectors (satellite state vectors at 5 time points) of satellite orbits. We can conduct orbit fitting based on such information [18, 19].
The state vectors of discrete sampling points on satellite orbit can be obtained from the header files of satellite radar data. State vectors are indicated by satellite position vector
Where,
The cubic polynomial fitting orbital equations are as follows:
Where,
In order to reach the required precision and minimize the amount of calculation, oblique parabola model is hereby selected to calculate the spatial position of overhead wire hanging on towers.
In the 2D model, the oblique parabolic equation is shown in Eq. (2). In the 3D model, the space rectangular coordinate system is established using flight direction of the satellite as
The positional coordinates of the wire can satisfy the following relationship:
In particular case (Overhead wire is parallel to the
Where,
When the overhead wire is not parallel to the
Algorithm flow chart.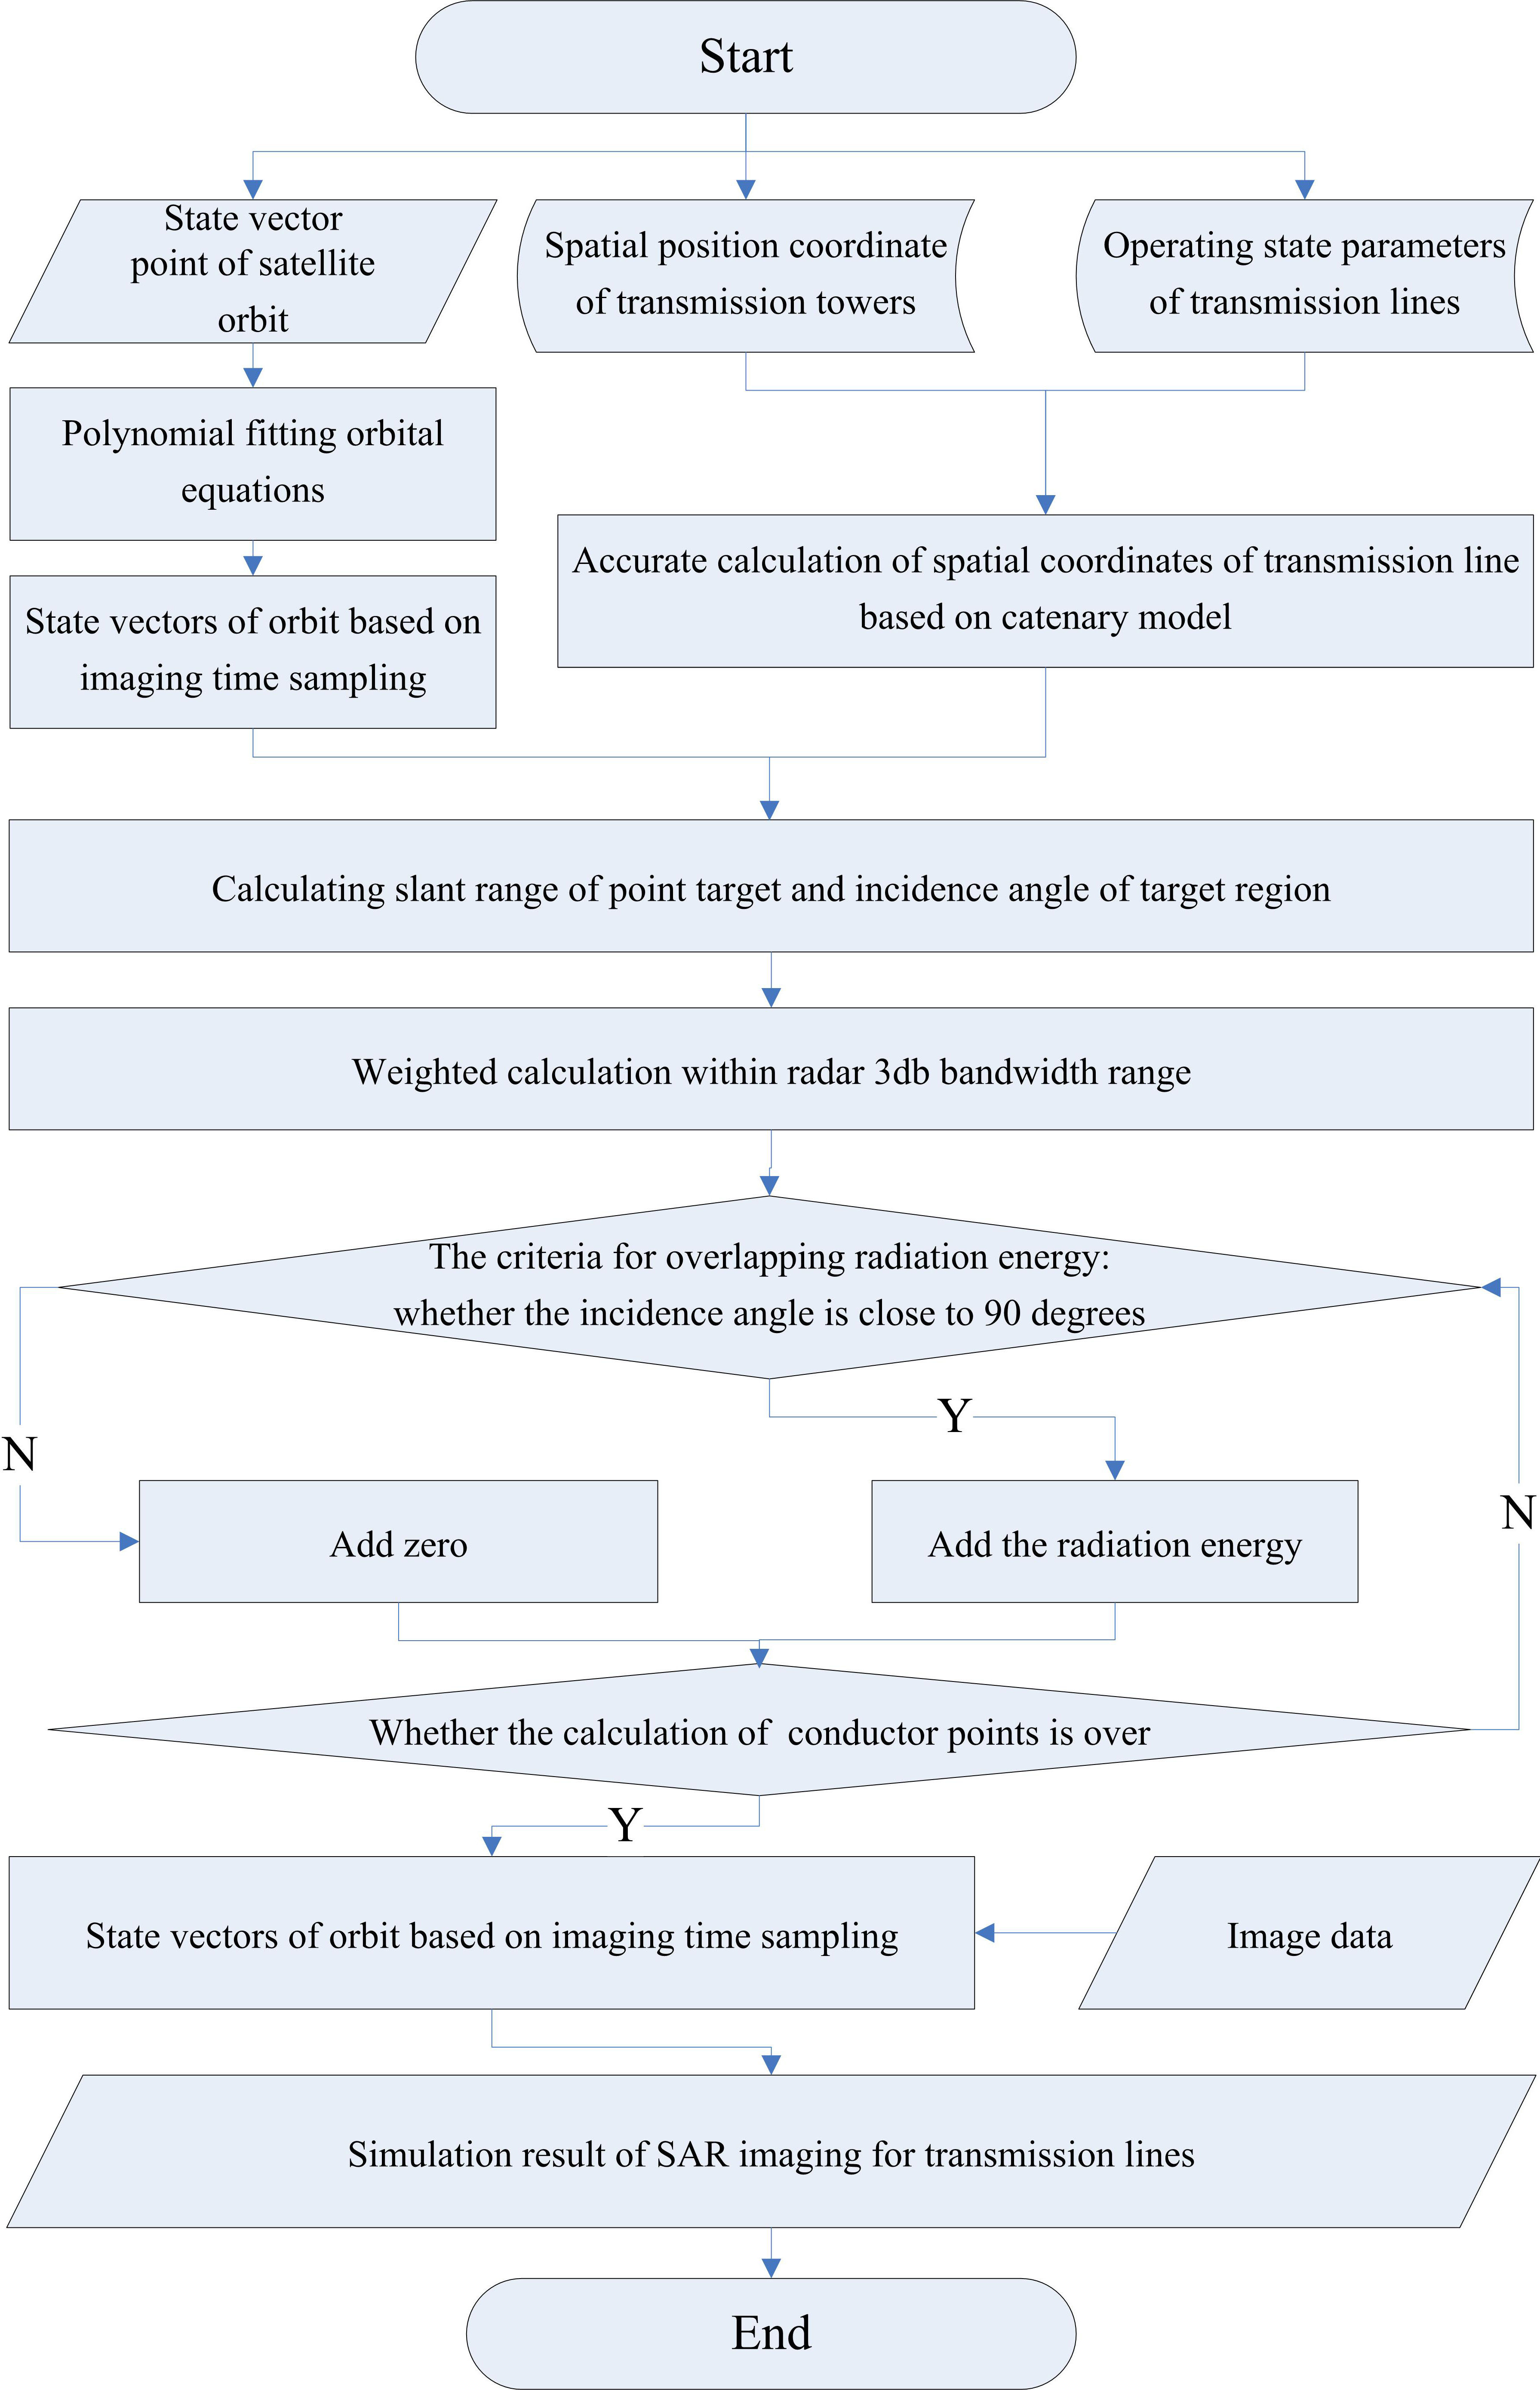
When the overhead wire is parallel to the -axis:
Each pixel in SAR image is the collection of azimuth backscattering energy within the range of real aperture beamwidth.
At the moment “
3D modeling equation is used to calculate partial derivative of each point on the overhead wire, so as to obtain the direction vector of overhead wire:
Incidence vector of radar electromagnetic wave
Spatial position of overhead wire.
The incidence angle of radar illuminating overhead wire is
The radiation value of point target on overhead wire is calculated within the range of radar beam width. Due to the smooth surface of overhead wire and poor backscattering ability, only point targets with
The slant range of overhead wire is within the range of
Where,
In order to validate the feasibility of monitoring the operating status of south-to-north transmission lines by high resolution SAR image, this paper analyzes the strip map mode of German satellite TerraSAR-X [20, 21] . Relevant parameters of TerraSAR-X include flight altitude of 514 km or so, radiation wavelength of 3.2 cm, beamwidth azimuth of 0.33
Figure 4 shows the spatial position of overhead wires in the simulation area. The red dashed line indicates the trajectory of SAR satellite; the black columns on the grayscale are electrical towers; the black solid line is the transmission line. The SAR simulation experiment results of this space region are shown in Fig. 5. Figure 5(a) is SAR image of the simulation area, which was taken in May 6, 2008 and the transmission line had not been constructed at that time. Figure 5(b) is Transmission line and towers marking in imaging region. Figure 5(c) is the final simulation diagram of bright line effects of transmission line. Figure 5(d) is the real SAR image, which was taken in September 26, 2010 after the construction of the transmission line. As shown in these figures, it can be clearly seen that transmission line has produced bright line effects in SAR images, which is generally consistent with the real SAR images.
Simulation experiment figures: (a) Imaging region, (b) Transmission line and towers marking in imaging region, (c) Simulated bright line effects of transmission line, (d) Real SAR image.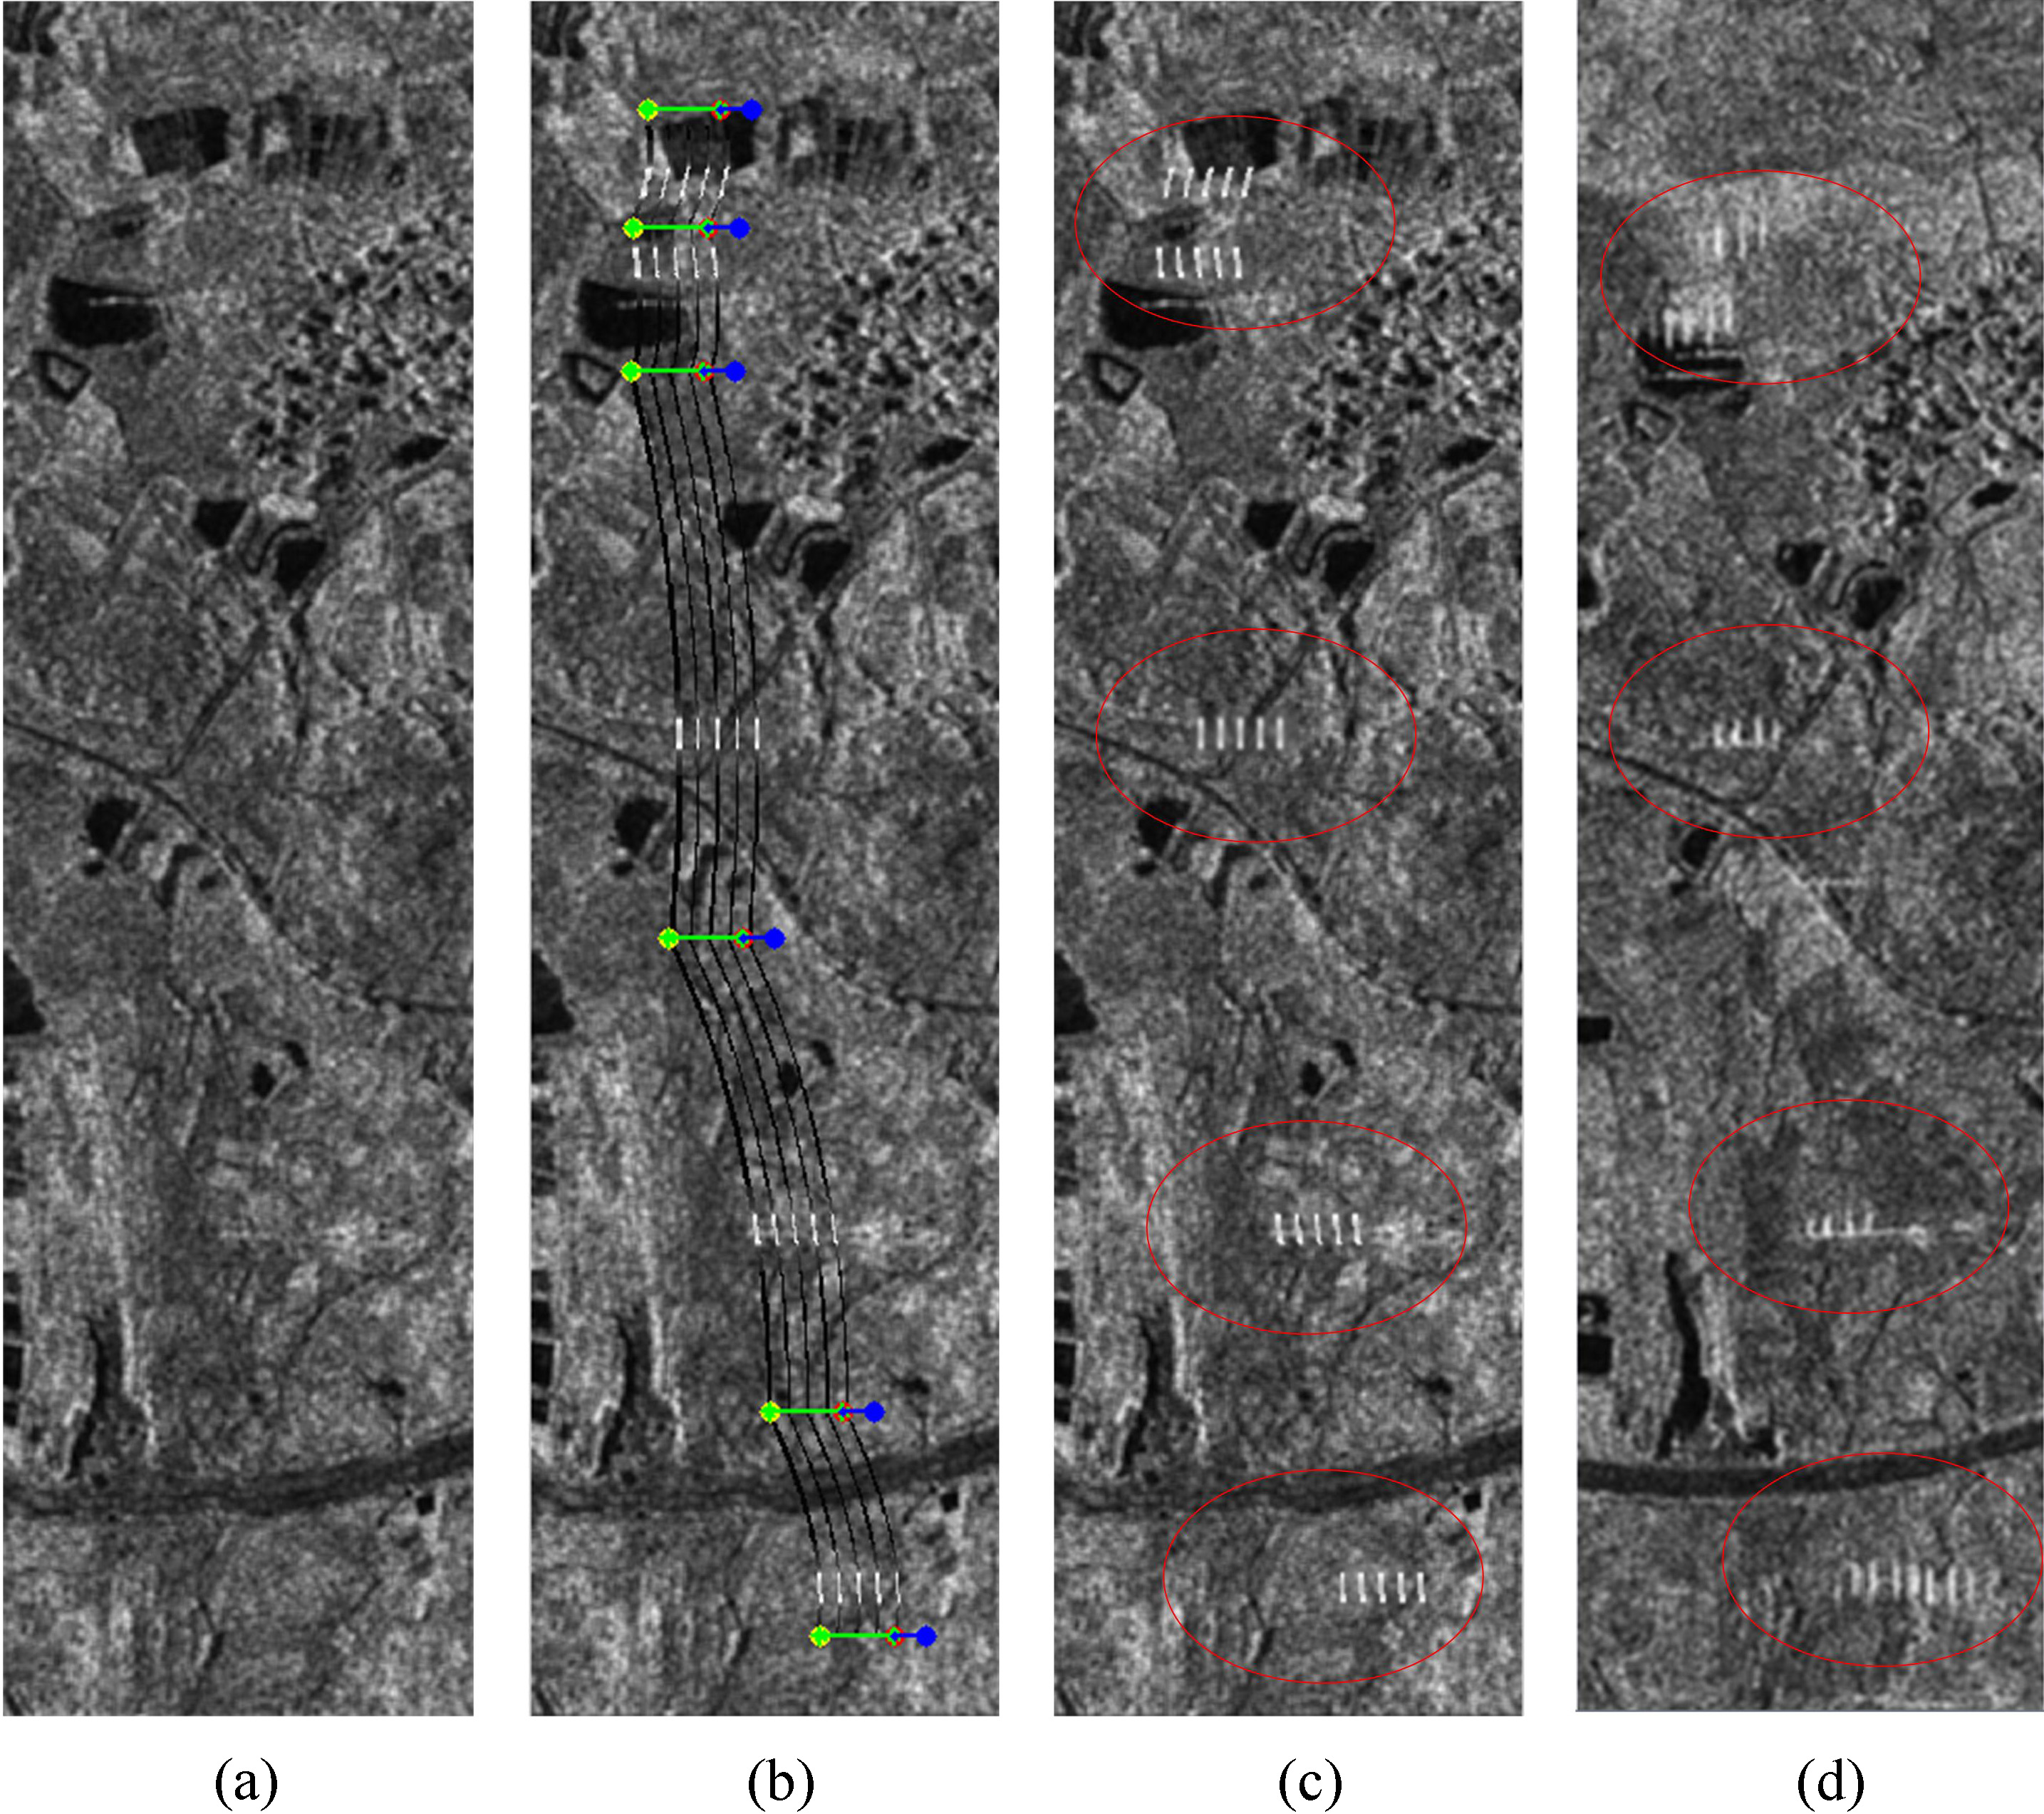
In order to verify the proposed method, we calculated the mean absolute error and standard deviation of the central position of the bright lines in simulated SAR image and real SAR image. Assume the upper left corner of the image is the origin of coordinates, the coordinate of a point in the image is (row, col), while row represents the index pixel in row and col represents the index pixel of in column. First, the bright lines areas between every two towers are segmented from the image. Then, the coordinates of the central point of the bright lines areas in simulated SAR image and real SAR image are calculated. Five coordinates are calculated in every image. Since the simulated SAR image and the real SAR image are registered, the mean absolute error is calculated as
The standard deviation is calculated as
Where,
The values of
The values of (pixels)
The calculated result of
It is of great significance to utilize SAR satellite remote sensing imaging to monitor large area transmission lines. To study the bright line phenomenon of South-to-North transmission line in SAR images, this paper has proposed a high precision electromagnetic simulation model for SAR imaging of transmission lines, calculated the satellite orbital position and corresponding overhead wire position at any moment through polynomial fitting of satellite orbit and 3D modeling of transmission line, calculated the radiation energy of point targets on transmission lines through SAR imaging and scattering model, and finally determined the radiation energy of central point on overhead wire through overlapping the radiation energy of point targets. Finally, the validity of the proposed model is verified by simulation experiments. This paper has provided a new way of thinking and model for analyzing and evaluating the operation status of transmission lines. However, if the transmission line is cut and fallen to the ground or covered by the tree branches, it cannot be detected by the method now. Further research is needed in the future.
Footnotes
Acknowledgments
The authors would like to thank the State Grid Corporation of China for financial support (GY71-17-043).