
Abstract
In this study the Finite Volume method is employed to simulate the blood flow in an intracranial aneurysm. For that purpose, the Navier-Stokes equations are solved in the computational domain of real aneurysms in a specific patient. This computational domain is obtained from MR images with a software designed in our laboratory. This computer program transforms the MR images (in DICOM format) to the volumetric mesh where the Navier-Stokes equations are going to be solved. The Ansys CFX
Introduction
Cerebral aneurysms are pathologic dilations of the vein’s wall that frequently occur near arterial bifurcations in the circle of Willis. The most serious consequence is their rupture and intracranial hemorrhage into the subarachnoid zone, with a high mortality rate. Greater availability and improvement of neuroradiologic techniques have resulted in more frequent detection of cerebral aneurysms before rupture. Because the prognosis for subarachnoid hemorrhages is still poor, aneurysmal obliteration is a necessary therapeutic option. Planned aneurysm surgery could benefit from a better understanding of the process of aneurysm formation, progression, and rupture. Hassan et al. [16] proposed a hemodynamic analysis of an adult vein of Galen aneurysms. In this study, the authors applied computational fluid dynamic (CFD) analysis on the numerical grid of a 3D rotational digital subtraction angiogram obtained in a 22-year-old male patient, with an accidentally discovered vein of Galen malformation associated with a single feeder aneurysm, to understand the flow pattern through the two aneurysms and improve a general understanding of hemodynamic characteristics of this variety of fusiform aneurysm. That work provides an example of the application of CFD to 3D digital subtraction angiography for studying the flow pattern in patients with cerebrovascular disease. Shojima et al. [13] studied the magnitude and role of wall shear stress (WSS) on cerebral aneurysm. WSS is one of the main pathogenic factors in the development of saccular cerebral aneurysms. The magnitude and distribution of the WSS in and around human middle cerebral artery (MCA) aneurysms were analyzed using CFD. In this work mathematical models of MCA vessels with aneurysms were created by 3-dimensional computed tomographic angiography. CFD calculations were performed by using an original finite-element solver with the assumption of Newtonian fluid property for blood and the rigid wall property for the vessel and the aneurysm. These results suggest that in contrast to the pathogenic effect of a high WSS in the initiating phase, a low WSS may facilitate the growing phase and may trigger the rupture of a cerebral aneurysm by causing degenerative changes in the aneurysm wall. The WSS of the aneurysm region may be of some help for the prediction of rupture. Cebral et al. [7] conducted a study of hemodynamic factors that play an important role in the initiation, growth, and rupture of cerebral aneurysms. This work describes a clinical study of the association between intra-aneurysmal hemodynamic characteristics of CFD models and the rupture of cerebral aneurysms. A simple flow characterization system was proposed, and interesting trends in the association between hemodynamic features and aneurysmal rupture were found. Simple stable patterns, large impingement regions, and jet sizes were more commonly seen with unruptured aneurysms. By contrast, ruptured aneurysms were more likely to have disturbed flow patterns, small impingement regions, and narrow jets. Jou et al. [8] proposed a correlation between lumenal geometry changes and hemodynamics in fusiform intracranial aneurysms. The authors examined the relationship between hemodynamics and growth of 2 fusiform basilar artery aneurysms in an effort to define hemodynamic variables that may be helpful in predicting aneurysmal growth. Two patients with basilar fusiform aneurysms of a similar size were followed for a 2-year period. The lumenal geometry and inflow and outflow rates were acquired by using MR angiography and velocimetry, respectively. The location of aneurysmal growth was identified by coregistering aneurysm models that were acquired at different times. Hemodynamic descriptors were calculated by using CFD simulations and compared with aneurysm growth pattern. Chen et al. [3] applied a CFD analysis on one patient-specific model of cerebral aneurysm and connected vessels constructed from 3D rotational angiography in order to understand the properties of blood flow around aneurysms and wall shear stress. From the patient model analyzed in this investigation, the authors find that the comparatively maximum WSS occurs near the root of the aneurysm, which leads to damage in the aneurysmal wall, and the maximum displacement is at the peak of the aneurysm. Linninger et al. [1] proposed a mathematical model of blood, cerebrospinal fluid and brain dynamics. By using first principles of fluid and solid mechanics a comprehensive model of human intracranial dynamics is proposed. Blood, cerebrospinal fluid (CSF) and brain parenchyma as well as the spinal canal are included. The compartmental model predicts intracranial pressure gradients, blood and CSF flows and displacements in normal and pathological conditions like communicating hydrocephalus. The system of differential equations is discretized and solved numerically. Fluid-solid interactions of the brain parenchyma with cerebral blood and CSF are calculated. The model provides the transitions from normal dynamics to the diseased state during the onset of communicating hydrocephalus. In this study predicted results were compared with physiological data from Cine phase-contrast magnetic resonance imaging to verify the dynamic model. Bolus injections into the CSF are simulated in the model and found to agree with clinical measurements. Chen et al. [4] conducted a CFD analysis that is applied to one patient-specific model of the cerebral aneurysm located at the tip of the basilar artery, by which the differences of hemodynamic parameters before and after endovascular treatment are evaluated. Based on the model, the authors show that the flow behavior near the neck of the aneurysm sees great differences after endovascular treatment as compared with that before treatment, which also affects the WSS and the displacement distribution. In addition, the simulation process is based on a series of CFD codes. These results would be used to assess the outcome of endovascular treatment for the aneurysm occlusion. Sforza et al. [6] studied the effects of parent artery motion on the hemodynamics of basilar tip saccular aneurysms and its potential effect on aneurysm rupture. The aneurysm and parent artery motions in two patients were determined from cine loops of dynamic angiographies. The oscillatory motion amplitude was quantified by registering the frames. Patient-specific CFD models of both aneurysms were constructed from 3D rotational angiography images. Two CFD calculations were performed for each patient, corresponding to static and moving models. The motion estimated from the dynamic images was used to move the surface grid points in the moving model. Visualizations from the simulations were compared for WSS, velocity profiles, and streamlines. In both patients, a rigid oscillation of the aneurysm and basilar artery in the antero-posterior direction was observed and measured. The distribution of WSS was nearly identical between the models of each patient, as well as major intra-aneurysmal flow structures, inflow jets, and regions of impingement. The motion observed in pulsating intracranial vasculature does not have a major impact on intraaneurysmal hemodynamic variables. Parent artery motion is unlikely to be a risk factor for increased risk of aneurysmal rupture. Baharoglu et al. [11] conducted a study about aneurysm inflow angle (IA) as a discriminant for rupture in sidewall cerebral aneurysms. CFD analysis showed increasing IA leading to deeper migration of the flow recirculation zone into the aneurysm with higher peak flow velocities and a greater transmission of kinetic energy into the distal portion of the dome. Increasing IA resulted in higher inflow velocity and greater WSS magnitude and spatial gradients in both the inflow zone and dome. Goubergrits et al. [9] proposed a study of statistical WSS maps of ruptured and unruptured middle cerebral artery aneurysms. The goal of this study was to generate and analyze statistical WSS distributions and shapes in MCA saccular aneurysms. Unsteady flow was simulated in seven ruptured and 15 unruptured MCA aneurysms. In order to compare these results, all geometries must be brought in a uniform coordinate system. For this, aneurysms with corresponding WSS data were transformed into a uniform spherical shape; then, all geometries were uniformly aligned in three-dimensional space. Subsequently, the authors compared statistical WSS maps and surfaces of ruptured and unruptured aneurysms. No significant (
Magnetic resonance (MR) image of a patient with an intracranial aneurysm (in red color).
Isolated structure of cerebral veins for the patient with the aneurysm disease.
For pulsatile flow conditions is observed a recirculating vortex that is located at the zone of the aneurysm. In this study two important effects in this zone were observed as the bulk flow decelerated. First, the strength of the recirculation was strengthened. Second, the flow recirculation reduced its magnitude in this zone but was enlarged in the transverse direction. These aneurysms are usually asymptomatic until they expand or rupture. An expanding of the aneurysm causes sudden, severe, and constant low back, flank, or groin pain. Syncope may be the chief complaint, however, with pain less prominent. Patients with a ruptured aneurysm may present in frank shock, as evidenced by cyanosis, mottling, altered mental status, tachycardia, and hypotension. Whereas abrupt onset of pain due to rupture of an aneurysm may be quite dramatic, associated physical findings may be very subtle. At least 65% of patients with a ruptured aneurysm die of sudden cardiovascular collapse before arriving at a hospital.
However, in this paper is proposed a methodology for the study of specific real geometries of the Human vein and the possible risk for each patient based on some physical parameters that arise in our CFD calculations. The aim of this paper is: (i) to demonstrate the feasibility of using patient-specific 3D MR image data from clinical studies to construct corresponding realistic patient-specific CFD models of cerebral aneurysms, (ii) to characterize these intra-aneurysmal flow patterns, and (iii) to explore their possible rupture analyzing the WSS and pressure fields.
A 3D volumetric mesh of the aneurysm model as the input data for the Ansys CFX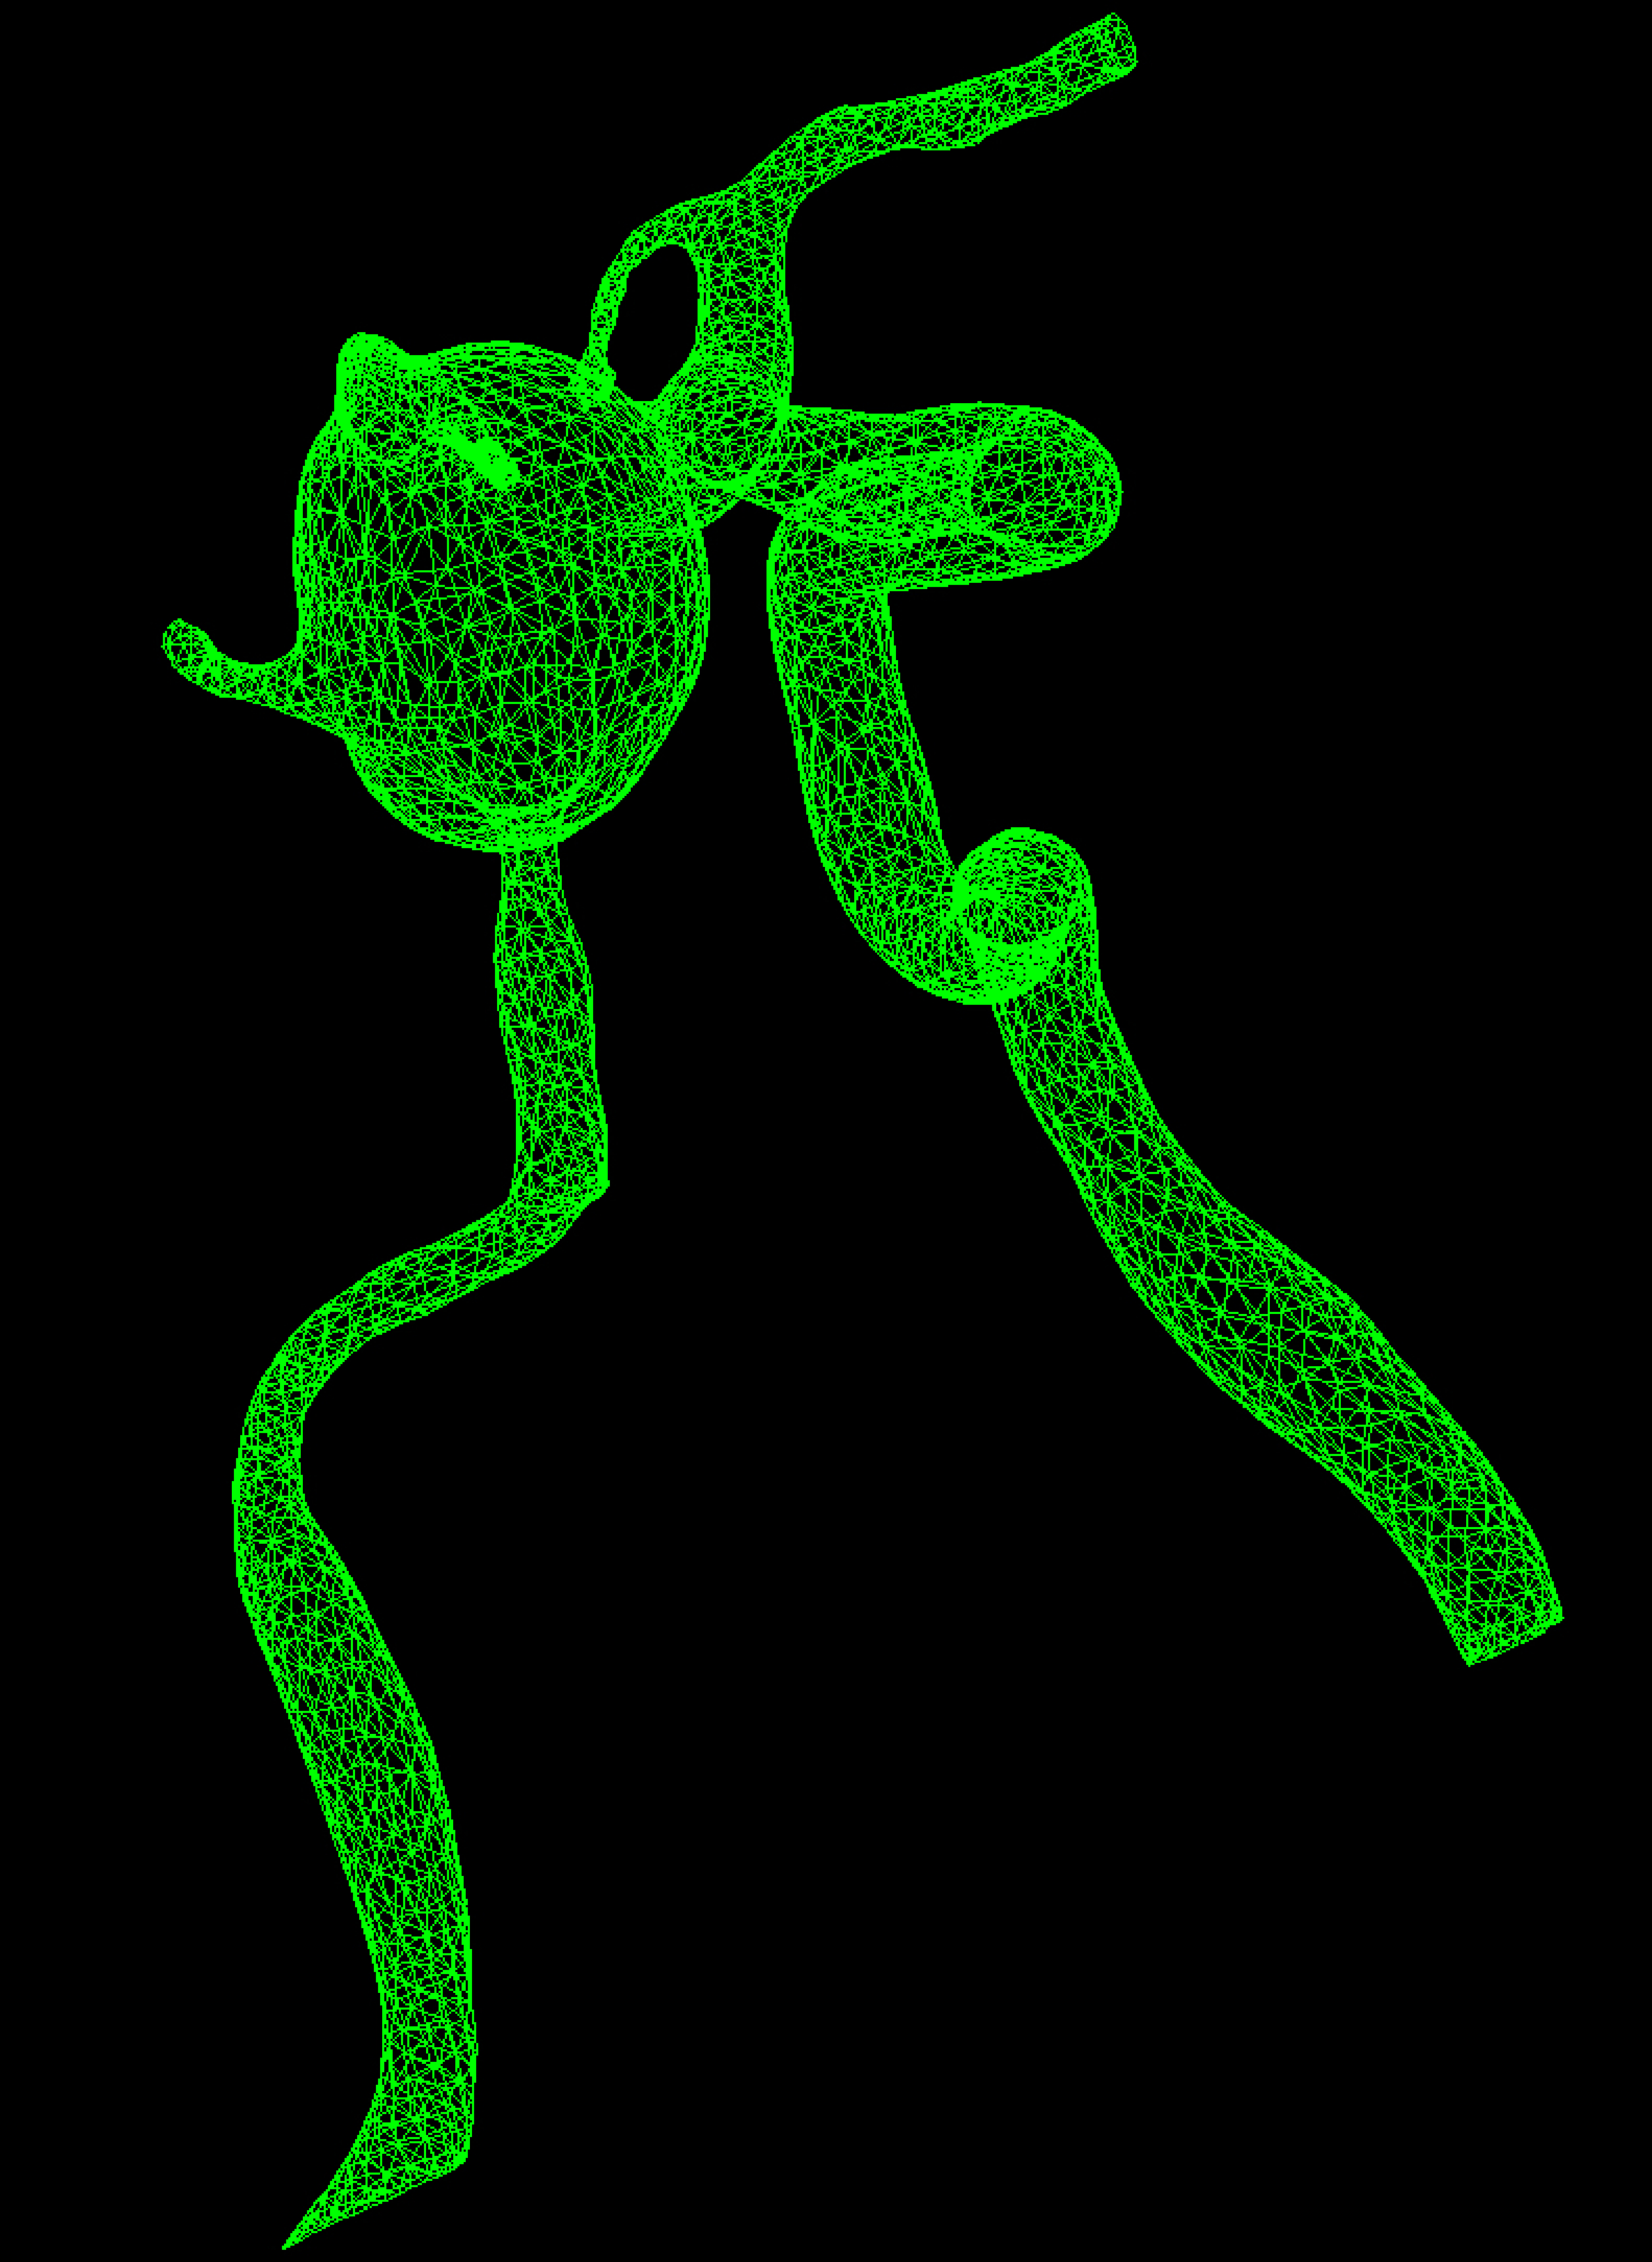
The governing equations can be given by the continuity Eq. (1) and the Navier-Stokes Eq. (2):
where
CFX
The software designed in our laboratory produce an isolated image of the cerebral veins (see Fig. 2) that is transformed in a 3D volumetric mesh (see Fig. 3). This software was specially developed for medical image processing. After this stage, a 3D solid volume is generated from the volumetric mesh with Ansys CFX
CT medical imaging diagnostic tools is most commonly used in the scientific field that provide a wealth of information at an affordable cost. CT was introduced in the early 70 s, and allows radiographic reconstruction of anatomical structures, whether bony structures, and in some cases soft structures or other organs. The anatomical segmentation is the process of selecting the edge in the medical imaging area which is desired to convert into a 3D solid. For this study, MR images, taken to a patient who had an intracranial aneurysm were worked in DICOM format, which is the standard format for medical image management. Using a software designed in our laboratory that allows 3D reconstruction from medical imaging, we proceed to the selection of the edges, in this case was selected the area of interest of the aneurysm and also we make a reduction in the model. Once the segmentation has been performed, the 3D volumetric mesh is generated and this file is then imported to the Ansys CFX
Modeling the blood flow through the aneurysm deformation
The blood flow is modeled as an incompressible Newtonian fluid. The governing equations are the incompressible Navier-Stokes and continuity Eqs (1) and (2). Due to a lack of information regarding the distribution of vessel wall elasticity and thickness, the vein walls were assumed to be rigid. Non-Newtonian effects were neglected.
Steady state calculations
In the calculations reported here, simple stable patterns, large impingement region, and large jet sizes can be seen in the aneurysm zone. In Fig. 4 it can be seen that in the zone of aneurysm deformation there is a circular patron of the velocity field, with a value of 1.50 m/s. On the other hand, at the vein zones the flow field is uniform and the streamlines are approximately parallel between them. In fact the velocity field reaches a value of around 0.75 m/s in the second adjacent branches to the aneurysm zone. At the intersection and bifurcation regions, there is a secondary circular flux with a value that is less than the value of the velocity field at the no deformed veins.
Steady state approach: streamlines for intra-aneurysmal flow patterns and adjacent veins.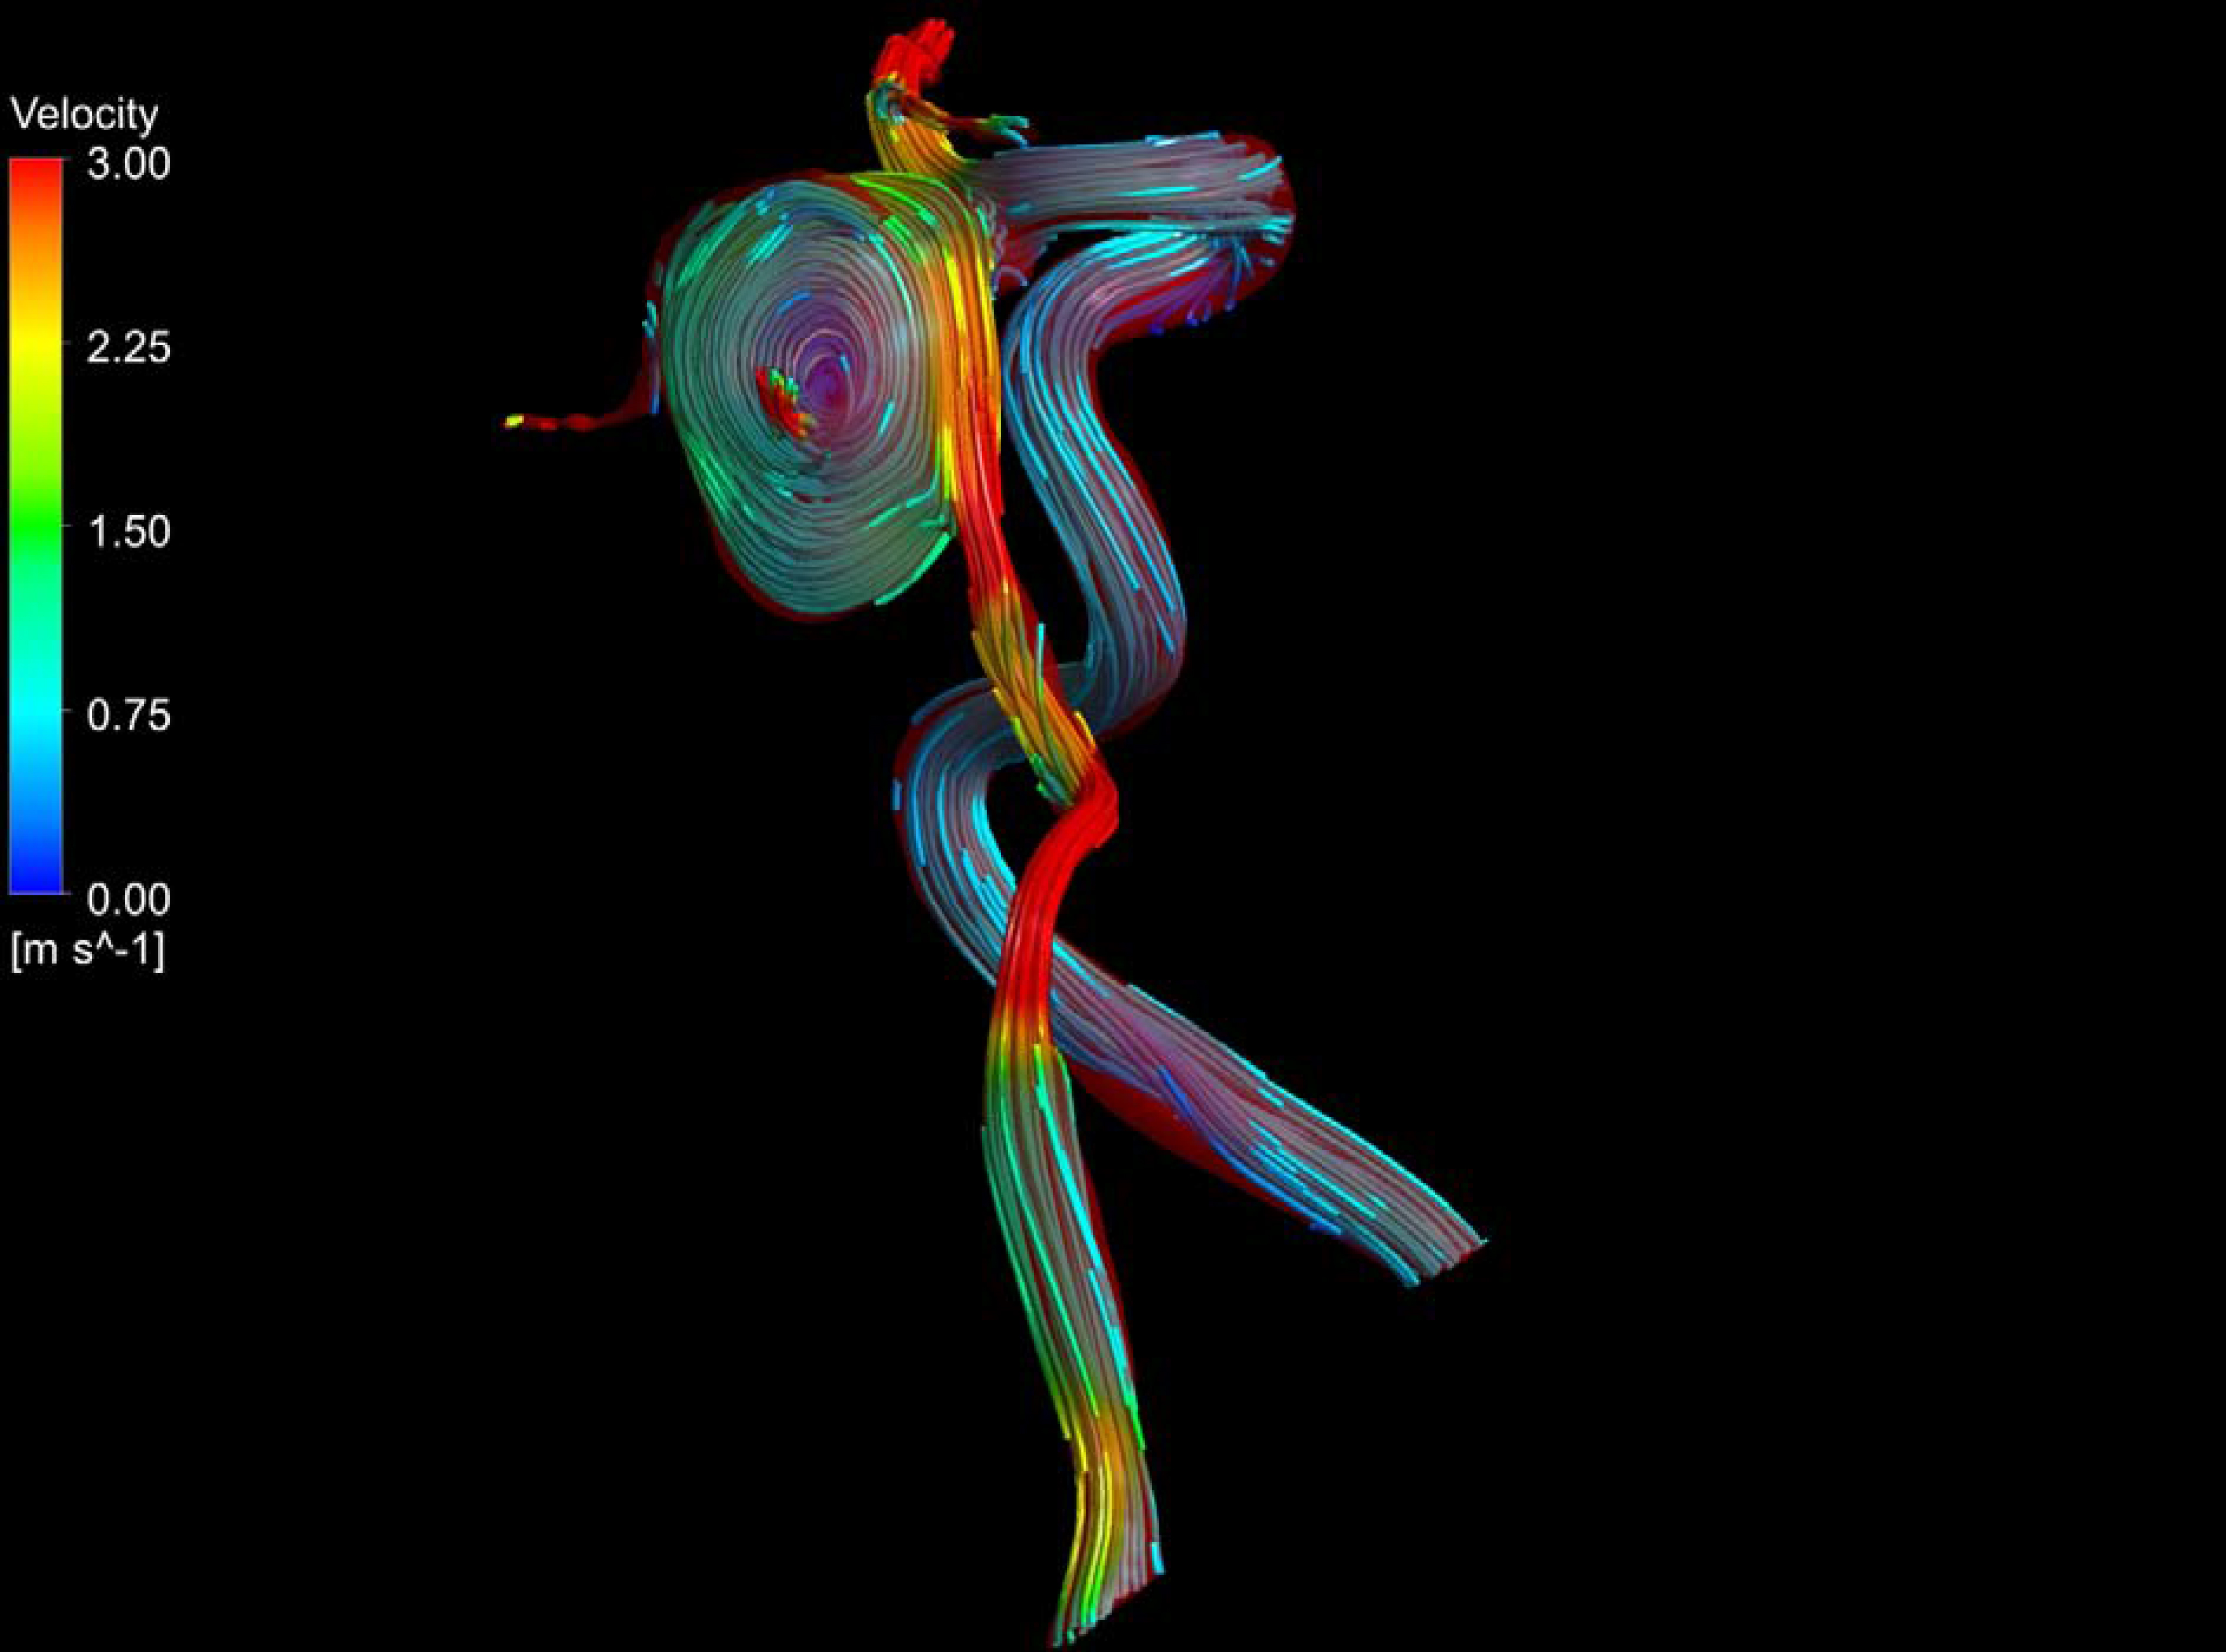
The pressure distribution (see Fig. 5) shows that at the aneurysm zone and the veins that are connected with this part of the system, the pressure field reaches its maximum value. This outcome agrees with the WSS distribution presented here. This result has a very important impact because the patient has the potential risk of the aneurysm rupture. It can be seen that at the intersection and bifurcation places the pressure field has the lowest values, in this place there is a secondary circular flow of blood.
Steady state approach: pressure distribution at the aneurysm zone and adjacent veins.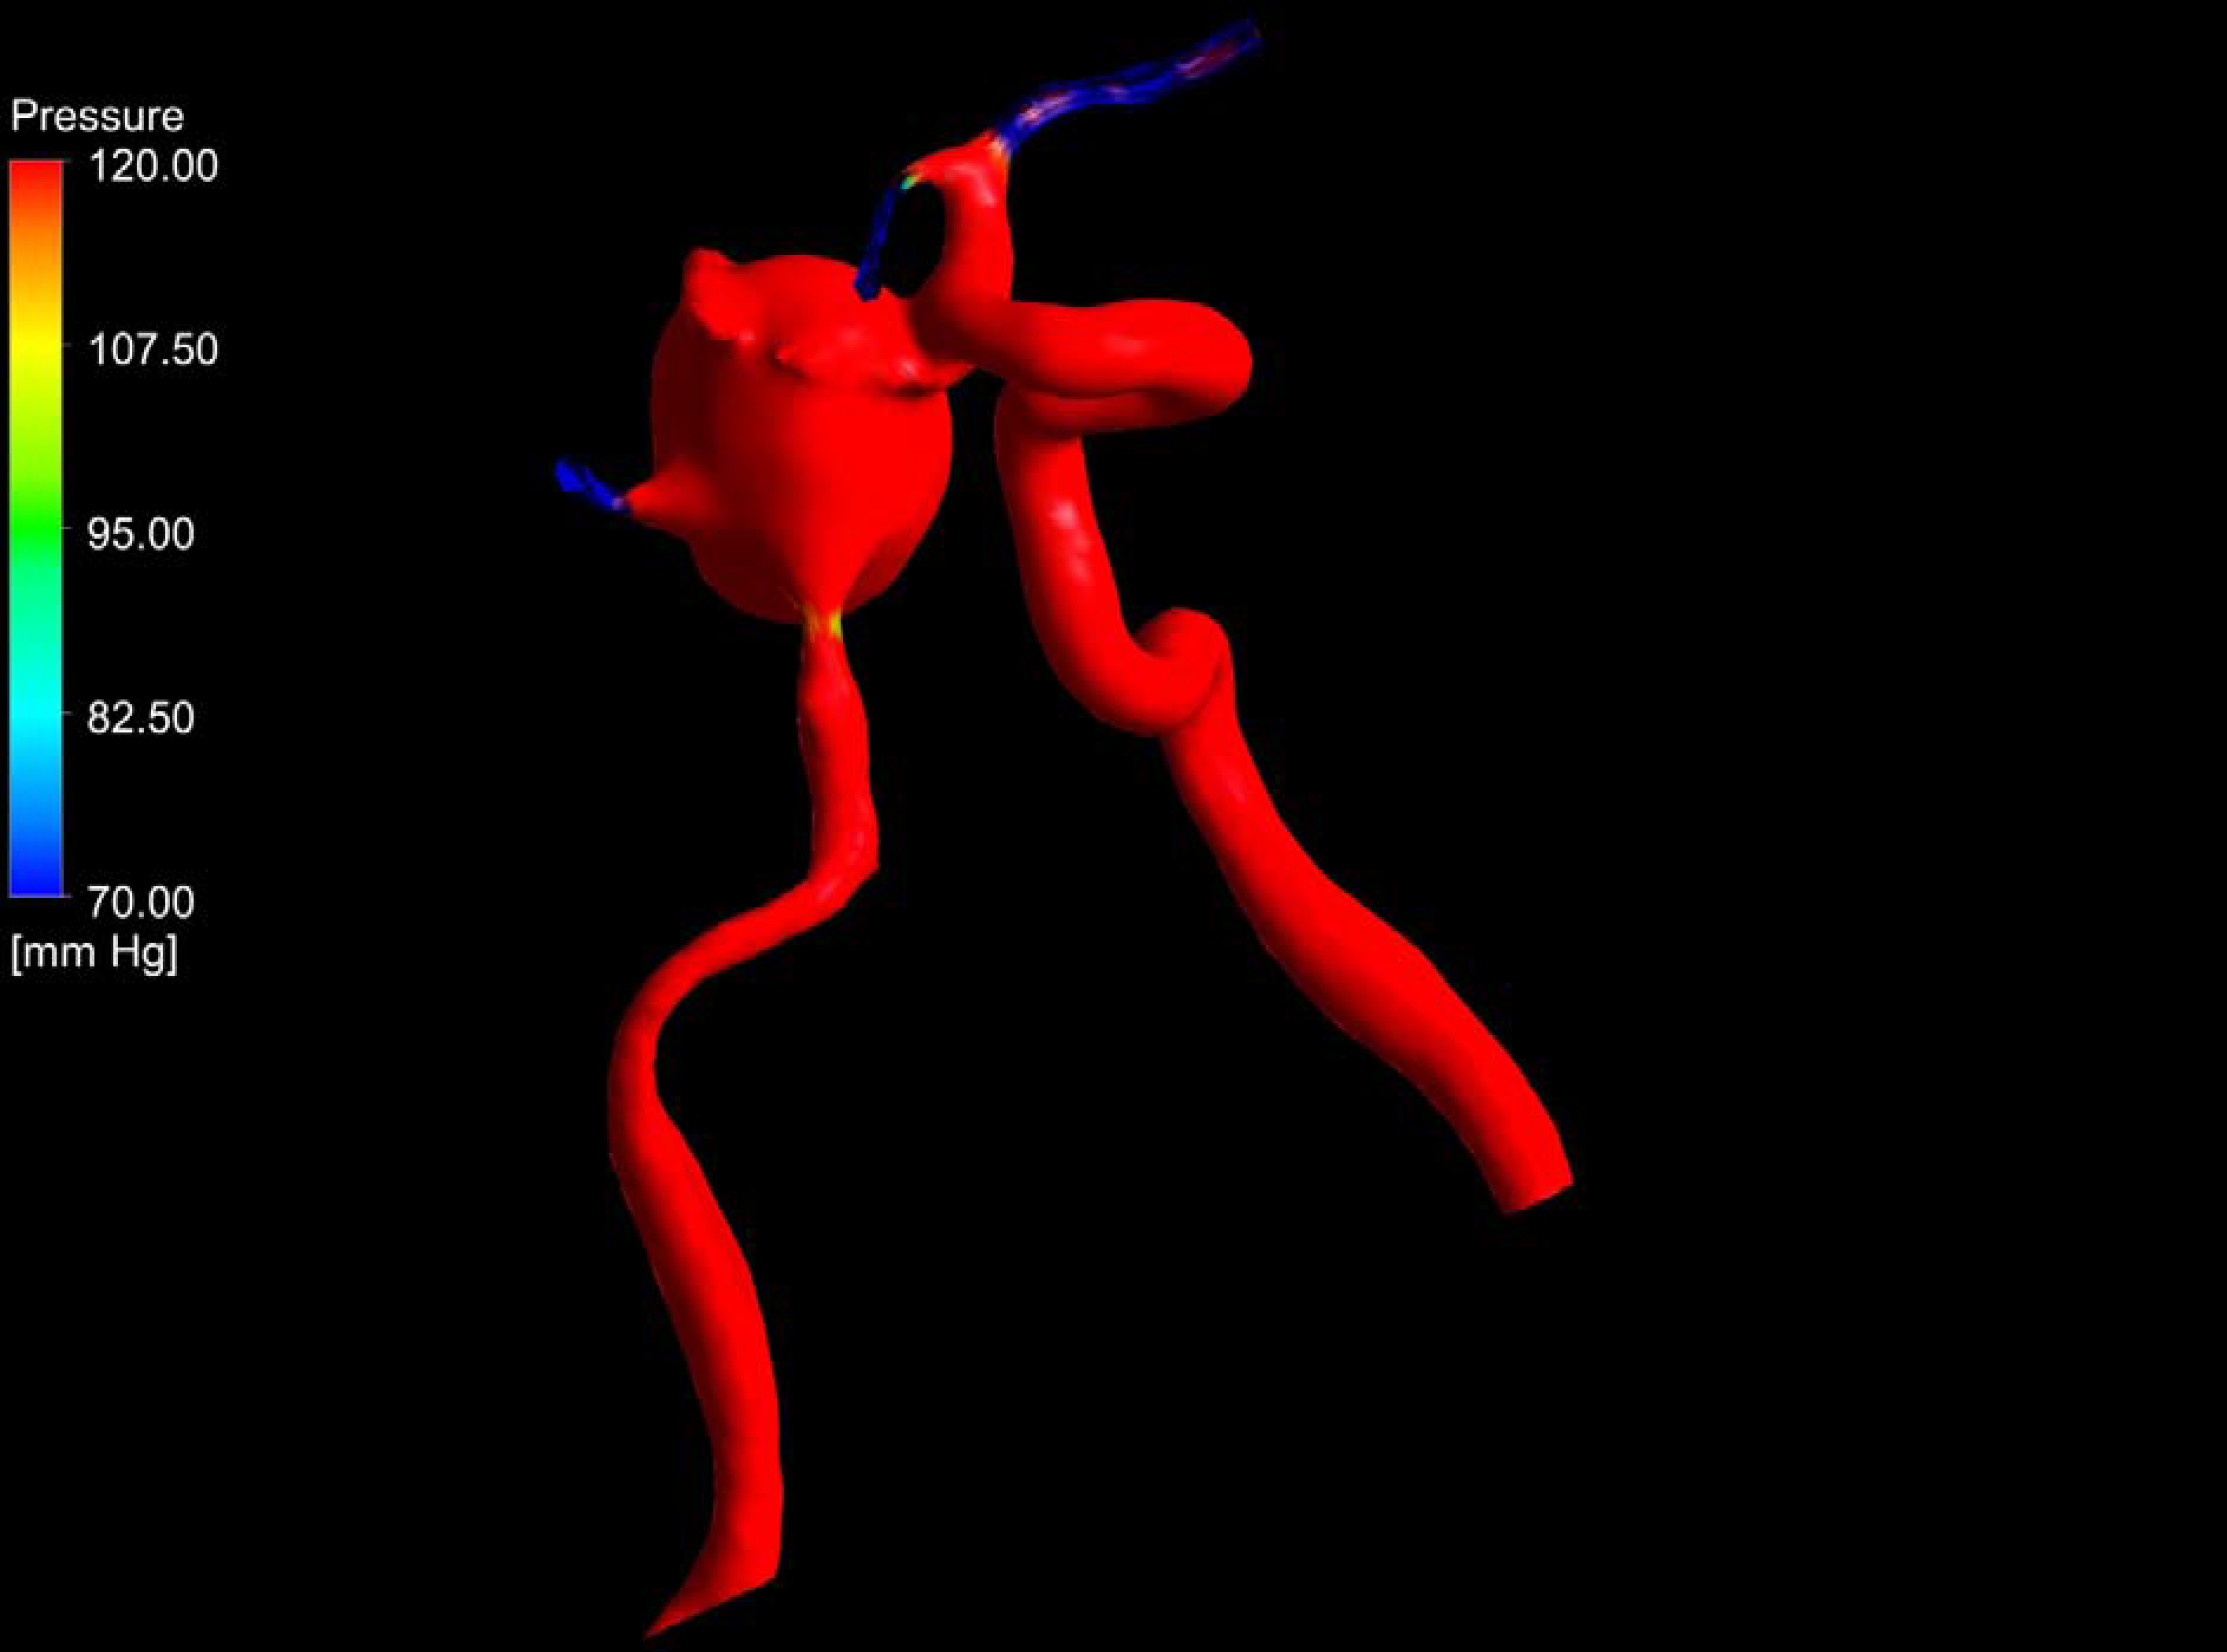
The site where WSS reaches its maximum values are marked with red color in Fig. 6. In these zones the blood flow produces a maximum friction with the wall of the veins. Because the nature of the blood flow in the aneurysm zone the WSS values are around 0.0020 mmHg. This maximum value that is obtained in this calculation is due to the flow patterns at intra-aneurysmal zone. It can be seen in this place that there are slowly differences in the magnitude of the WSS field. In fact at the zones around the second artery the WSS has the lowest value than other zones far from it.
Steady state approach: wall shear stress distribution at the aneurysm zone and adjacent veins.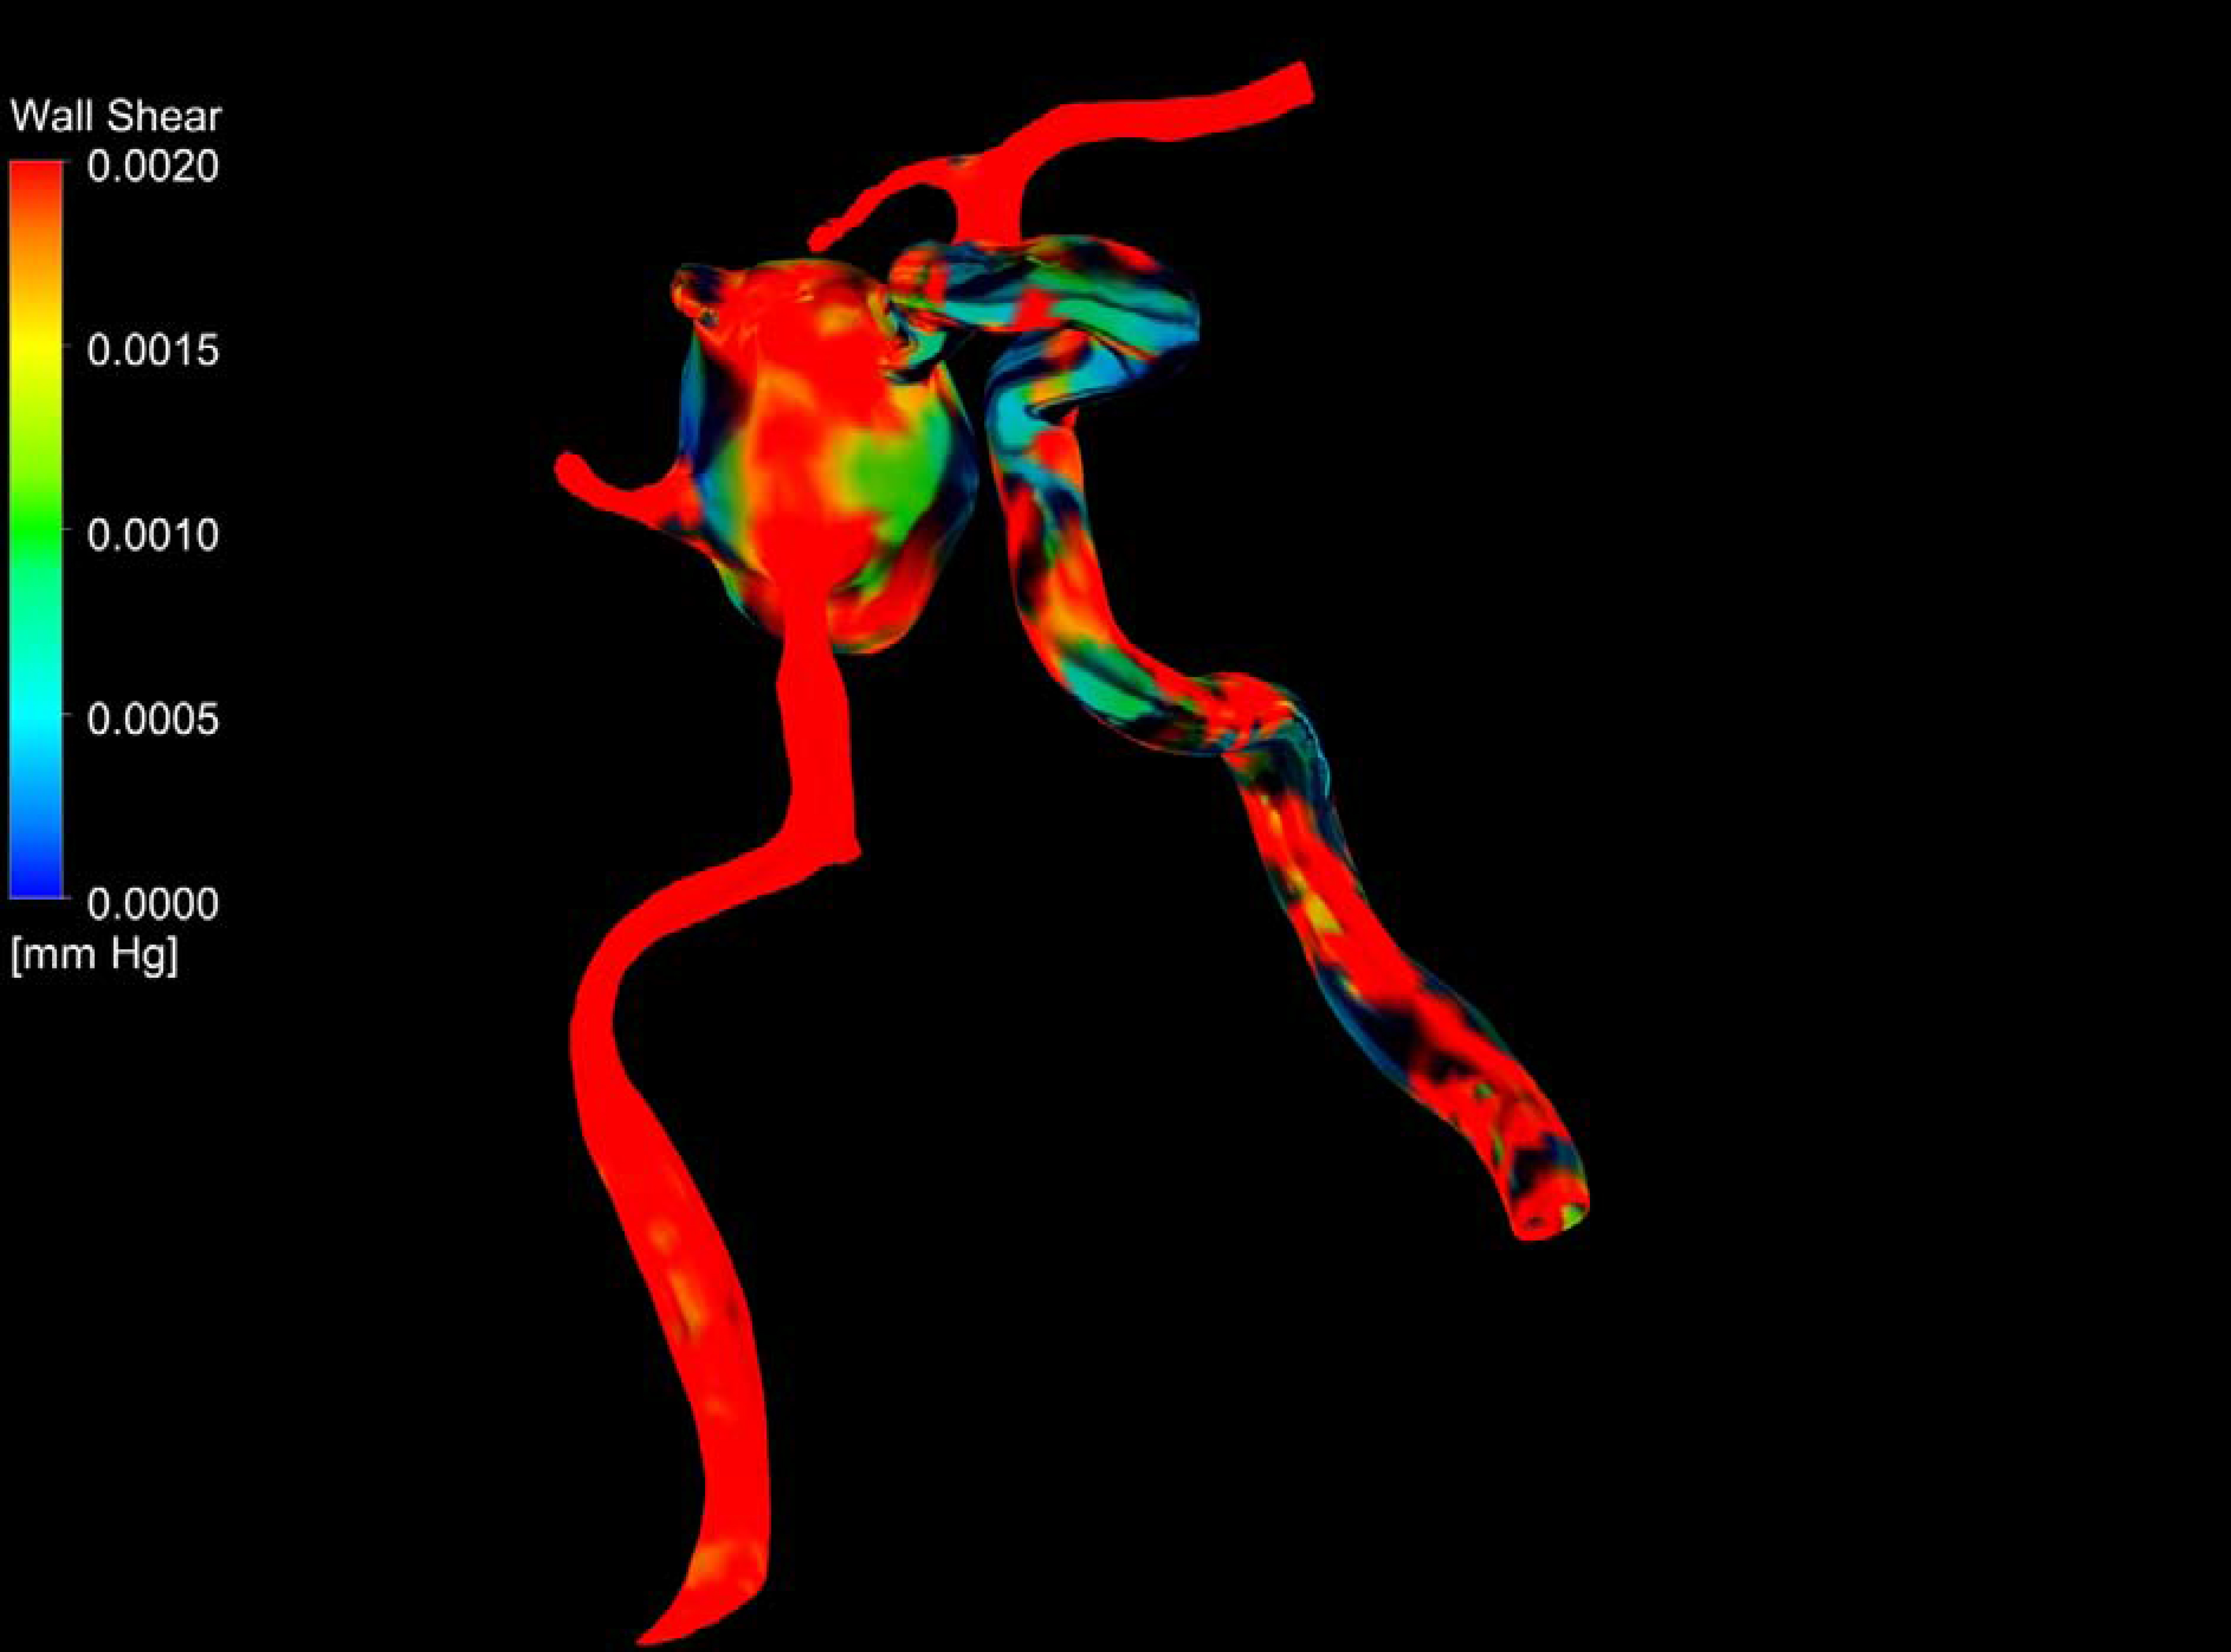
Pressure pulse at the inlet of the vein.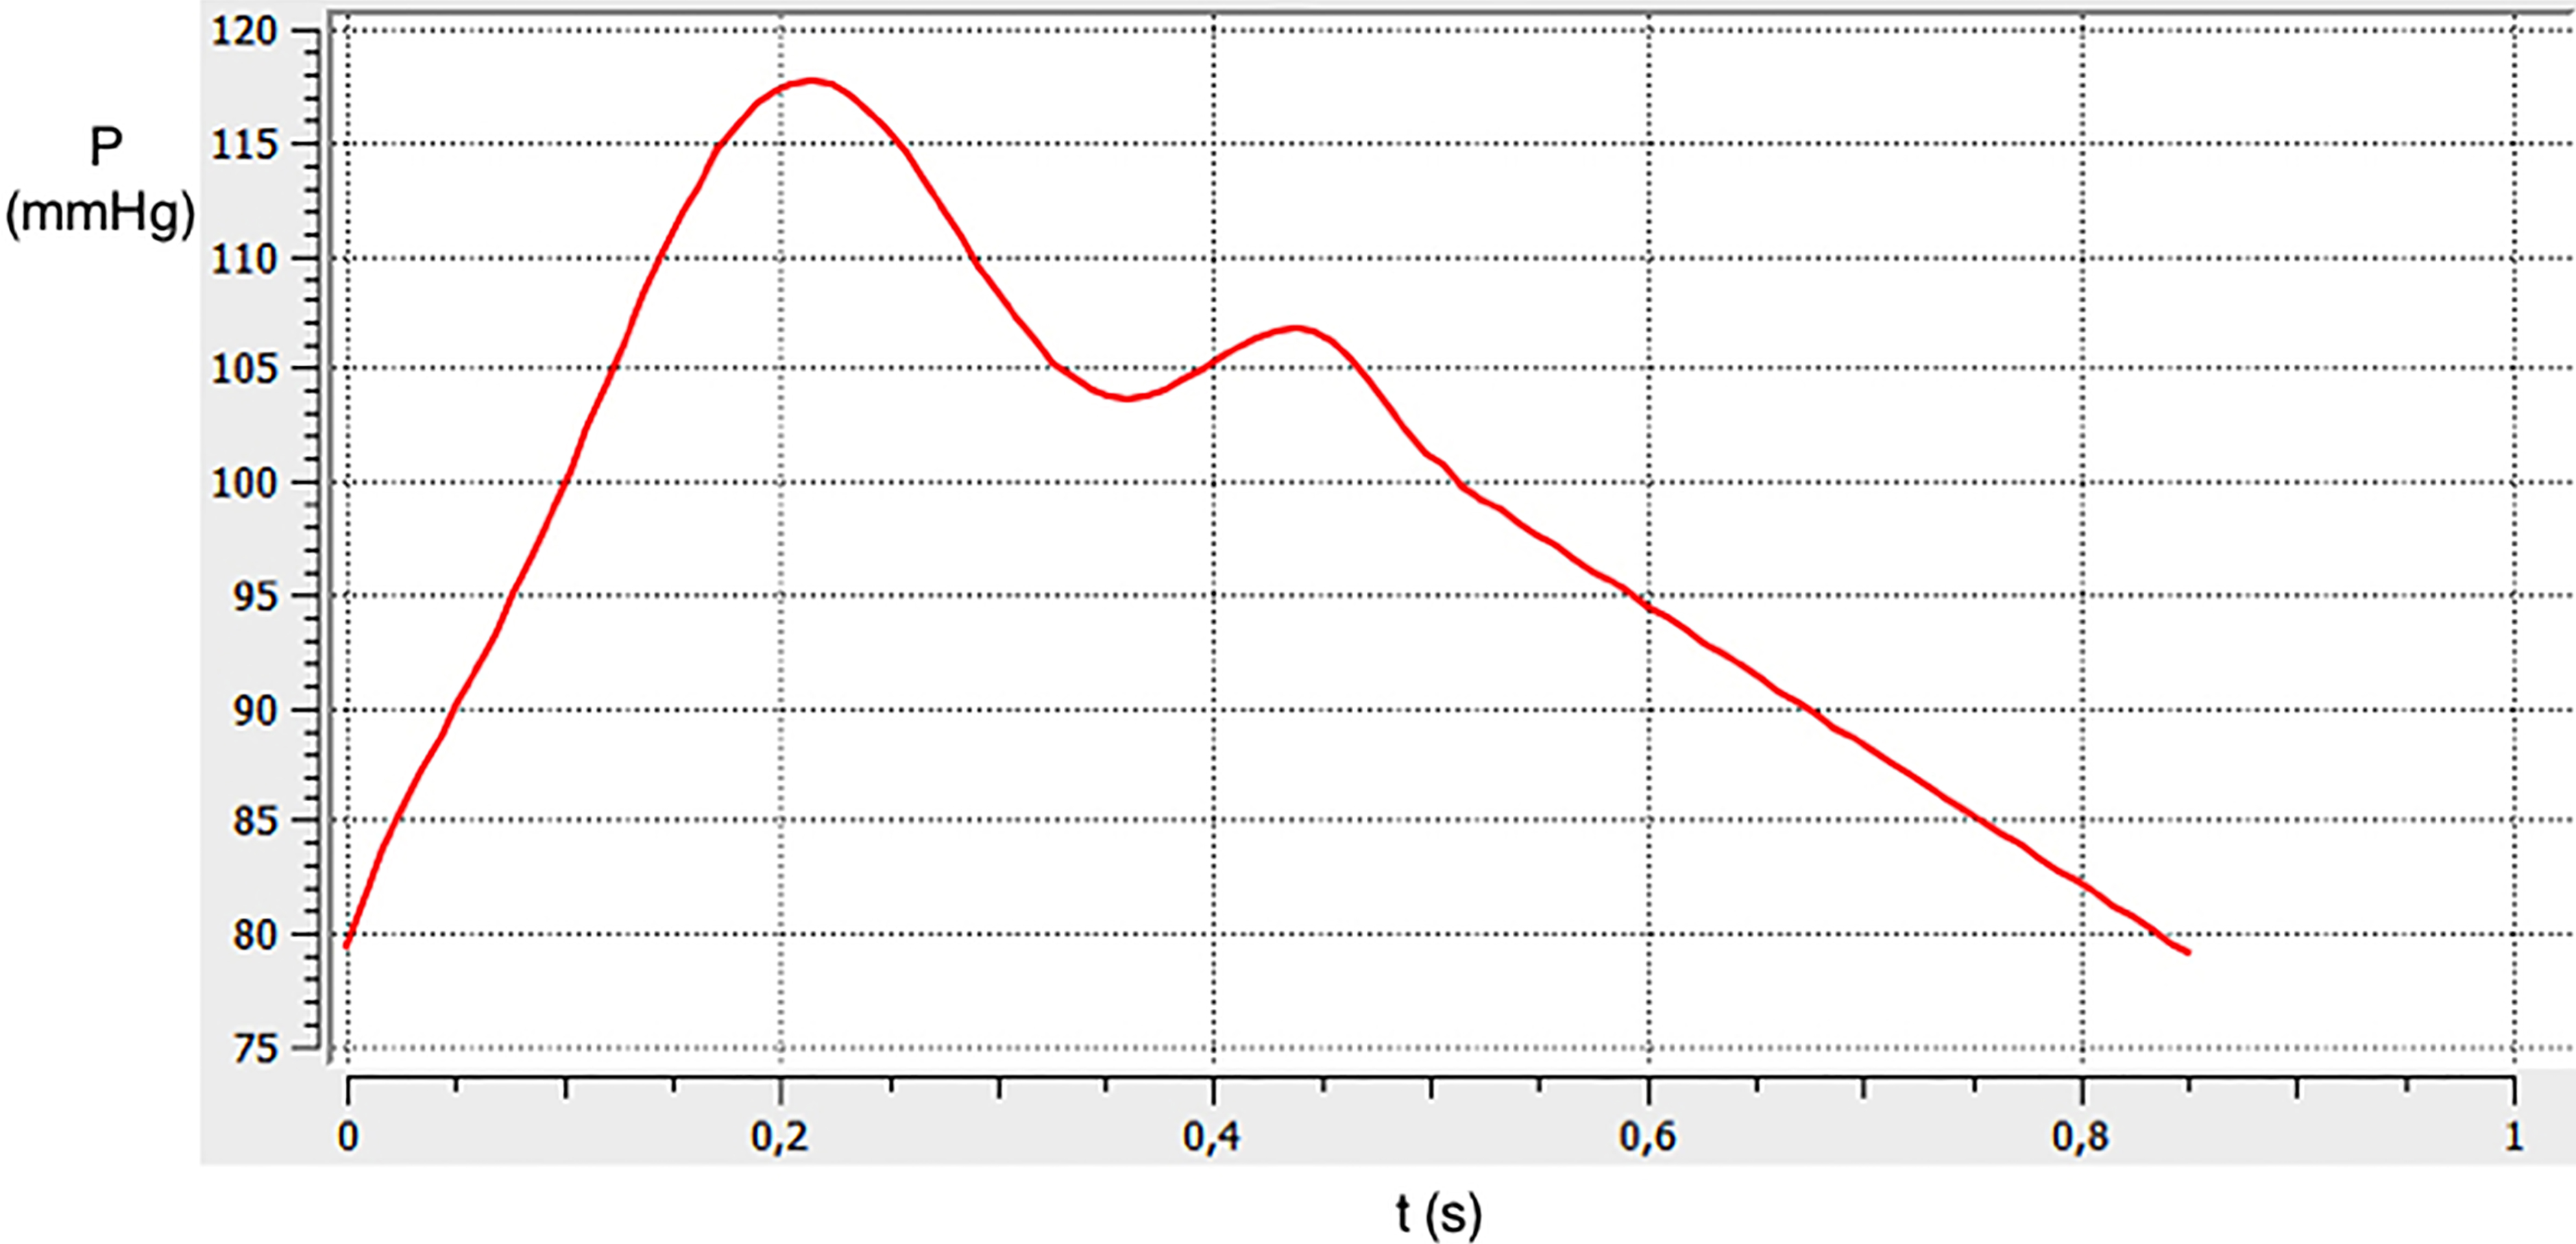
In these calculations the pressure in the vein varies around 80 mmHg (see Fig. 7). The vein has a pulsatile nature which is modeled using eigth degree polynomial as shown in Eq. (3) (see Fig. 1) as done by Vasava et al. [17].
where
Transient simulation (pulsatile flow): streamlines for intra-aneurysmal flow patterns and adjacent veins.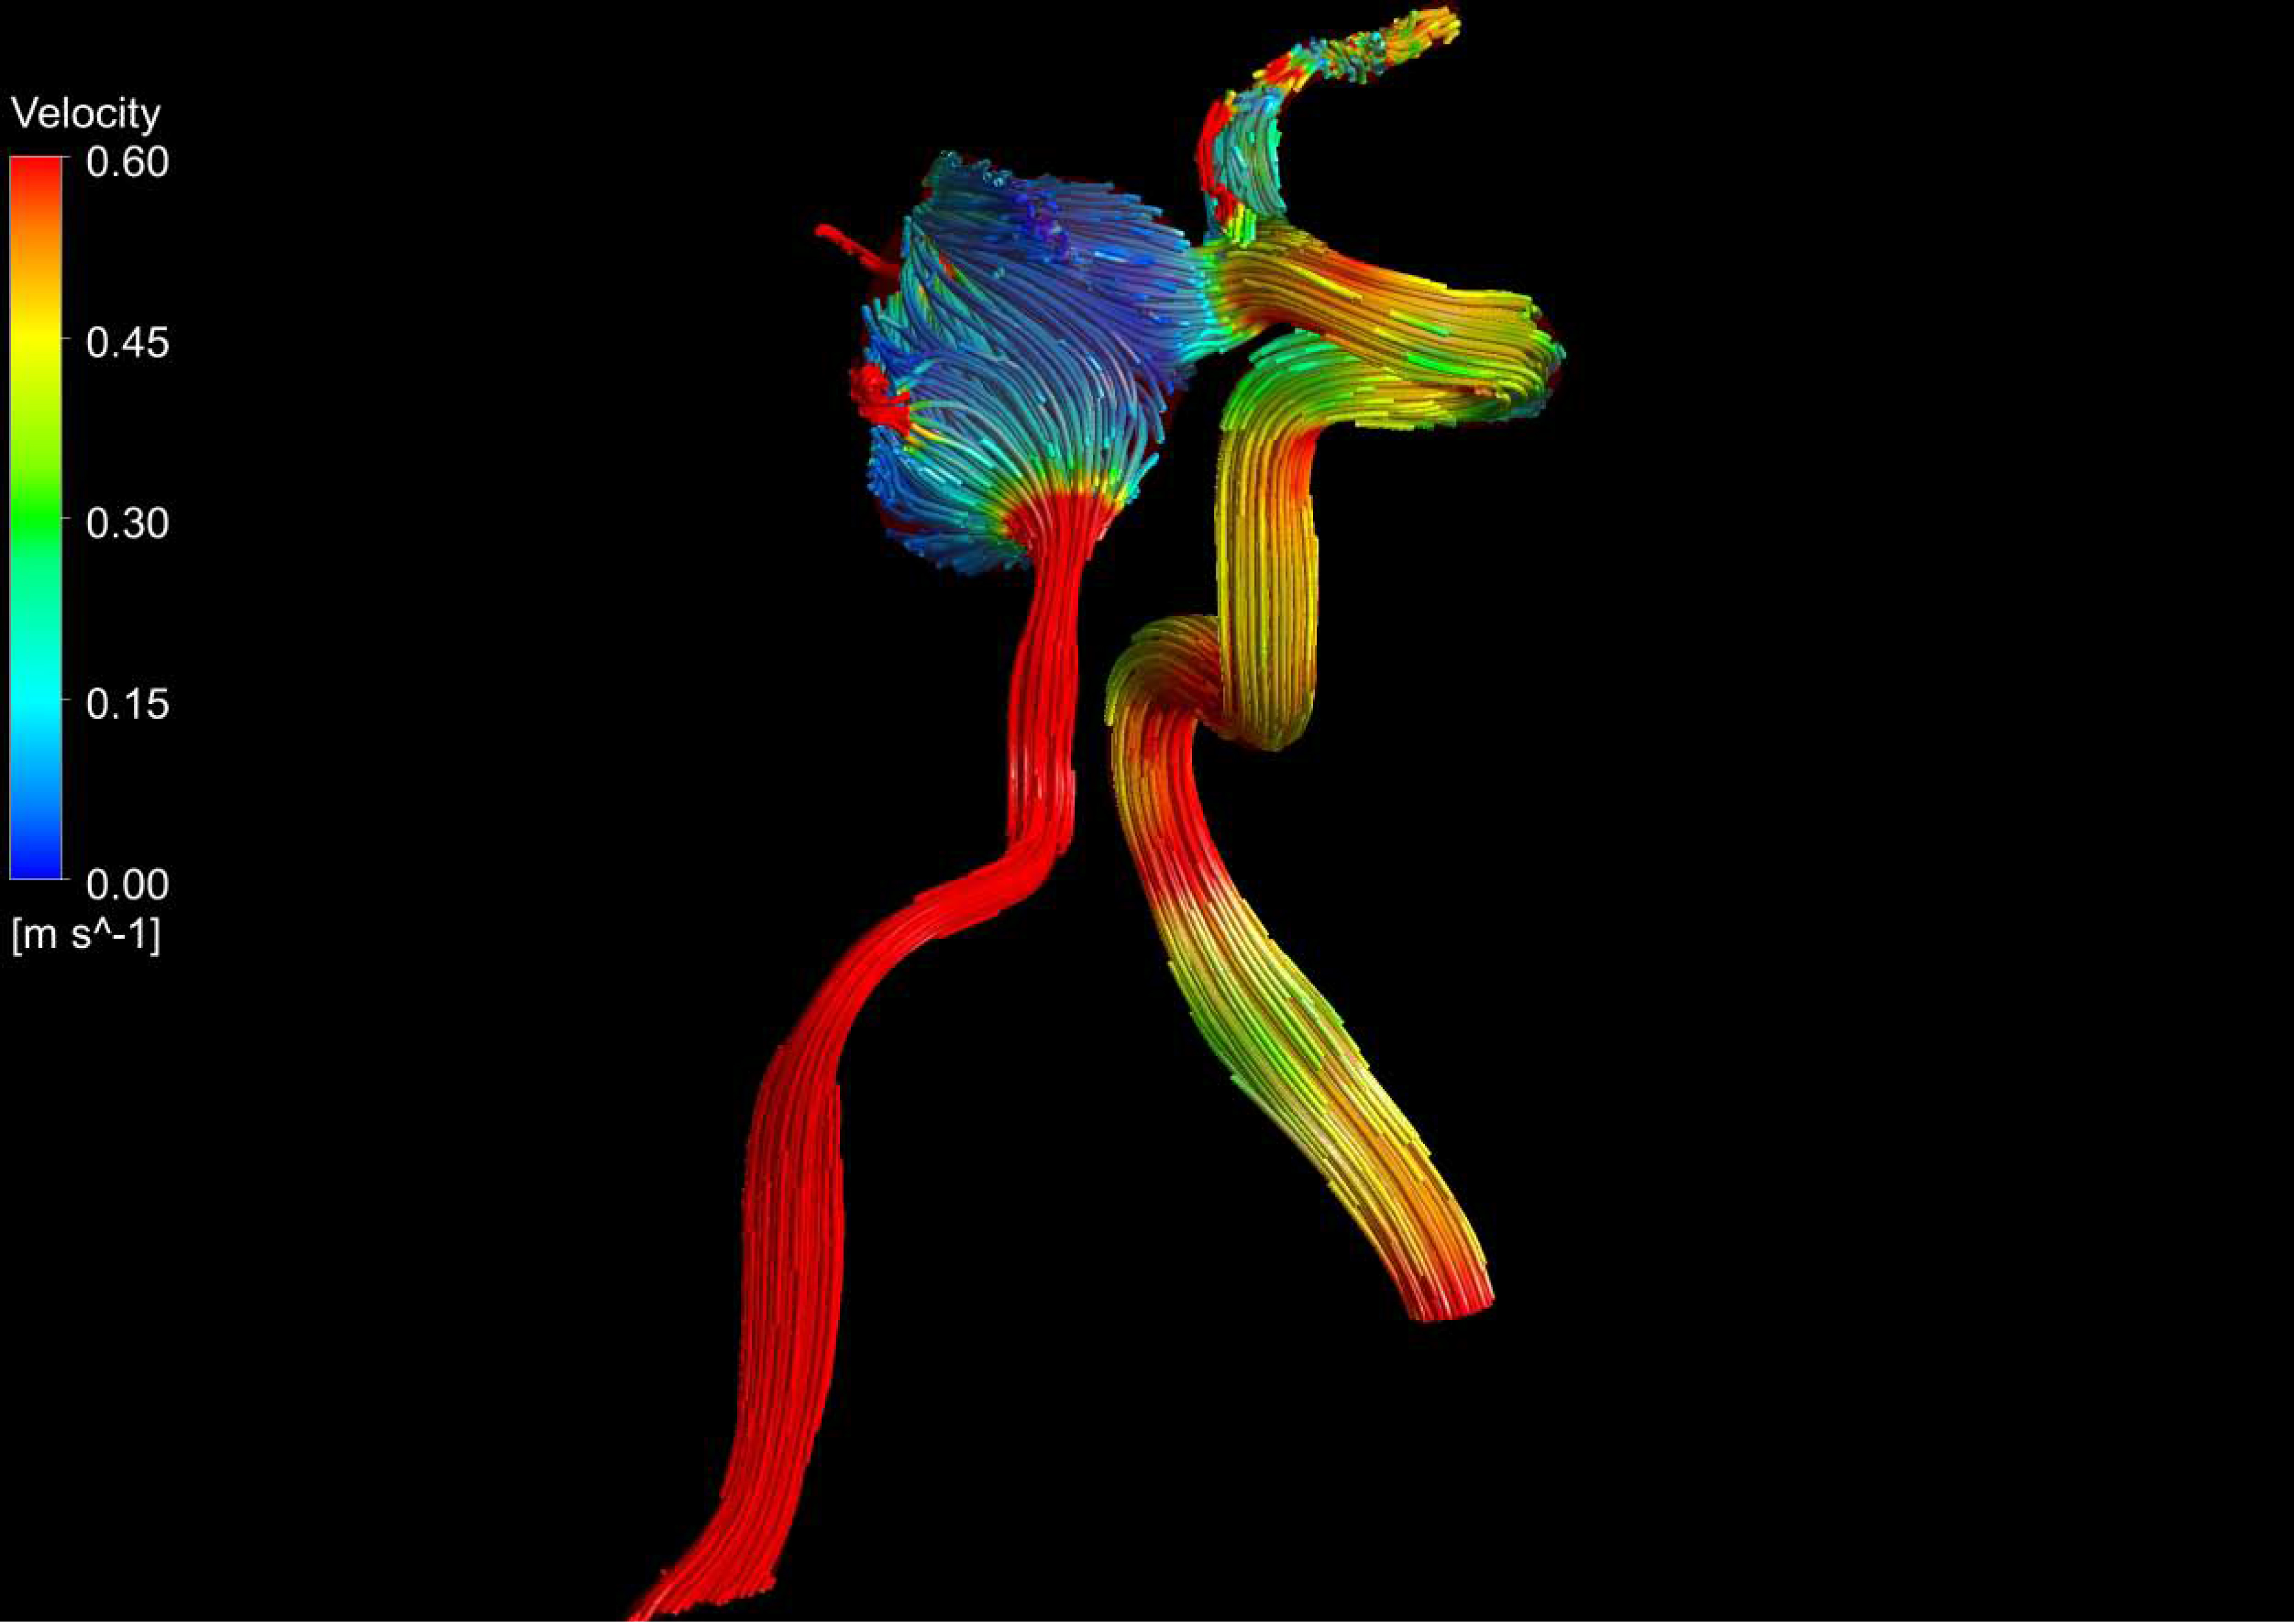
Transient simulation (pulsatile flow): pressure distribution at the aneurysm zone and adjacent veins.
Transient simulation (pulsatile flow): wall shear stress distribution at the aneurysm zone and adjacent veins.
Transient simulation (pulsatile flow): the vorticity of the intracranial system.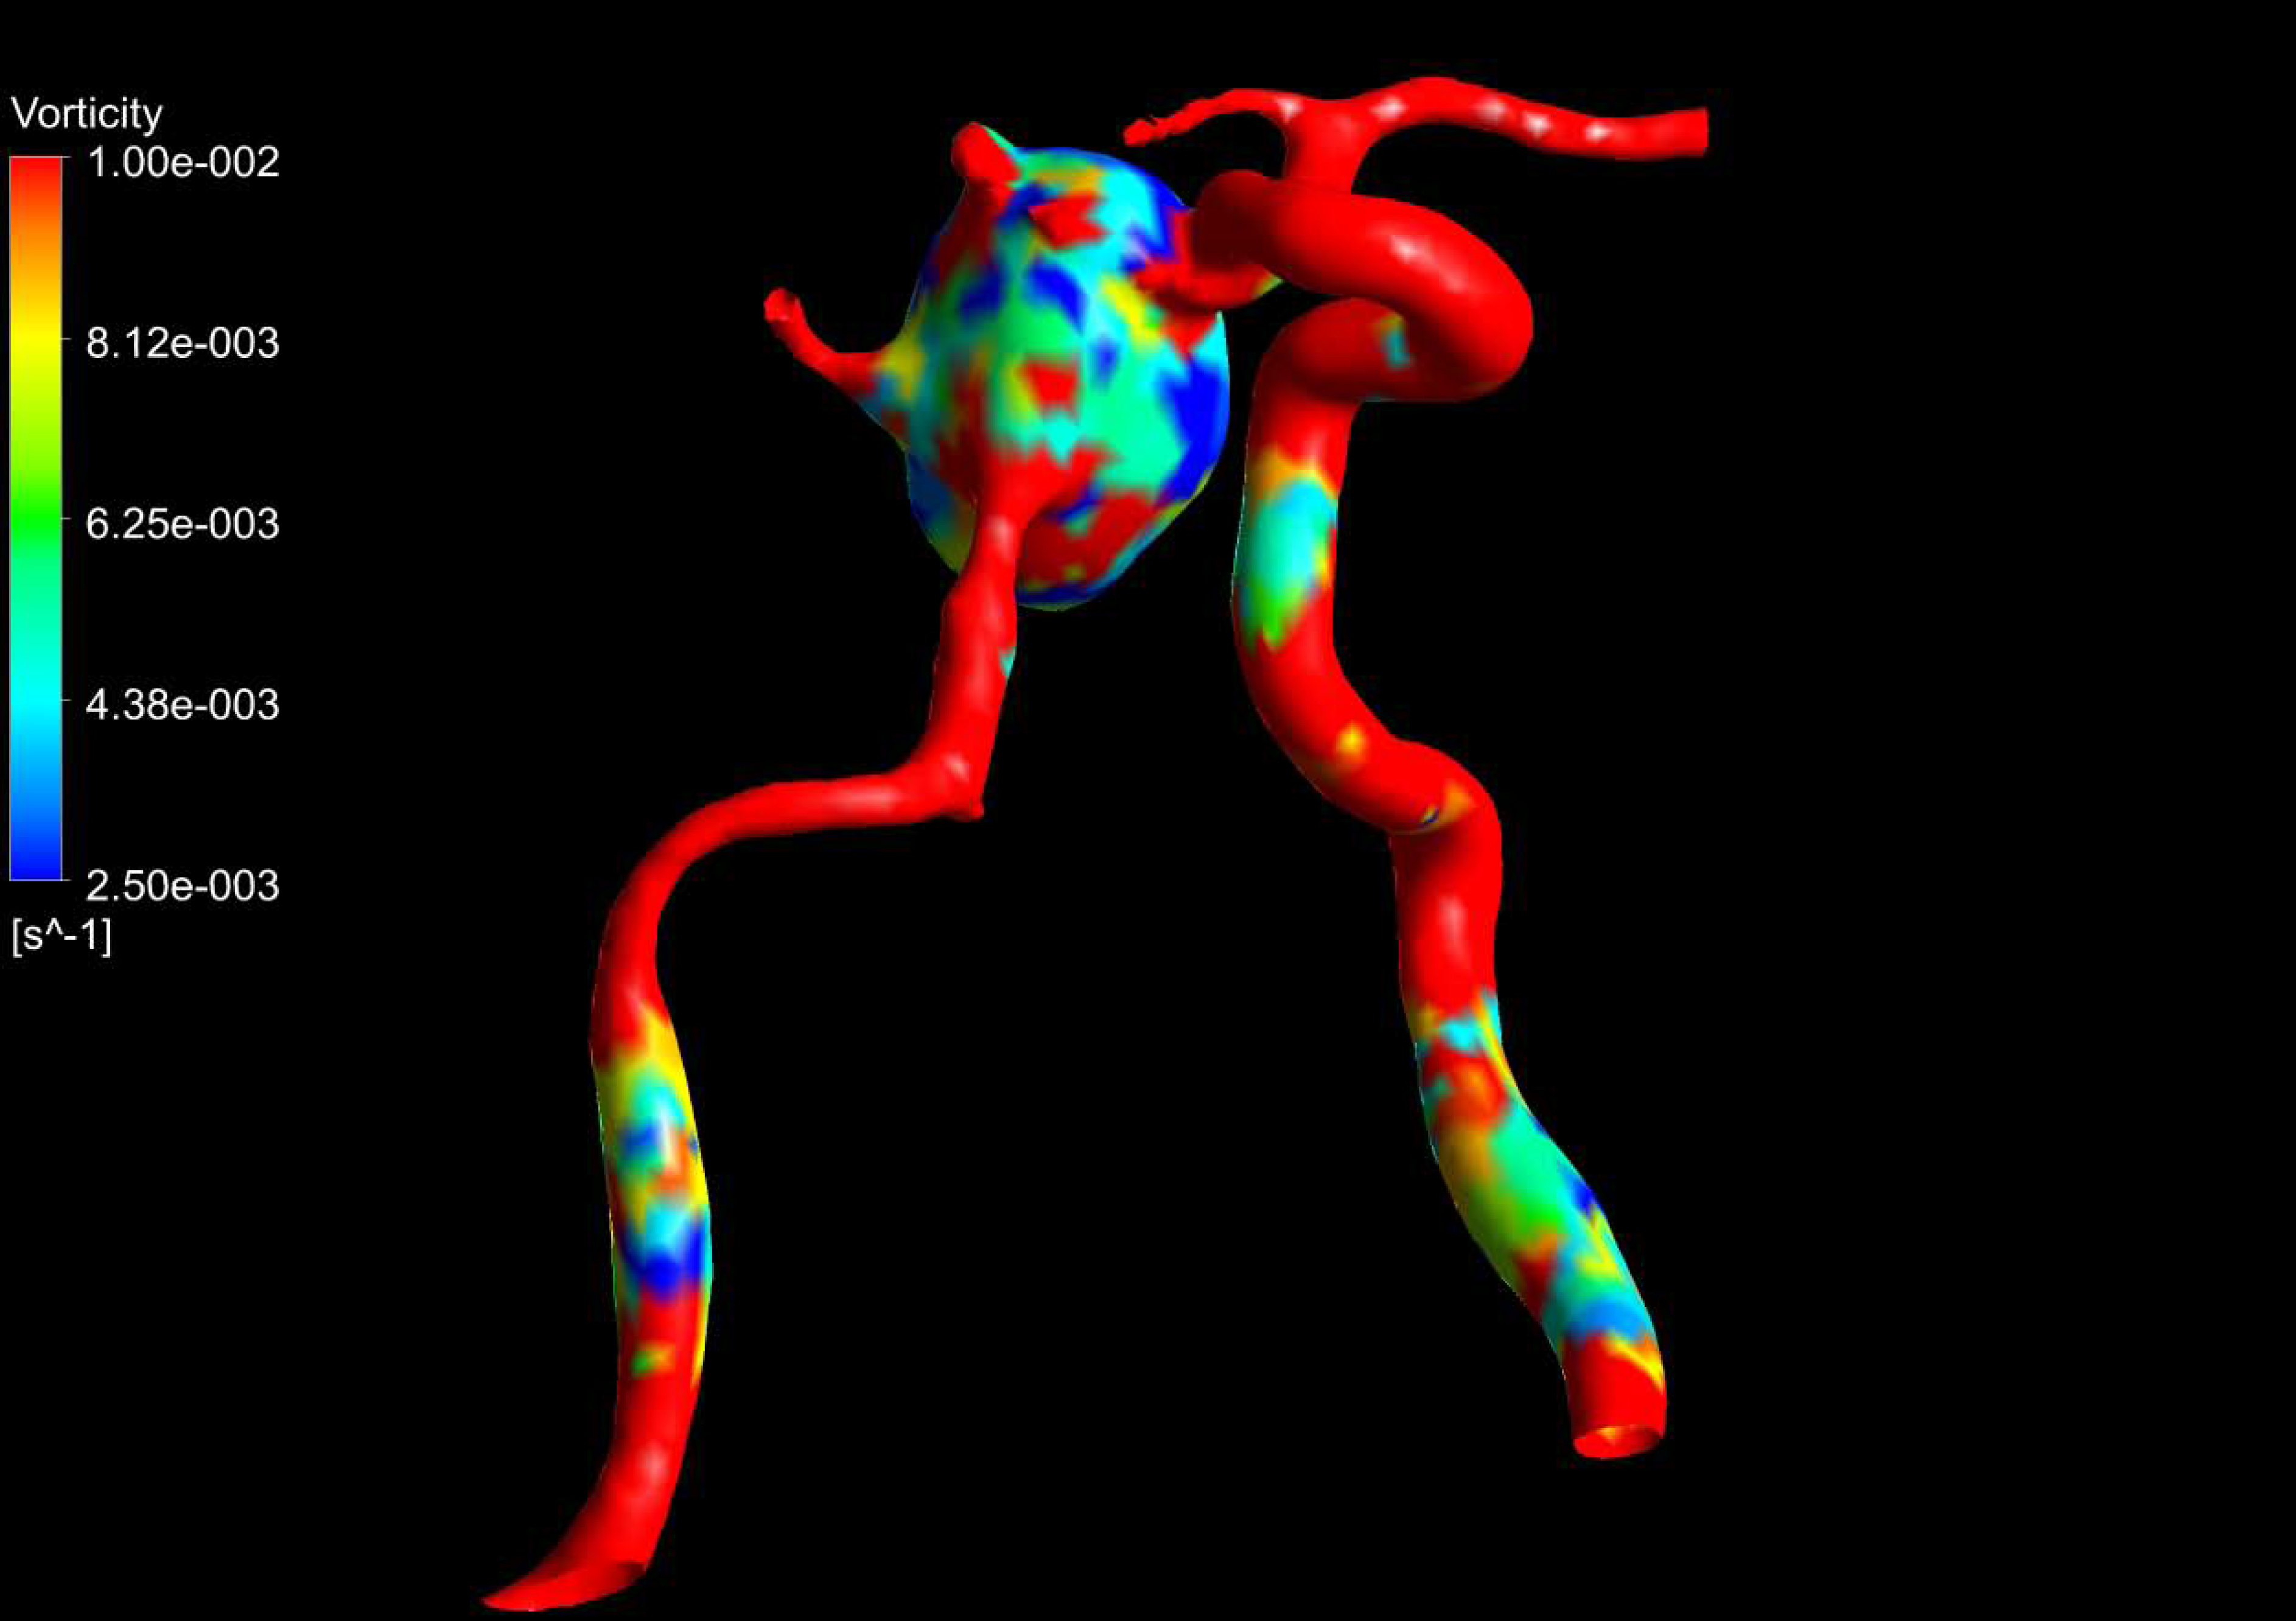
In these CFD calculations is shown a flux mixed with various features, for the different zones of the artery. In Fig. 8 is shown that in the zone after inlet condition, there is a flux that is uniform and the streamlines are approximately parallel between them. When the flux of blood is penetrating around the zone adjacent to the aneurysm the flux take other form and is decelerated with a velocity around 0.20 m/s. After that, the blood is circulating in the region where the aneurysm is located and in the neck of the deformation the flux is accelerated and reaches a velocity of 0.40 m/s. According to the nature of the blood flow inside the aneurysm zone is shown that this flow contribute to the mechanical stretching of the artery as well as with the evolution of the dynamics this region begin to more large in dimensions which is a risk for the patient studied here.
In the pressure field reported here (see Fig. 9) for the patient under consideration, it can be seen that there is a set of maximum values located at different zones next to the aneurysm. In these zones the flux of blood accelerates and reaches a value around 120.00 mmHg. At the other zones of the veins the pressure field takes the value of 70 mmHg. In Fig. 10 can be seen a distribution of the Wall Shear Stress in the veins for the patient under consideration. It can be seen that the maximum value is reached at some zones adjacent to the aneurysm with a value around 0.0020 mmHg, which decrease its magnitude at the other zones of the system. Figure 11 reported the vorticity of the system. It can be seen that in the veins adjacent to the aneurysm the vorticity reaches its maximum value. In contrast, at the aneurysm zone it can be seen that there are strong variations in the vorticity field.
In this work was proposed a numerical CFD model and method based on a specific patient. This model can be constructed from the MR images through a process of segmentation in an efficient manner that allows clinical studies of intra-aneurysmal hemodynamics. From MR images the 3D volumetric mesh was generated. This mesh was the input data for the Ansys CFX