
Abstract
Gear box has the high failure rate among the components in wind turbines and the vibration signal analysis is the most common technology in its fault diagnosis. Gearbox vibration signals of wind turbines have complicated compositions, strong background noise and obvious non-stationary characteristics. The new method research suited to non-stationary and non-gaussian characteristics of vibration signals is the key to improve the level of fault diagnosis technology. In order to diagnosis the operation status of wind turbines, based on the spectral analysis and the combination of vibration wave spectrum analysis of wind turbine gearbox fault diagnosis method is proposed. Through the gearbox oil spectral analysis, tests the main metal content in the oil, the preliminary judgment out of the wind turbine operation working condition. Using the vibration waveform frequency spectrum analysis method can get the fault severity, and analyzes the cause of the problem. This method can realize the wind turbine gearbox fault diagnosis, to ensure reliability. It is can effectively conduct the wind turbine development, design and optimization, and reduces maintenance costs.
Introduction
Owing to the serious energy crisis and environmental problems, wind energy as a green pollution-free energy has already got the attention of the world. With the expansion of the installed capacity, the timely discovery and maintenance of wind turbine fault become more and more important. Owing to the serious energy crisis and environmental problems, wind energy as a green pollution-free energy has already got the attention of the world. With the expansion of the installed capacity, the timely discovery and maintenance of wind turbine fault become more and more important. As a new green energy, wind power generation has received much attention. By the end of 2016, the global total installed capacity has reached to 486.749 GW, and the national total installed capacity has reached to 168.735 GW in China, which maintains a leading position in the total wind-capacity [10, 11, 12]. Global wind power installed capacity is shown in Fig. 1, China’s installed capacity is shown in Fig. 2.
Global wind power installed capacity statistics from 1996 to 2016.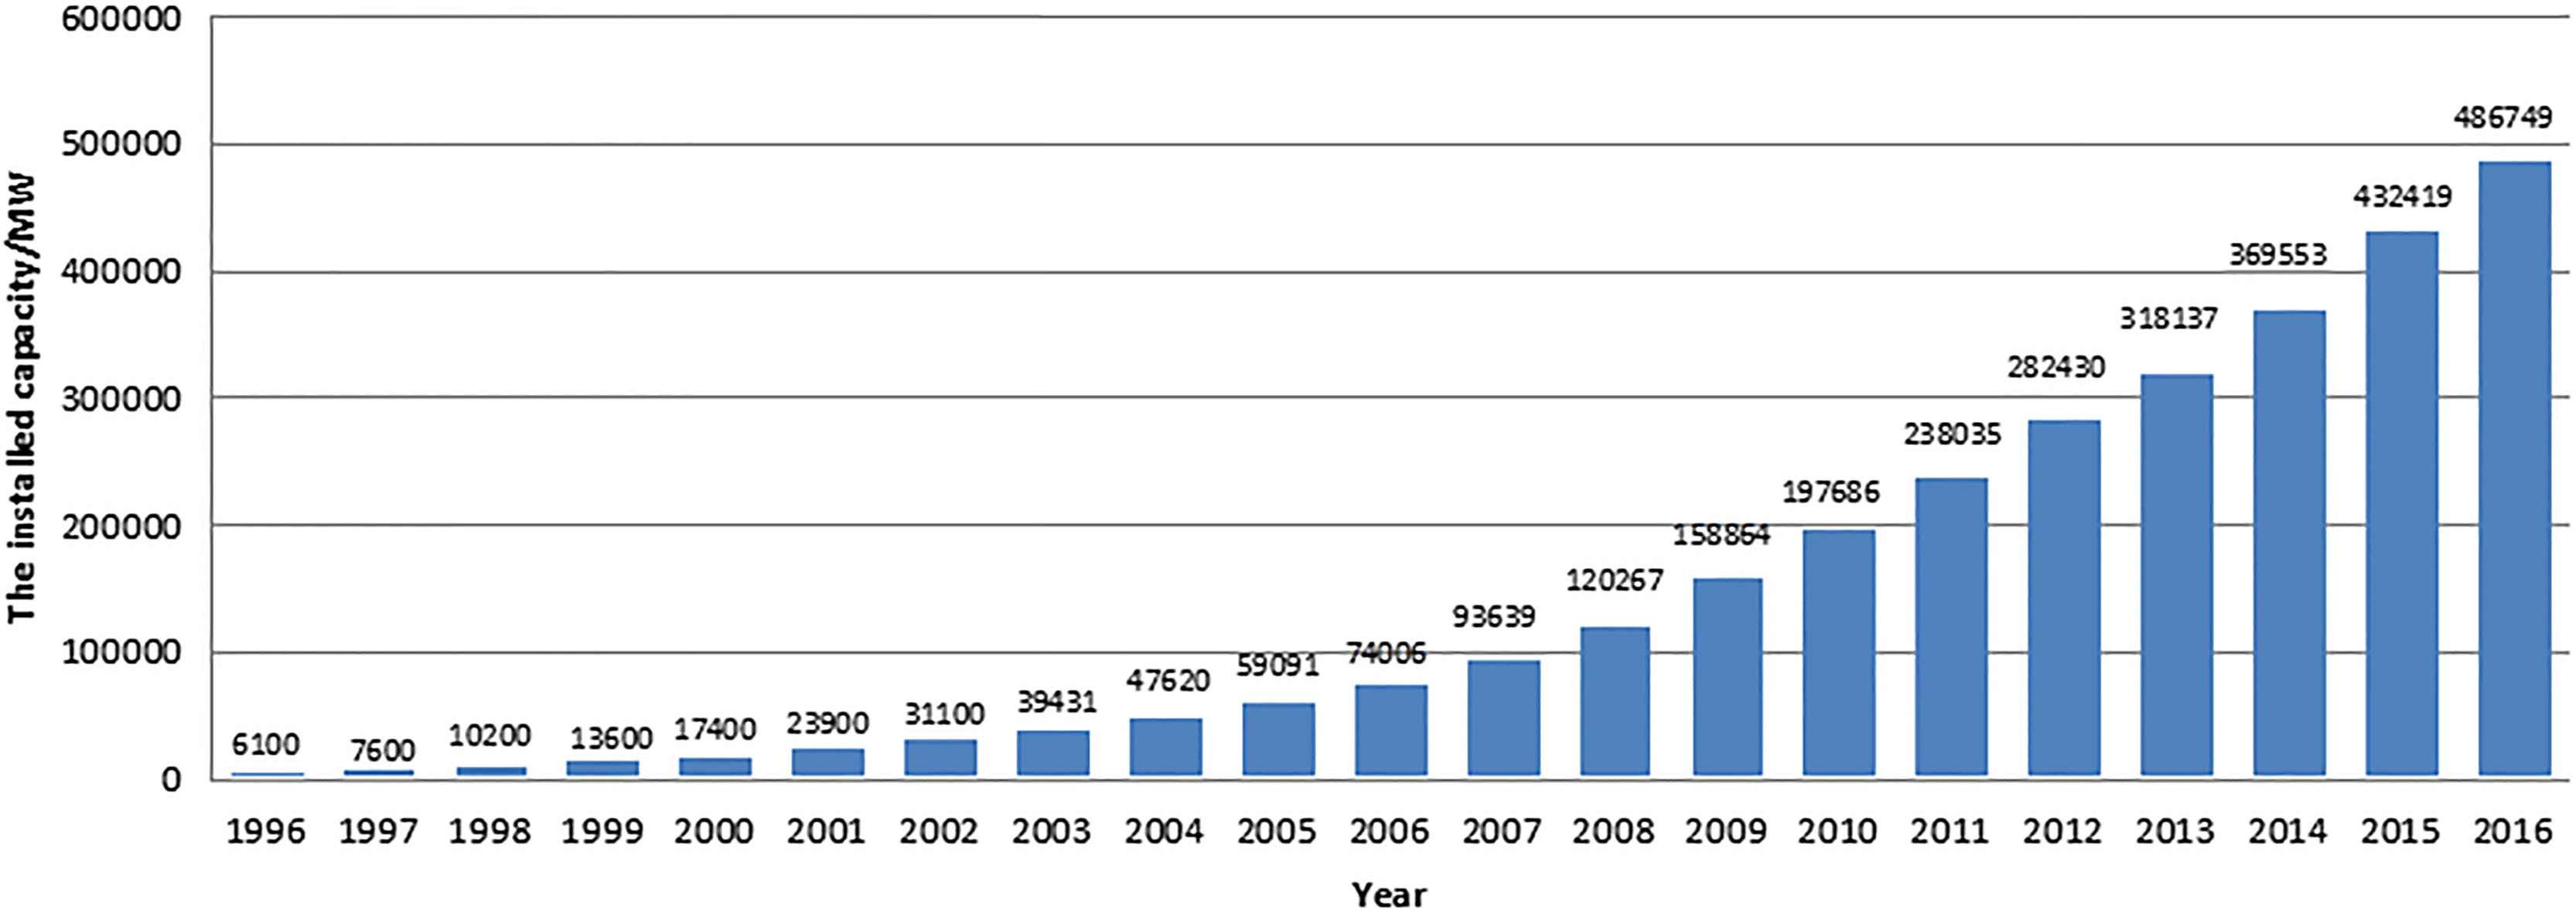
China’s wind power installed capacity statistics from 2001 to 2016.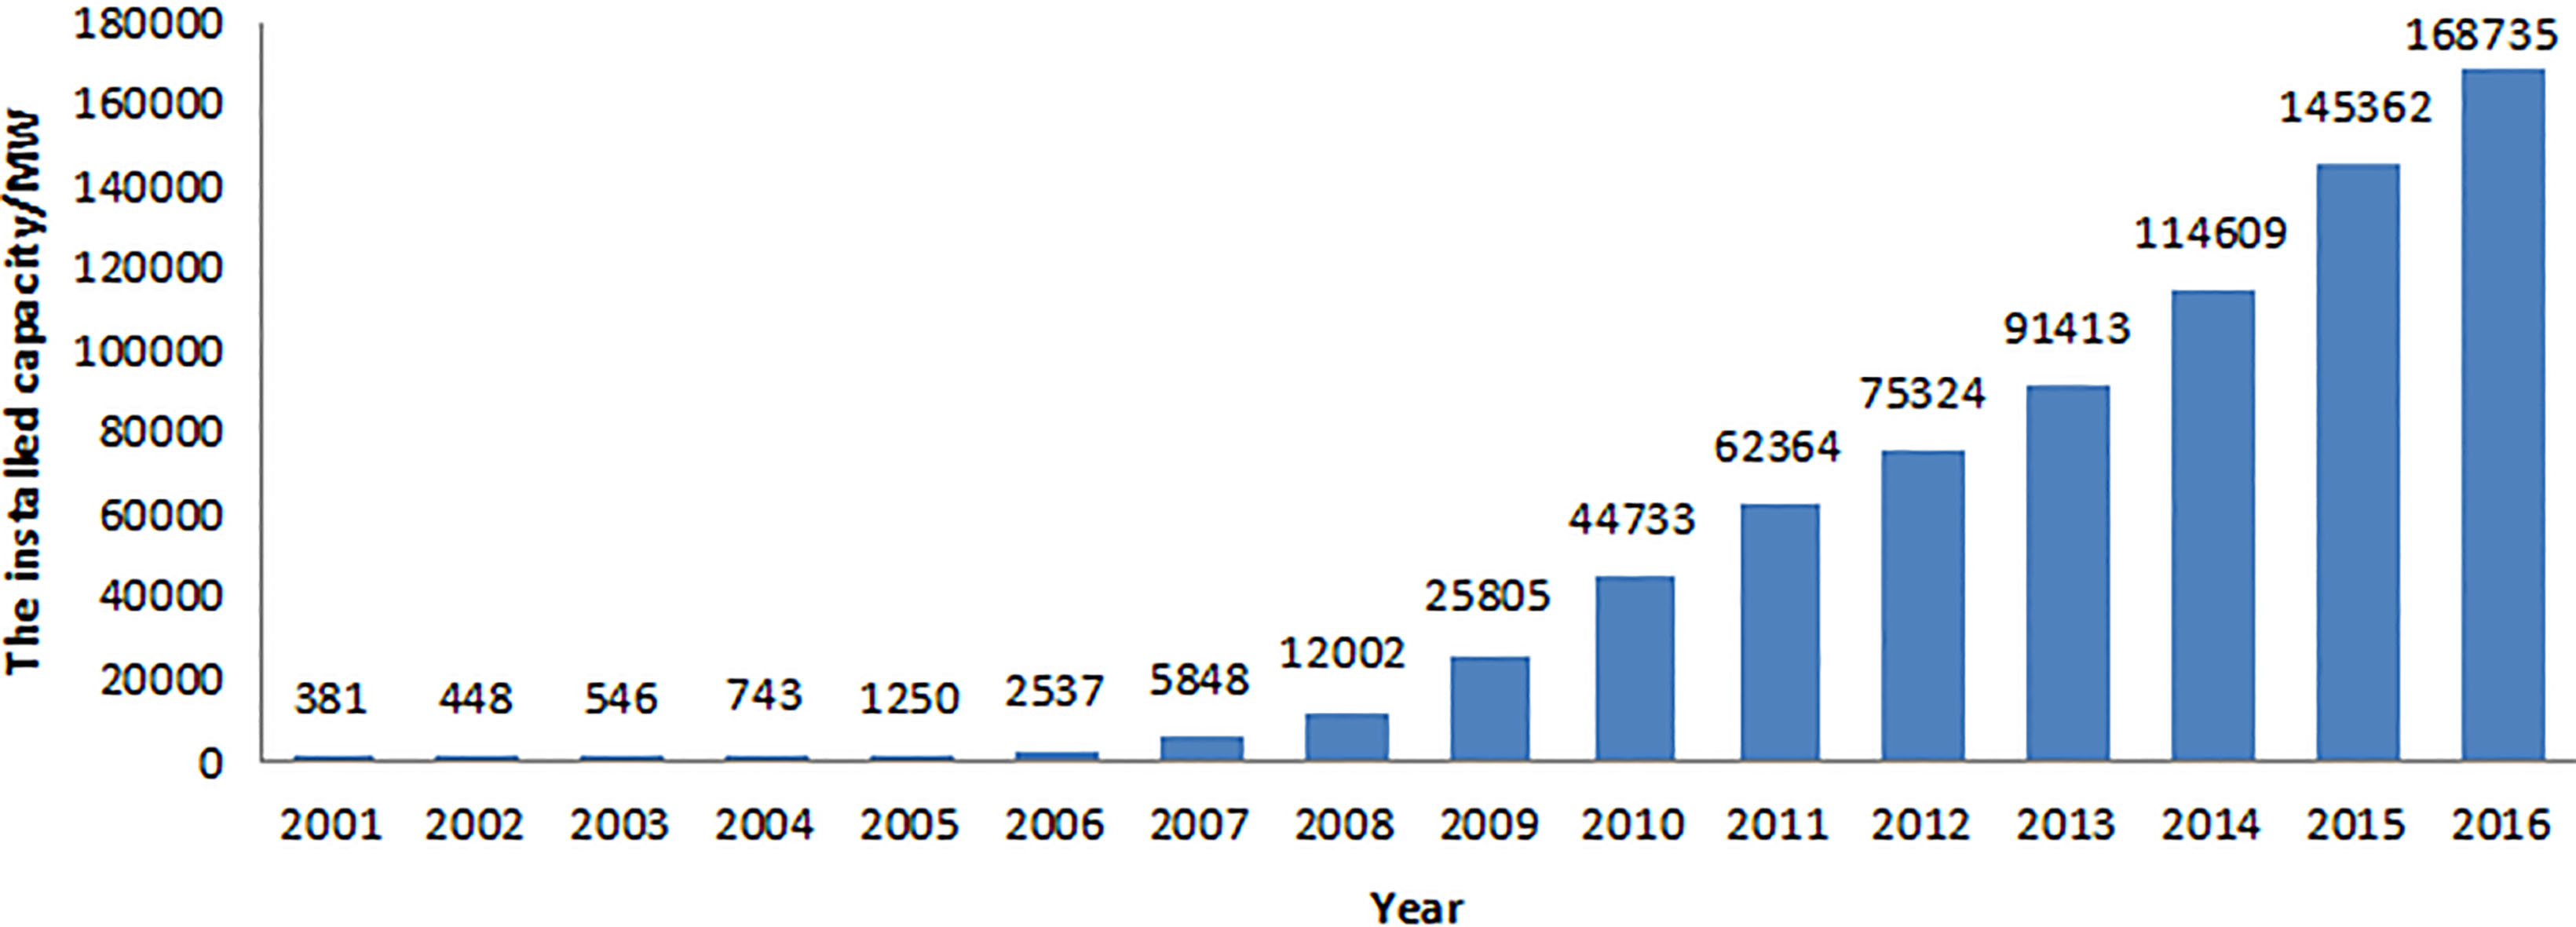
However, the operation stability and generating efficiency of domestic wind turbines are not satisfied. Wind turbine converts wind energy into electrical energy and its power comes from the wind. In the space, the wind speed of different location is not the same, such as air density and turbulent flow intensity. On the time, the wind is fickle and cannot be accurately forecast. The presence of these factors increases the complexity of the working condition of wind turbines [9], so that its failure characteristics and conventional mechanical equipment also have very big difference and wind turbine fault diagnosis technology remains to be perfect. What’s more, as an emerging industry in China, the technology of wind power industry is not mature, and wind power unit failure rate is higher [6]. As a result, how to diagnose wind turbine fault effectively becomes the problem to be solved for the wind power equipment manufacturers and owners [34].
There are many methods about wind turbine fault diagnosis, such as ultrasonic testing, stress wave analysis, vibration analysis, oil analysis, temperature analysis and so on [16]. Among them, vibration analysis is used widely and can predict the early failure [33]. For the fault diagnosis technology based on the conventional mechanical equipment [17, 21], experts also proposed some fault diagnosis theory special for wind turbines. But the commercial development of China’s wind power industry is only about 10 years, so the fault diagnosis theory system is not perfect and many theories are not applied to the practice [35].
Oil analysis is a key element of equipment and parts reliability. The equipment failure statistics shows that equipment failure of 80% is lubrication failure caused by abnormal wear and tear. In this paper, gearbox fault diagnosis method is proposed based on the spectral analysis and the combination of vibration wave spectrum analysis of wind turbine [36].
Along with the rapid development of modern industry and technology, the modern equipments have the more complicated structures and the correlation among different equipments is improved gradually. The different parts of the same equipment also couple tightly. Therefore, one fault of equipments can cause a chain reaction, or even a breakdown in production process. So the mechanical fault diagnosis is of great importance in production, research and development of modern enterprises. As important general machinery parts for connection and transmission, gears and gear box have been widely used in modern industrial equipments. Once the failure occurs in gear box, it will bring a great loss to the whole manufacturing process [4, 5]. At the same time, the higher requirements of accuracy and fault diagnosis technology of equipments are put forward with the development of modern science and technology [7]. As a result, the study of fault diagnosis in gear transmission is of very important theoretical and practical significance.
The gear, shaft and bearing of gear box will vibrate at work. The vibration signals of the gearbox are stable in normal operation and are formed by the meshing frequency of gear and the rotating frequency of axis. The research on vibration and noise of gear box began a century ago [24, 25]. Until the mid-1960s, some scholars attributed the evaluation of gear quality to vibration and noise. British scholar Optiz (1968) proposed that the gearbox vibration and noise were the functions of transmission power, gear transmission error and precision. Gearbox fault diagnosis originated in the 1970s, initially limited to direct analysis and measurement of some simple vibration parameters, such as vibrating peak value Pk and root-mean-square value RMS, and the parameters’ changes revealed the operating condition of gear. In addition, some dimensionless parameters, such as peak coefficient CF, could be used to remove the influence of load changes. These simple methods had achieved success to some extent with the limited sensitivity and the low precision. Until the mid-1980s, Randall and Taylor (2009) made the experimental investigations, leading to the rapid development of frequency domain method in gearbox fault diagnosis. And a lot of examples of fault diagnosis were accumulated, of which the fault diagnosis of gear wear and tooth fracture were more successful. Although there are some achievements on theory and practice [26], the fault mechanism research is still not enough and the signal quantization need to be improved and researched further due to the complex structure and large interference of gearbox [20, 22].
This paper studies the method can realize the wind turbine gearbox fault diagnosis, to ensure reliability. It is can effectively conduct the wind turbine development, design and optimization, and reduces maintenance costs [8, 23]. This paper is organized as follows. In Section 2, gearbox oils’ spectrum experiments are introduced. In Section 3, the experimental results are analyzed. In Section 4, wind turbine gearbox fault characteristic frequency analysis is introduced. The spectrum of gearbox vibration waveform analysis is proposed in Section 5. Finally, the proposed method in this paper is summarized in the last section.
The experimental results and analysis
Samples
Samples and data were offered by Zhejiang Windey Co., Ltd. Used wind turbines were Nos 39 and 40 units Zhangbei Zhangjiakou wind farm in Hebei province in China. Product brand of the oil was SHC XMP320. Sampling location was a lubricating oil pump in gearbox. The date and number of the oil samples are shown in Table 1.
Number and date of the oil samples
Number and date of the oil samples
Viscosity detection is the important basis to determine whether the oil meets the requirements, as well as testing indexes for quality of oil. The pollution, degradation and other reasons in the use of oil can make the viscosity change [28, 31]. Such as oil sludge generated in the high temperature oxidation, the dust pollution will make the oil viscosity rise, and the light oil pollution will reduce oil viscosity. Viscosity change range of equipment lubrication permit [32], will lead to abnormal wear and tear of equipment. 40
40
C kinematic viscosity test results
40
According to the national standard GB/T 265 and comparative reference 272
The contents of Fe, Cu, Al and Si elements in the oil are tested. Iron content in the gearbox oil is shown in Fig. 3. Silicon content in the gearbox oil is shown in Fig. 4.
Iron content in the gearbox oil.
Silicon content in the gearbox oil.
It can be seen from Fig. 3 that gearbox oil Fe content increases with unit operation time. Normal iron content should be less than 60 mg
As shown in Fig. 4, the silicon content in the oil increases as unit operation time. Normal Silicon content should be less than 20 mg
In addition, the content of copper element in oil is 1 mg
Relative to other fault diagnosis method, the vibration of the gearbox is now recognized as the best fault symptom, which can reflect the majority of character and scope of the failure in gears, bearings and shafting quickly and comprehensively. And there are a lot of advanced analytical methods to choose [2].
The main basis of vibration method is to analyze spectrum characteristics of vibration signal, to detect the existence of a certain frequency, and to determine whether there is certain failure or vibration component. Gearbox structure diagram is shown in Fig. 5.
Gearbox structure diagram.
The Fig. 5 shows that the gearbox has three levels of transmission. The first and second levels are planetary gear train, using internal gear transmission. The third level is parallel shaft system, using external gear transmission.
Z1 is 1st level number of sun wheel. Z2 is 1st level number of planet wheel. Z3 is 1st level number of ring gear. Z4 is the 2nd number of sun wheel. Z5 is 2nd level number of planet wheel. Z6 is 2nd level number of ring gear. Z7 is 3rd level number of big gear. Z8 is 3rd level number of small gear.
Meshing frequency is
Where
Transformation theory of gear train is
The sun wheel
The planet wheel Irotation speed is
The transmission ratio is
The Gear-mesh Frequency is
The sun wheel fault character frequency is
The planet wheel fault character frequency is
The ring gear fault character frequency is
The planet carrier in shaft frequency is
The sun wheel in shaft frequency is
The planet wheel rotation frequency is
The 2nd planet wheel structure is the same as the first stage. The 1st planet wheel is connected with the 2nd planet carrier. The ring gear is fixed. Calculation method is the same as the first planet wheel.
The 3rd Parallel shaft driving
The 3rd transmission ratio is
The total transmission ratio gearbox is
The output shaft speed is
The Gear-mesh Frequency is
The big gear fault characteristic frequency is
The small gear fault characteristic frequency is
The output shaft frequency is
Test of turbine rated speed is 14.28 r/m. Calculations of the gearbox fault characteristic frequency are shown in Tables 3 and 4.
Under the rated speed gearbox fault characteristic frequency
Under the rated speed parallel shaft gearbox fault characteristic frequency
Problem statement
In September 2011, a maintainer response reported the abnormal sound of No. 39 units in some wind field. This wind farm had operated normally for more than five years and maintained once half a year according to the rules, where the fault of wind unit occurred less [30]. The maintainer heard the abnormal sound like “dadada” in some unit, but the sound source location was difficult to judge. And the abnormal sound had obvious periodicity and was so loud that could be heard under the tower.
Fixed pitch stall wind generating set was installed in this wind field, whose main components were wind rotor, main bearing, gearbox, generator, main control system, yaw system, and etc. The comprehensive maintenance of the unit making the abnormal sound included loosing prevention of bolts, screws and other fasteners; injecting lubricating oil to the gearbox and generator to prevent poor lubrication, and checking the elastic support of the yaw system and gearbox, all of which were normal. Checking the gearbox and gear teeth of the parallel level in the back box by an endoscopy had found no abnormalities [19]. Due to the space limitations, former box had not been checked through the endoscopy.
During the startup of wind unit, the impact sound was relatively weak, but when the rotating speed of the generator passed 500 RPM, the sound was louder. With the increase of rotating speed, its interval became shorter. When the unit generated constantly, the interval remained constant, which was a periodic impact signal and frequency was about 5 Hz. It was shown that the abnormal sound derived from the rotating members. Through the sound positioning by the human ear, the preliminary judgment was that the impact sound came from the inside of the main bearing or gearbox [18].
Vibration test
According to test requirements of VDI3834, a vibration acquisition instrument was used to acquire the wind turbine data for a long time. Testing points located on the radial direction of the main shaft, input shaft, ring gear and high speed shaft of the gearbox, which were as closely as possible to the bearing support, shaft, and gear. For the testing points on the shaft, input shaft, and ring gear, the sampling frequency was 500 Hz and 10 min vibration was taken as the valid values for amplitude analysis during the filtration of 0.1 Hz–10 Hz because the rotating speed was slow. For the testing point on the high-speed shaft in the back gearbox, the 2000 Hz sampling frequency was used and 5 min vibration was taken as the valid values during the filtration of 10 Hz–2000 Hz. Testing time was the same as master time, so the measured vibration amplitude corresponded to the power. And the intensity of vibration under different power distribution could be known, so that the vibration of the unit compared with the same model in the amplitude [13, 15].
Wind turbines in sound and normal operation of the comparison
Wind turbines in sound and normal operation of the comparison
Gear ring vibration accelerated speed within 10 min rms scatter plot of the nos 39 and 40 unit.
Gearbox high-speed shaft vibration accelerated speed 5 min rms scatter plot of the nos 39 and 40 unit.
Respectively to acquire the data of the No. 39 unit and normal No. 40 unit, Figs 6 and 7 show the vibration amplitude comparison of testing points on radial direction of ring gear and high speed shaft of the gearbox. Because of the long testing time, the various wind conditions, and the influence of yawing, startup and stop, the testing data was discrete. The vibration amplitude of the normal No. 40 unit increased with the increased power and the stable vibration and the maximum vibration amplitude occurred within the power of 500–750 kW, while the vibration amplitude of No. 39 unit having the abnormal sound increased dramatically with the increase of power.
Table 5 is the virtual values’ statistics of measured data of each measuring point. It can be seen that the normal No. 40 unit are running in the regional? while for the fault No. 39 unit the low-frequency (0.1–10 Hz) vibration amplitude of gearbox is more than 0.5 m/s
The spectrum analysis of the main shaft and gearbox focused on looking for the abnormal sound source. There were all gear mesh frequencies in the spectrum of each measuring point in the gearbox [3, 27], including the mesh frequency of the ring gear and the planet gear (31 Hz) and its second harmonic generation, the mesh frequency of the sun gear and the planet gear (125 Hz) and its second harmonic generation, and high-speed-level mesh frequency (727 Hz), among which the mesh frequency of the sun gear and the planet gear (125 Hz) stood out .
The impact phenomenon existed in the time-domain waveform of the ring gear, which interval was about 0.19 s. As shown in Fig. 8, the frequency was about 5.26 Hz, and the rotating frequency of the sun gear shaft was 5.22 Hz close to the abnormal sound frequency of 5 Hz heard by human ears.
Gear ring of measuring points in the time domain waveform.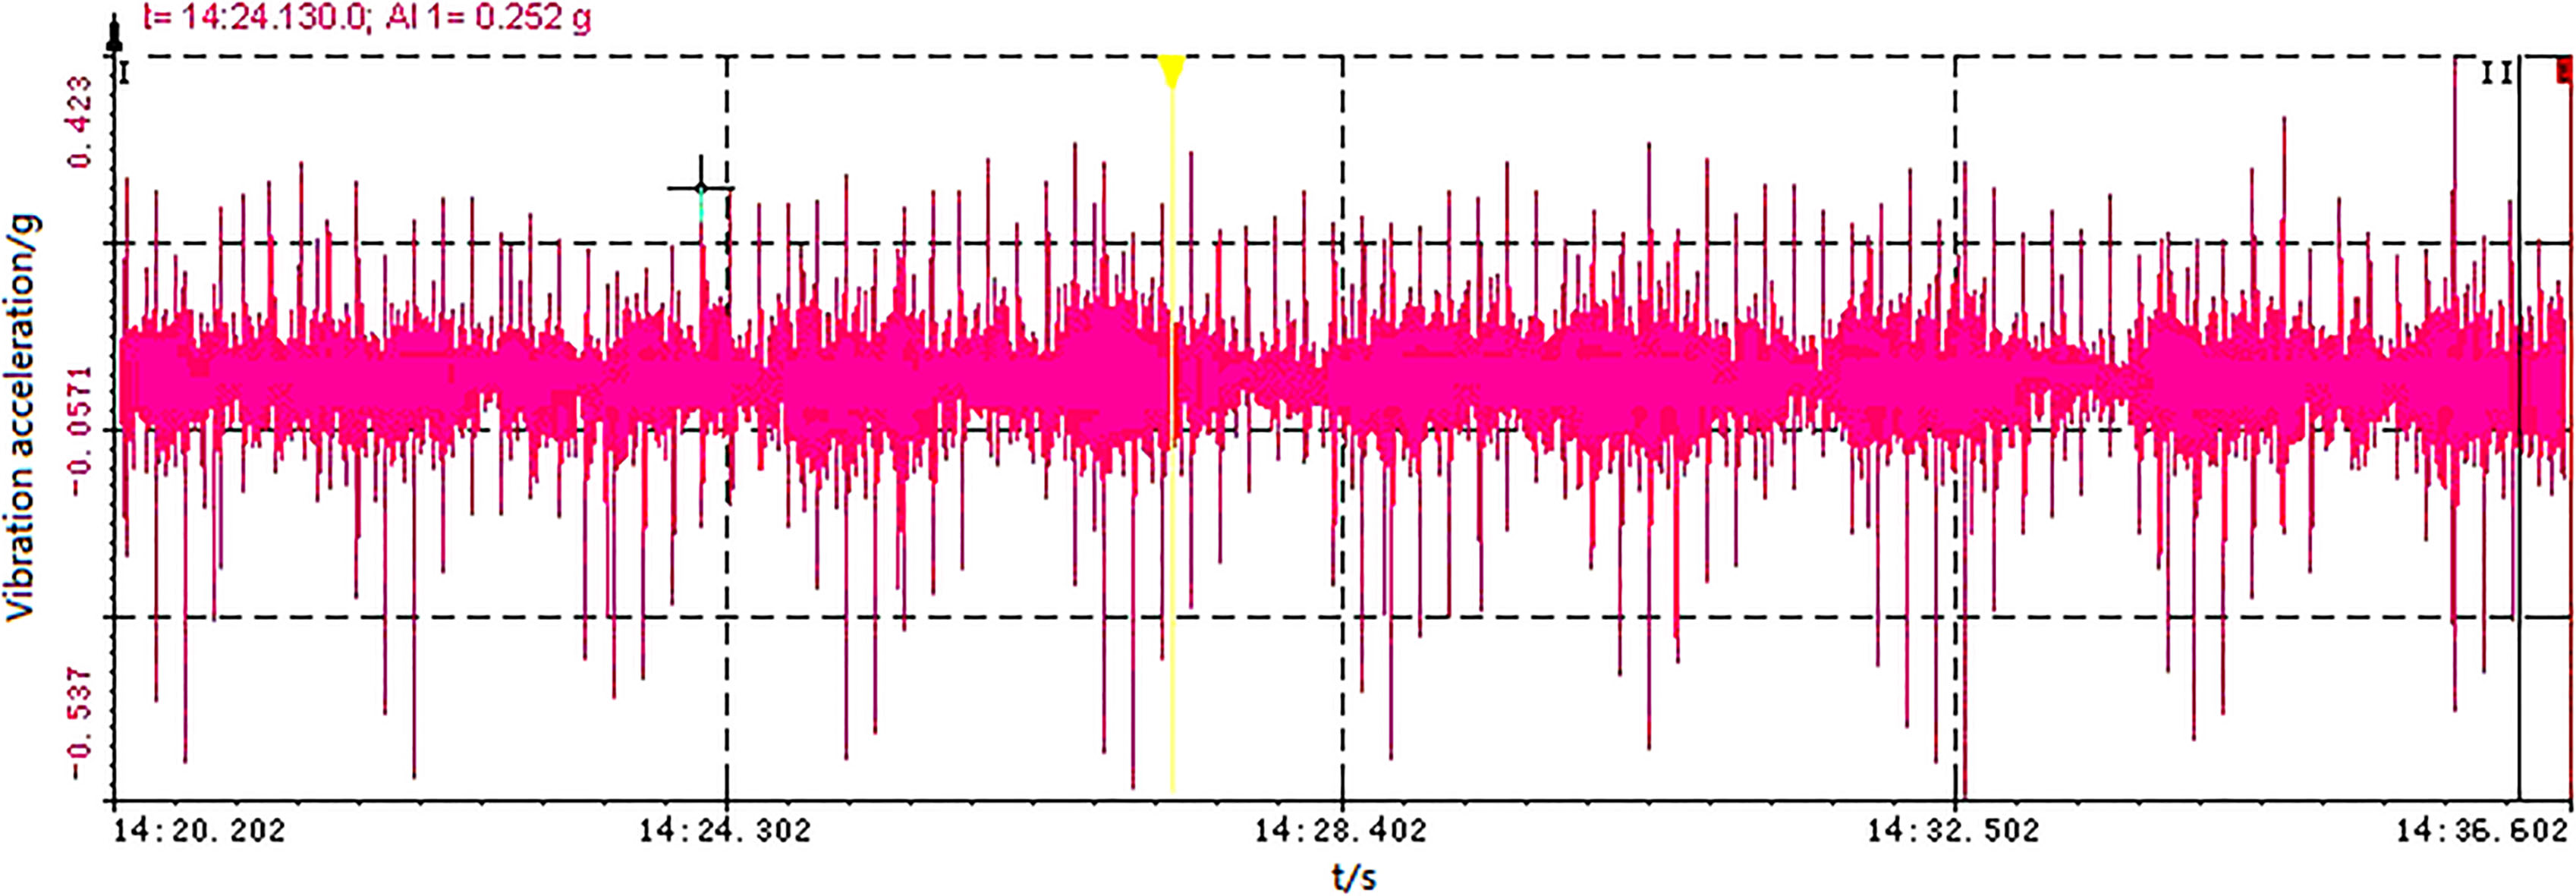
Higher harmonics of the sun wheel shaft rotating frequency (5.22 Hz) existed in the measuring point of the ring gear, which distributed from 0 to 250 Hz. The side frequency with the sun gear’s rotating frequency (5.2 Hz) for the side lobe lay on the meshing frequency of the sun gear and the planet gear (125 Hz). It was apparent that the modulation phenomenon occurred between the meshing frequency and the sun gear’s rotating frequency, as shown in Fig. 9, which showed that the sun gear teeth had high spot, wear or other serious faults.
Gear in the spectrum diagram of measuring points.
On one hand, the spectrum of the high-speed shaft in the Gearbox existed the outer-ring passing frequency of the high-speed front bearing (181 Hz), the second and third harmonic components [14]. On the other hand, the frequency had the side frequency with the high-speed shaft rotating frequency (25 Hz) for the side lobe. At the result, the modulation phenomenon between the outer-ring passing frequency of the high-speed front bearing and the high-speed shaft’s rotating frequency occurred, as shown in Fig. 10. According to the nine-stages division method of bearing failure, the bearing fault belonged to the fifth stage and the bearing should be replaced.
Gearbox high-speed shaft spectrum diagram of measuring points.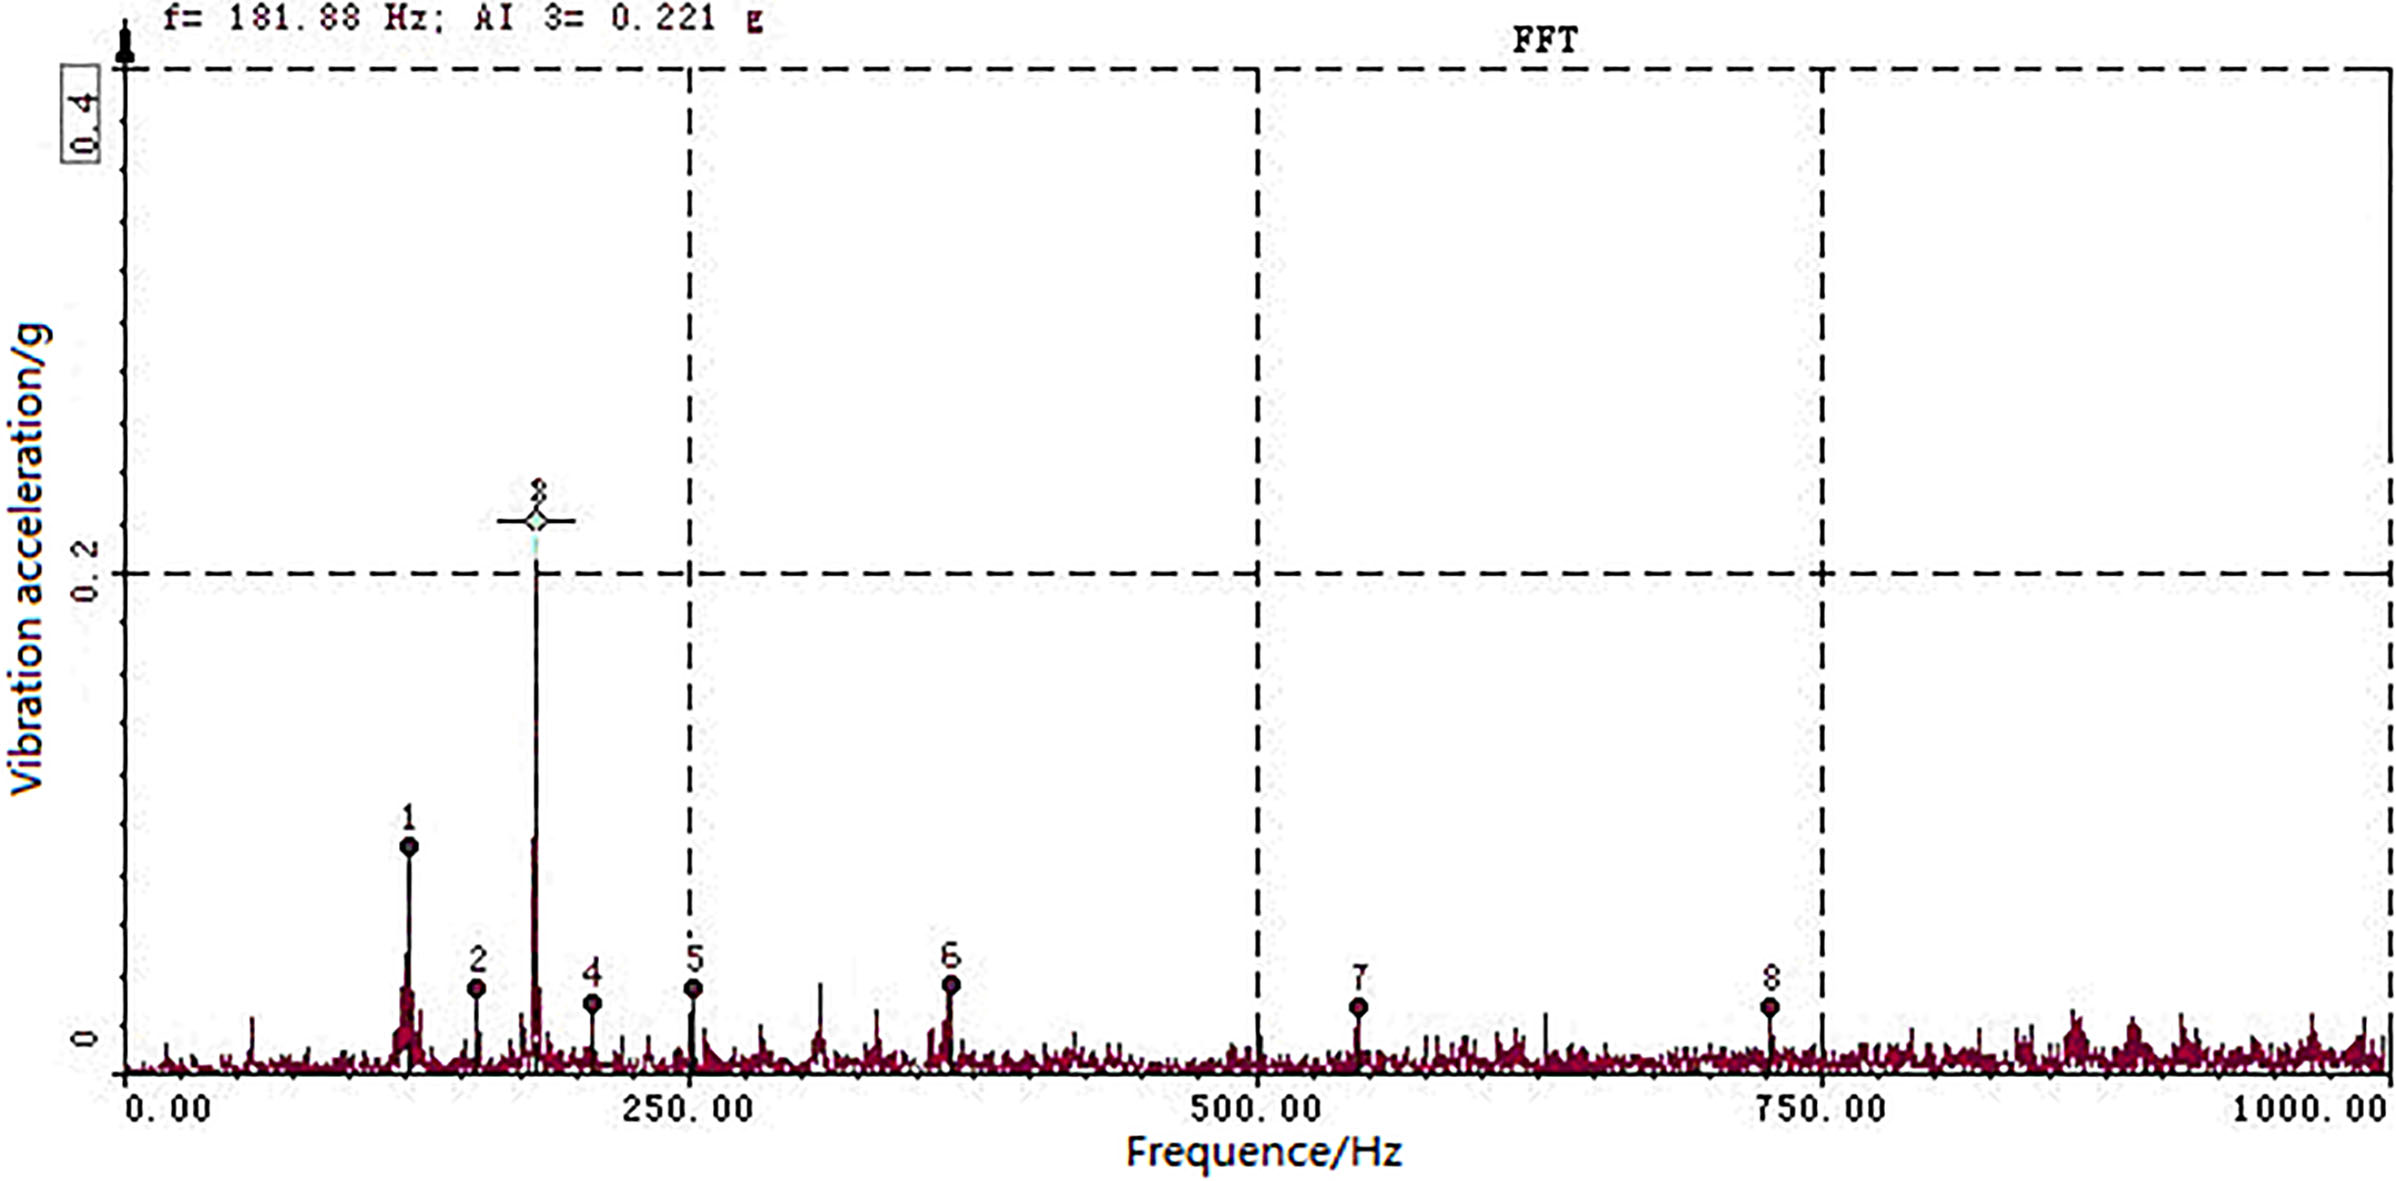
The sun wheel gear’s fault.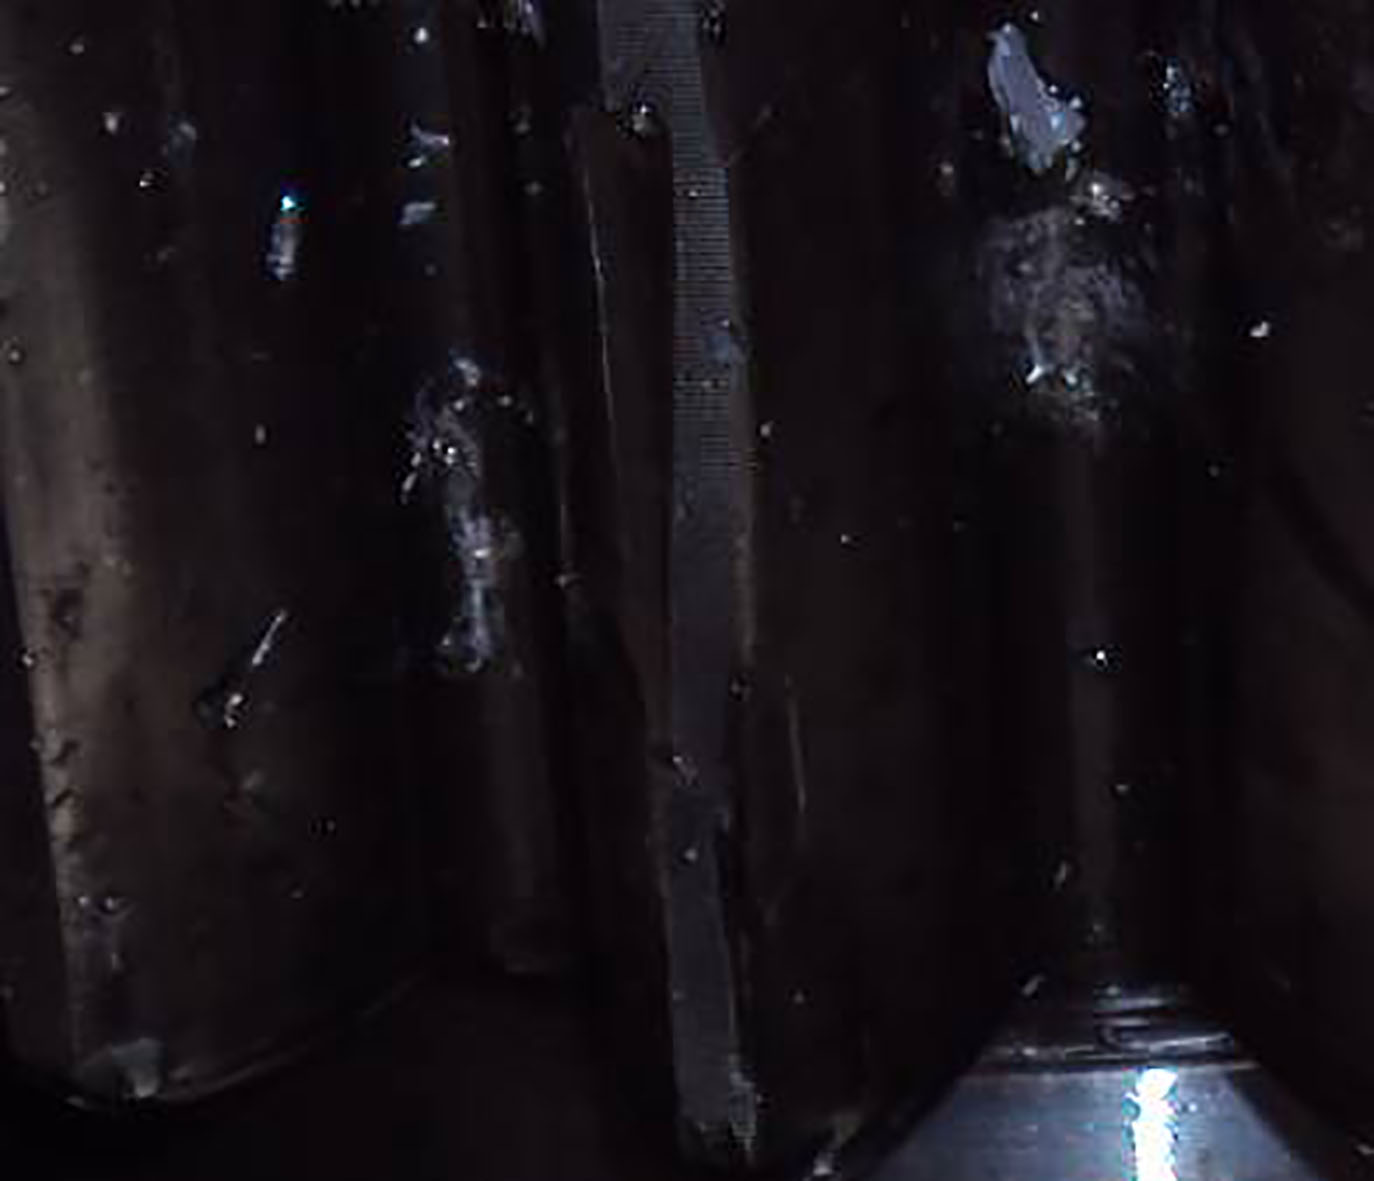
A large area of flaking in the outer ring of high-speed front shaft.
Gearbox at the bottom of corrosion phenomenon.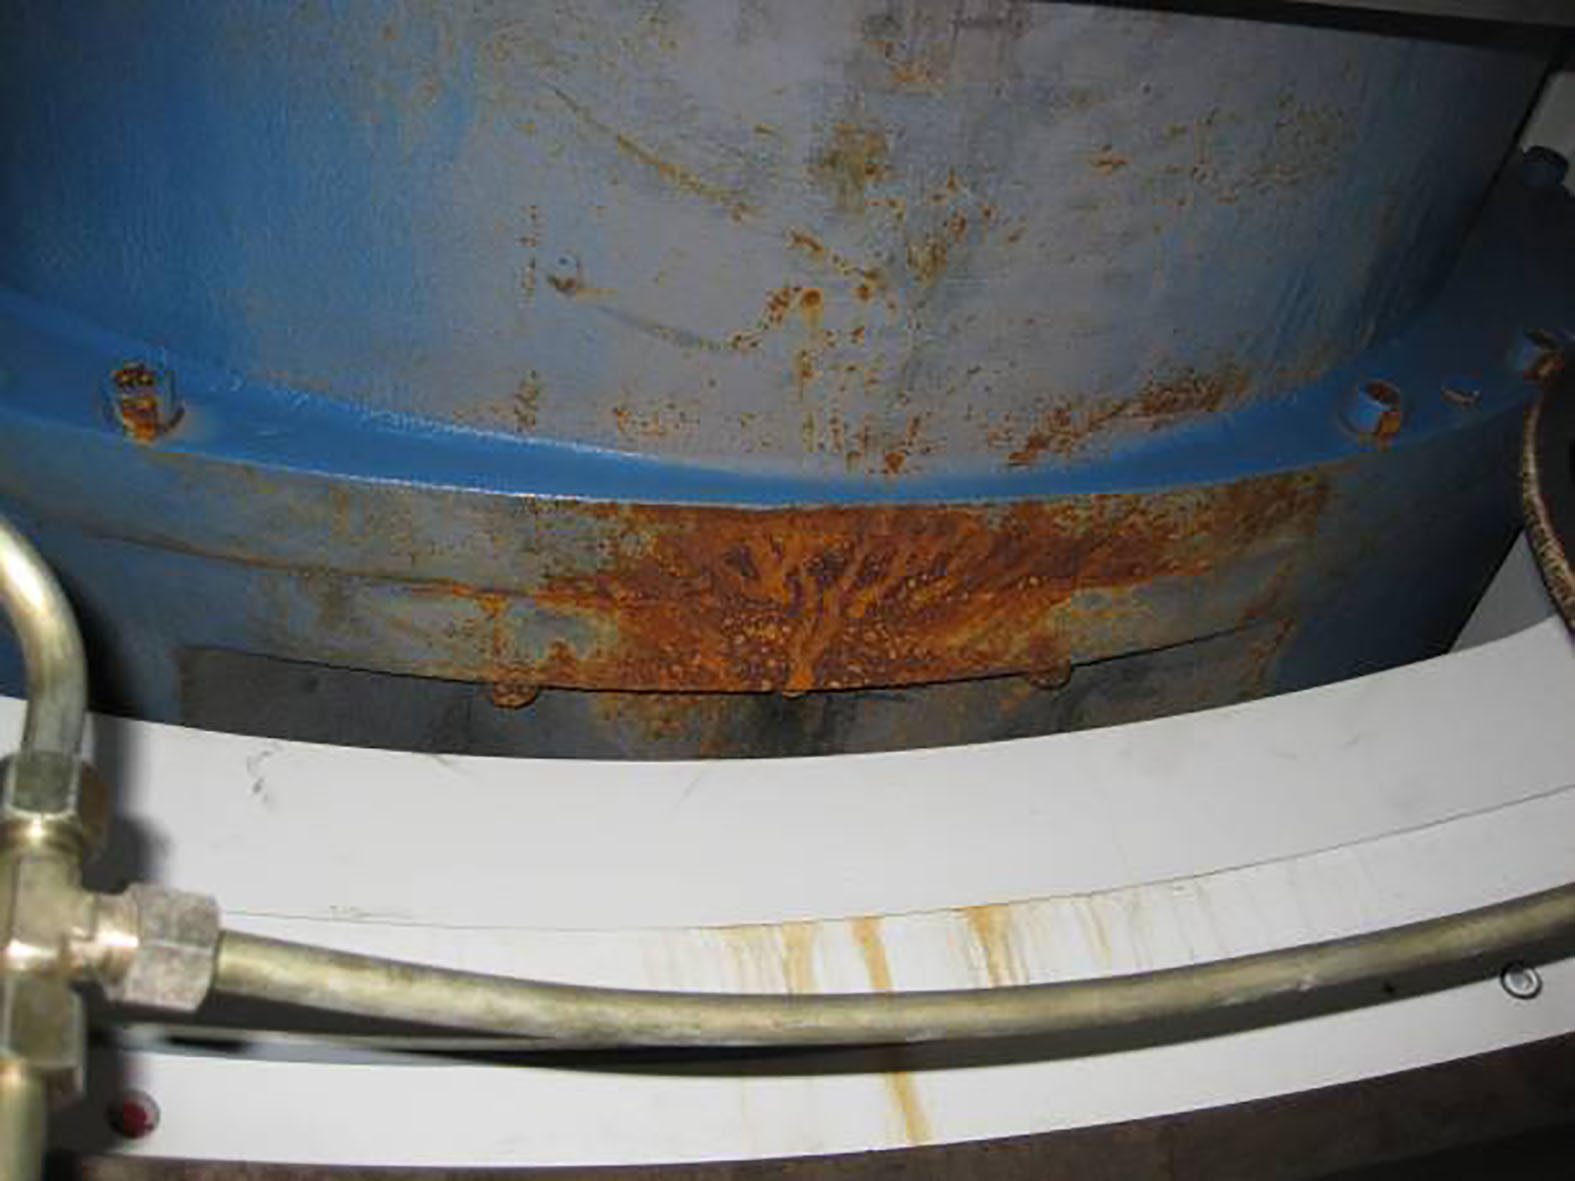
The checking results under the disassembly of gearbox coincided exactly with the above fault diagnosis results, in which the sun gear teeth had the crushed traces and had deformed, as shown in Fig. 11. There was a large area of flaking in the outer ring of high-speed front shaft, as shown in Fig. 12. As shown in Fig. 13, the gearbox bottom has certain corrosion phenomena.
After the replacement of the gearbox, the abnormal sound disappeared and through the vibration test [29], the vibration amplitude of the measuring point on the gearbox was decreased a lot as well as the one of the measuring point on the main shaft.
This article through to a wind field wind turbine gearbox fault diagnosis and analysis, through the gearbox oil spectral analysis, get the metal element Fe content is on the high side, shows that the system may be abnormal wear and tear. By analyzing the vibration amplitude of wind turbine gearbox test, the operation state of wind power unit can be accurately determined. Based on spectral analysis has been proved by experiments, and the vibration frequency spectrum analysis of wind turbine gearbox fault diagnosis method, the fault diagnosis can be not only accurate, avoid catastrophic accident, but also can save the maintenance costs.
With the deepening of the research work, the following problems need to be further studied and discussed.
The algorithm will be validated, evaluated and optimized by experimental test. As a result, an intelligent fault diagnosis system for wind turbine gearbox will be developed. The feature extraction method of vibration signal data processing and fault diagnosis will be studied. The commonality of fault diagnosis theory and method will be improved furthermore. The research of simple, rapid detection and diagnosis of gearbox early faults is a key part of the follow-up work.
Footnotes
Acknowledgments
This work was financially supported by the National Key Foundation for Exploring Scientific Instrument of China (2013YQ470767), Tianjin Science And Technology Committee for Science and Technology Development Strategy Research Project (15ZLZLZF00350), Tianjin Science and Technology Commissioner Project (16JCTPJC53000) and the 13th Five-Year Plan (2016-2020) of Science Education Project in Tianjin City (HE1017).
Conflict of interest
The authors declare no conflict of interest.