Most high-end manufacturing systems have implemented online inspection and control. However, fuzzy attribute indexes can’t be monitored online. The establishment of fuzzy quality control chart cannot be ignored on high-end manufacturing process. Because of this, based on Taguchi quality loss function, this paper is focusing on the question of monitoring and measuring process capability. Firstly, According to the characteristics of fuzzy quality attributes, the fundamental problem is to solve the distribution of fuzzy quality control chart. It is proposed that the beta distribution is the statistical basis of the fuzzy control chart. Secondly, fuzzy set distance indexes were constructed on fuzzy control chart, after analyzing the Beta distribution characteristics. Finally, the model of fuzzy control chart and the calculation of process capability are put forward based on Taguchi quality loss function. The results show that Taguchi quality loss function was effective in construction of fuzzy quality control chart to decide if process capability is under control or not. By calculation of production process datas, this paper provides policy implications for monitoring and control of fuzzy attribute on manufacturing process. Methodologically, this paper verified a way that transferring the form of product qualification ratio to that can be used in fuzzy control chart.
The objective of quality control is to monitor the production process. The On-line Test Technology can be used on most of the high-end manufacturing process, but fuzzy attribute indexes of high-end manufacturing process cannot be monitored or controlled on on-line, such as the ratio of the Standard Products which is fuzzy quality attribute index. The qualified rate could barely meet customer requirements. According to the theory of Taguchi quality loss function, the ratio of the standard products cannot stand for quality level completely. Closer the center of tolerance is, less the quality loss is, also higher the quality level is. So the rank of qualified products is the most characteristic index of fuzzy quality attribute [1].
The index of distance must be used to measure the distance from the center value, if fuzzy quality index can be controlled in the process. Further the distance is, larger the similarity index is, worse the product quality is. In contrary, closer the distance is, smaller the similarity index is, then better the product quality is. The fuzzy quality characteristic value is close to the statistical steady state, which is a kind of control chart based on fuzzy quality indicators for monitoring object index control chart. The range of similarity index is in [0, 1]. According to the random variation characteristics of index value, the study of this paper begins with the Beta distribution in the application of control chart.
Literature review
The Taguchi quality loss function
Taguchi (1961), who is a Japanese quality management expert, think that the quality of products and the quality loss are closely related, because the quality does not meet the requirements, and all the losses are caused by the producers, users and society. Taguchi used a monetary unit to measure the quality of the product. Greater the quality loss, worse the quality of the product is, smaller the quality loss is, better the quality of the product is [2].
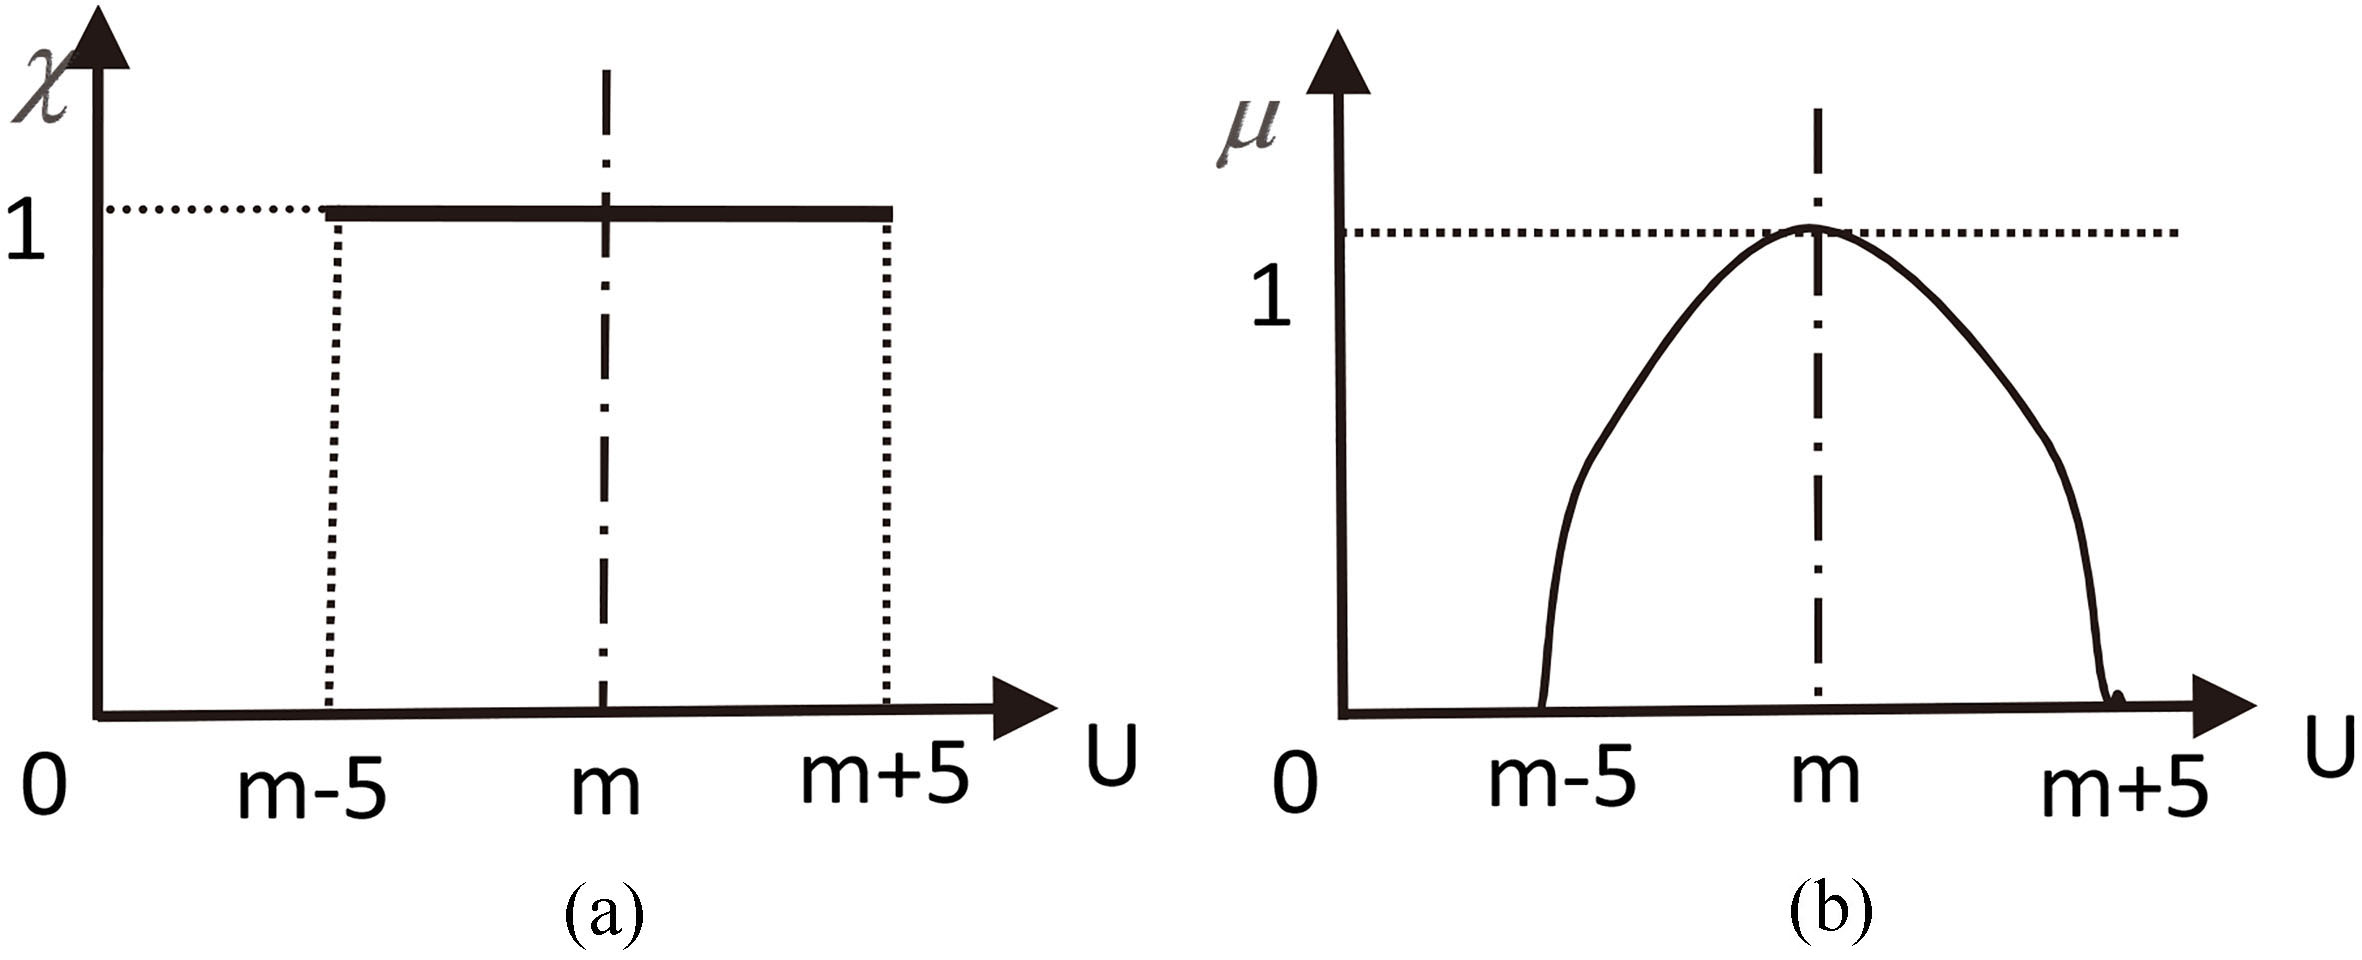
As an example, the color uniformity is a very sensitive quality index, we set as the basic specification in the design and the corresponding tolerance 5. According to the conformance quality standard, if the tolerance is in the range , it is qualified, otherwise, it is unqualified. In the Fig. 1a, there is the given conformity quality level. The value of presents “mutation” and “jump”, but in users’ feeling, it does not exist this artificial demarcation point. In the Fig. 1b, there is the applicability quality level. The value of presents a smooth curve in the range . Figure 2a and b are these two color uniformity characteristic value of the probability density curve.
(a) Conformity quality characteristics probability density; (b) Applicability quality characteristics probability density curve.
Comparing traditional conformance quality standard with these two probability density curve in Fig. 2a and b, we can see that the color uniformity characteristic values are uniform distributed in the range , and it does not classify qualified products. In Fig. 2b, most of the color uniformity characteristic values focus on around of , which point reflects a higher applicability. Therefore, in the view of applicable quality, the color uniformity presented by Fig. 2b, is significantly better than that presented in Fig. 2a. By further quantitative calculation, we also can quantitatively compare the difference between them as well [3].
The change form a sole “static point” to a continuous “qualified rate curve” reflects a more sophisticated method of quantity analysis for the quality standard [4].
Theory of fuzzy set distance
The fuzzy similarity is an important index which describes the similarity degree of two fuzzy sets [5]. Suppose fuzzy set referring to the standard products, and all samples form a fuzzy set . Assuming the subordinate functions of sets and were defined, we can calculate the fuzzy similarity of and , . is an actual number. Thus, we may transfer fuzzy mathematical information to actual values. The mathematical definition of is as follows:
Assuming is the algebra of domain , and , if , satisfying the conditions [6]:
then, is Similarity of fuzzy set and , is fuzzy Similarity function of . The value of fuzzy similarity is between [0, 1]. is closer to 0, the fuzzy set more similar to set . Otherwise, is closer to 1, the fuzzy set more different from set [7]. Depending on the actual status, we can flexibly construct a new similarity function in order to meet various requirements. When fuzzy similarity method is applied on quality control, quality fluctuation of the production process is reflected by the changes of fuzzy similarity indexes in a way [8].
Characteristics of Beta distribution
The characteristic of Beta distribution is that the range of random variables is (0, 1), such as Unqualified rate, market share [9]. The Beta distribution describes the quality characteristics, which not only reflects the form of the distribution of the quality characteristics in a unified form, but also describe the law of mass distribution accurately, which is better than the quality characteristics of the normal distribution. So Beta distribution is better than normal distribution for quality characteristics. The Beta distribution can approximate to a variety of symmetric and biase distributions including the normal distribution by adjusting the parameters [10].
The density function expression of the Beta distribution is as follows:
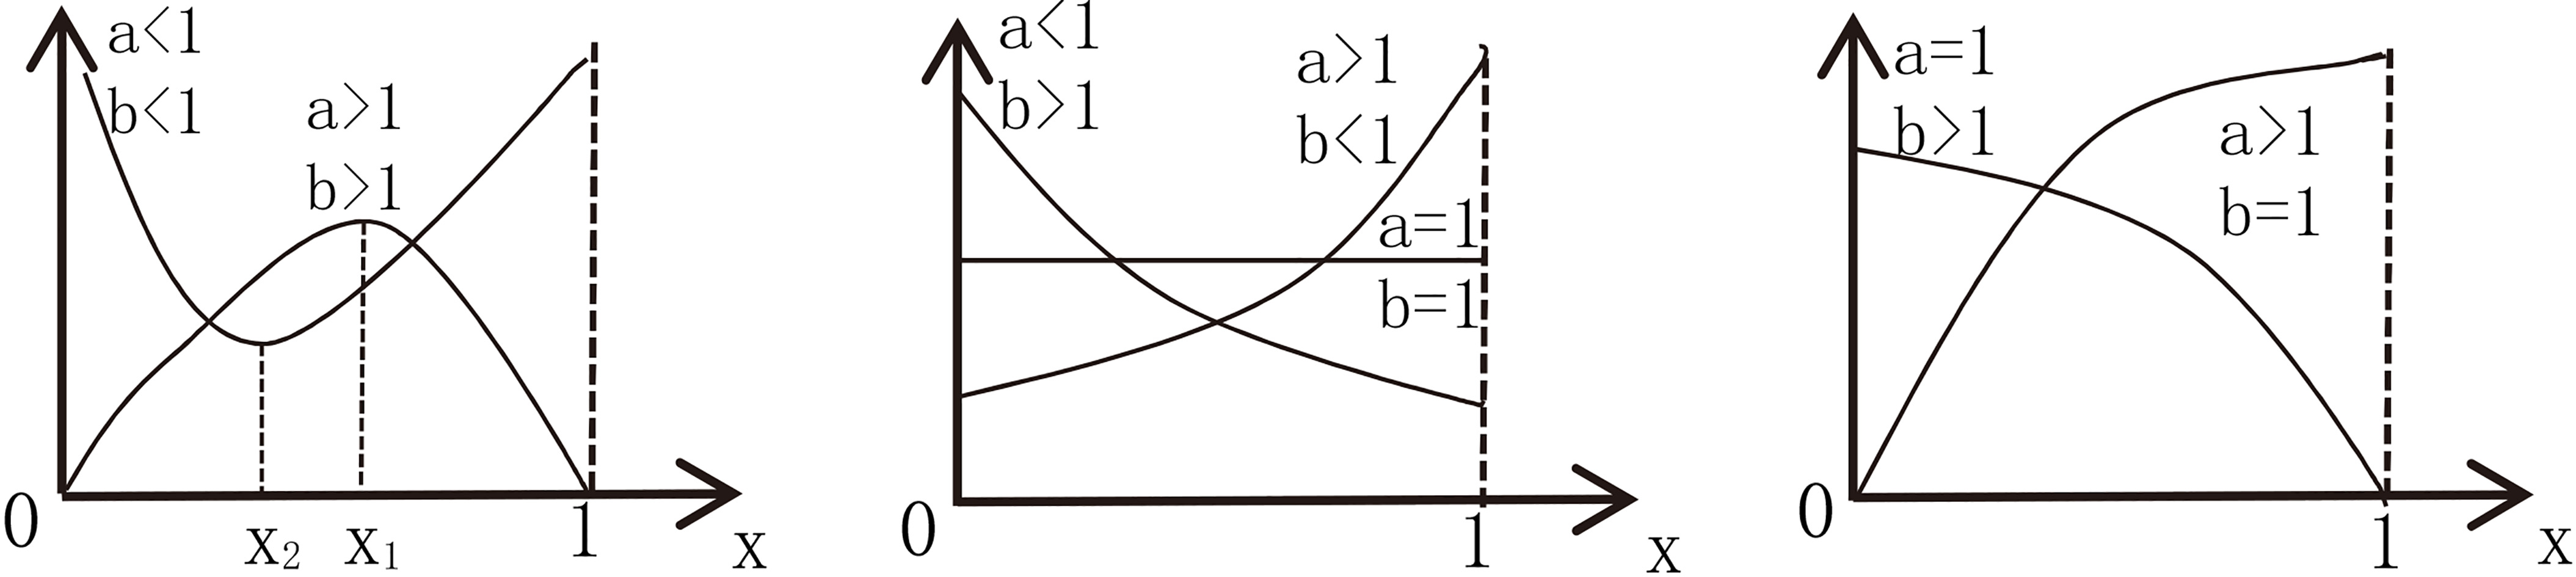
In Eq. (2), . When the distribution parameters and values are different, the density function curve of the Beta distribution has different characteristics, and the density function curve of the Beta distribution is shown in Fig. 3 [11].
The change of density function curve when parameters are taken from different values.
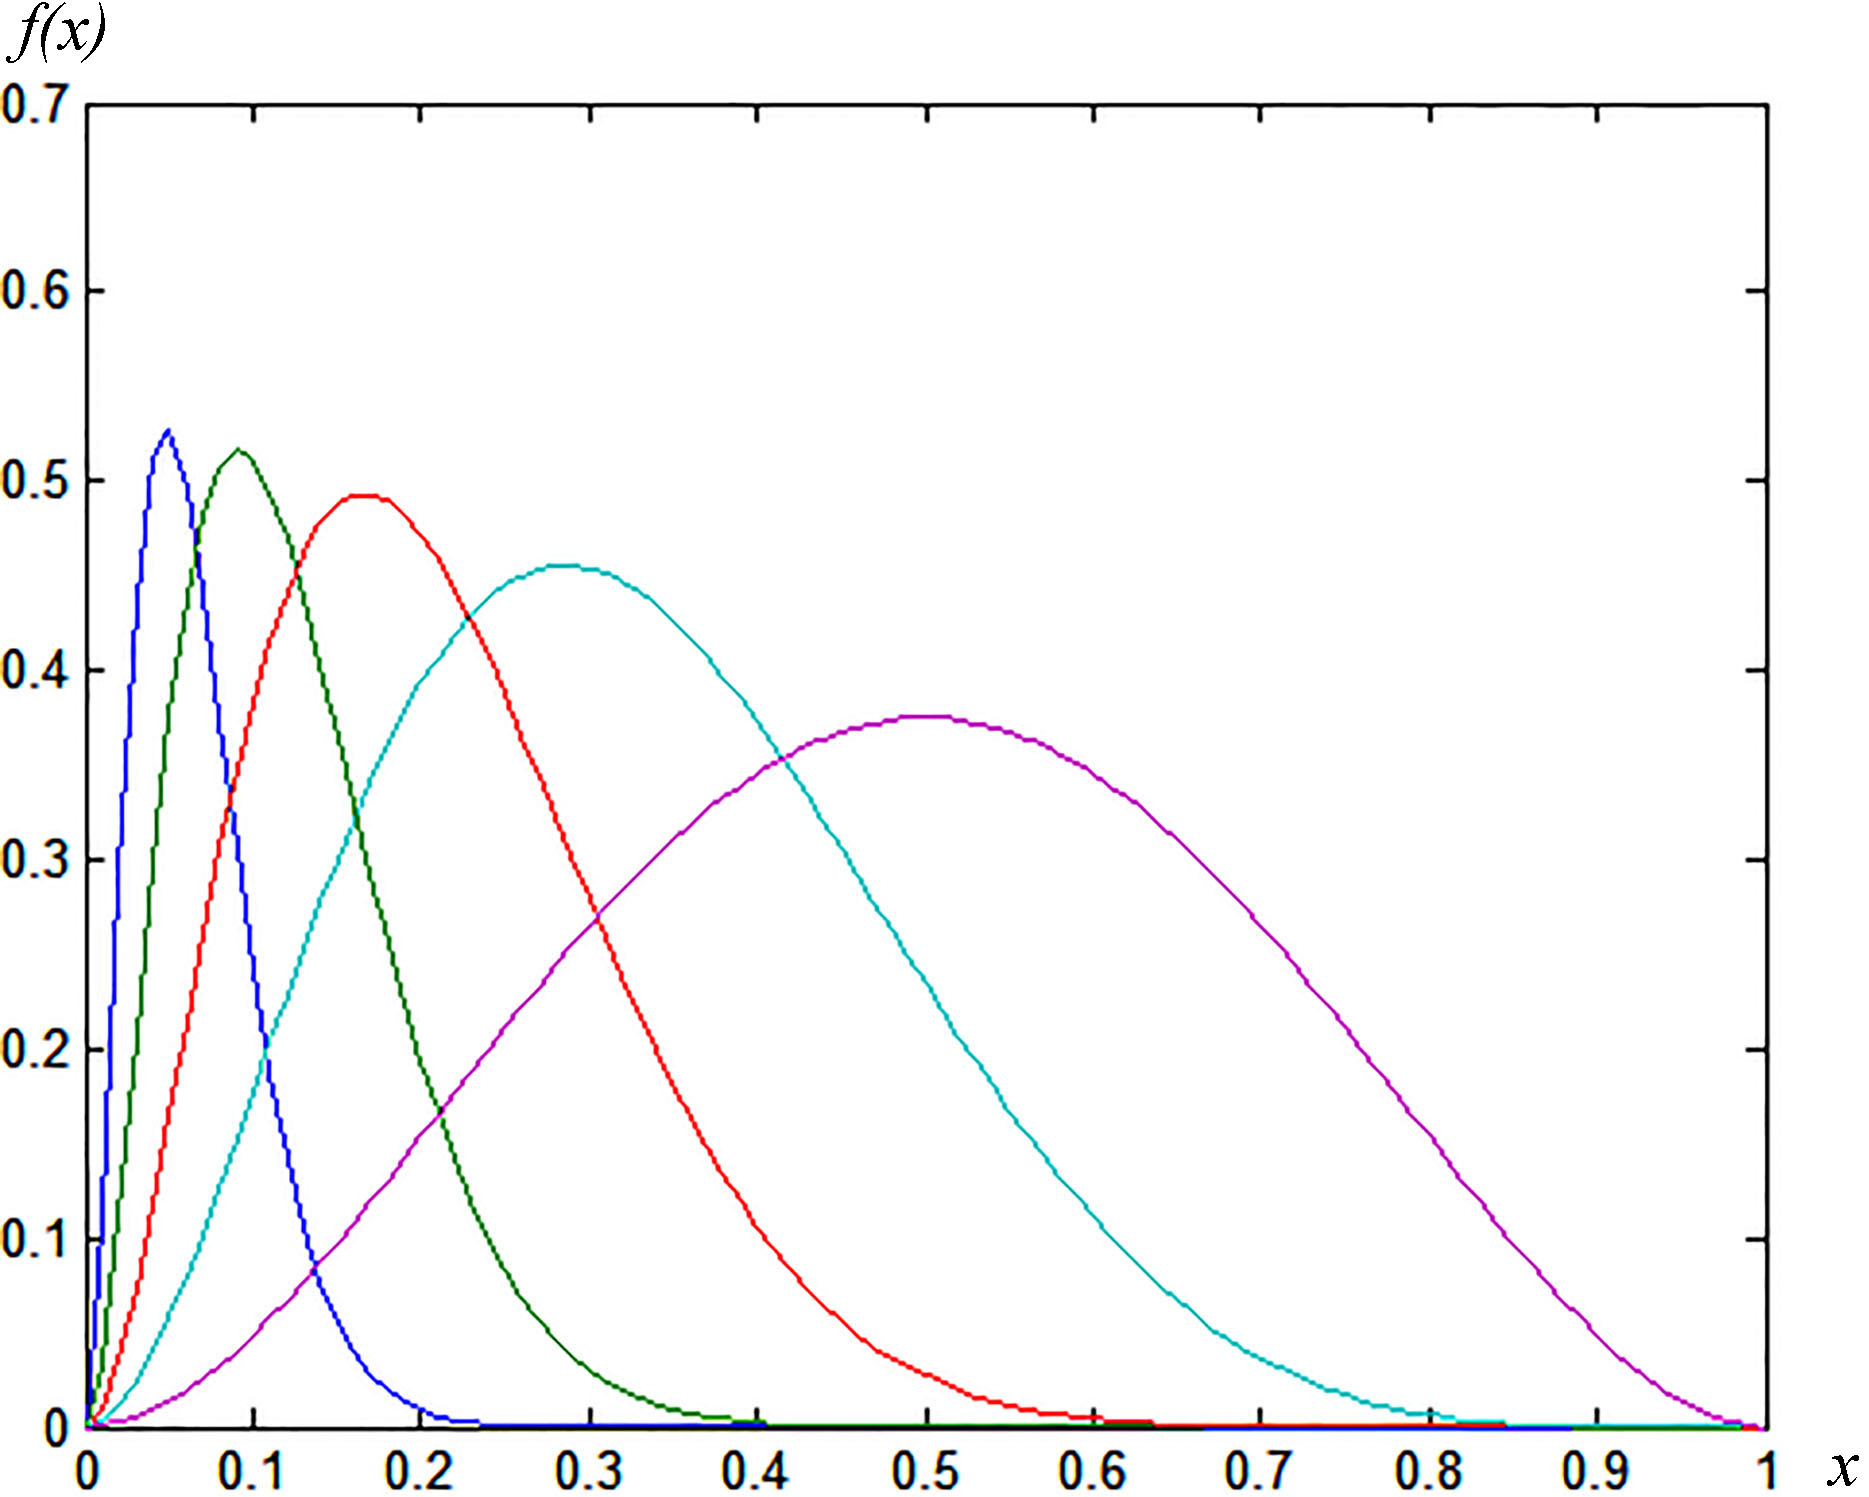
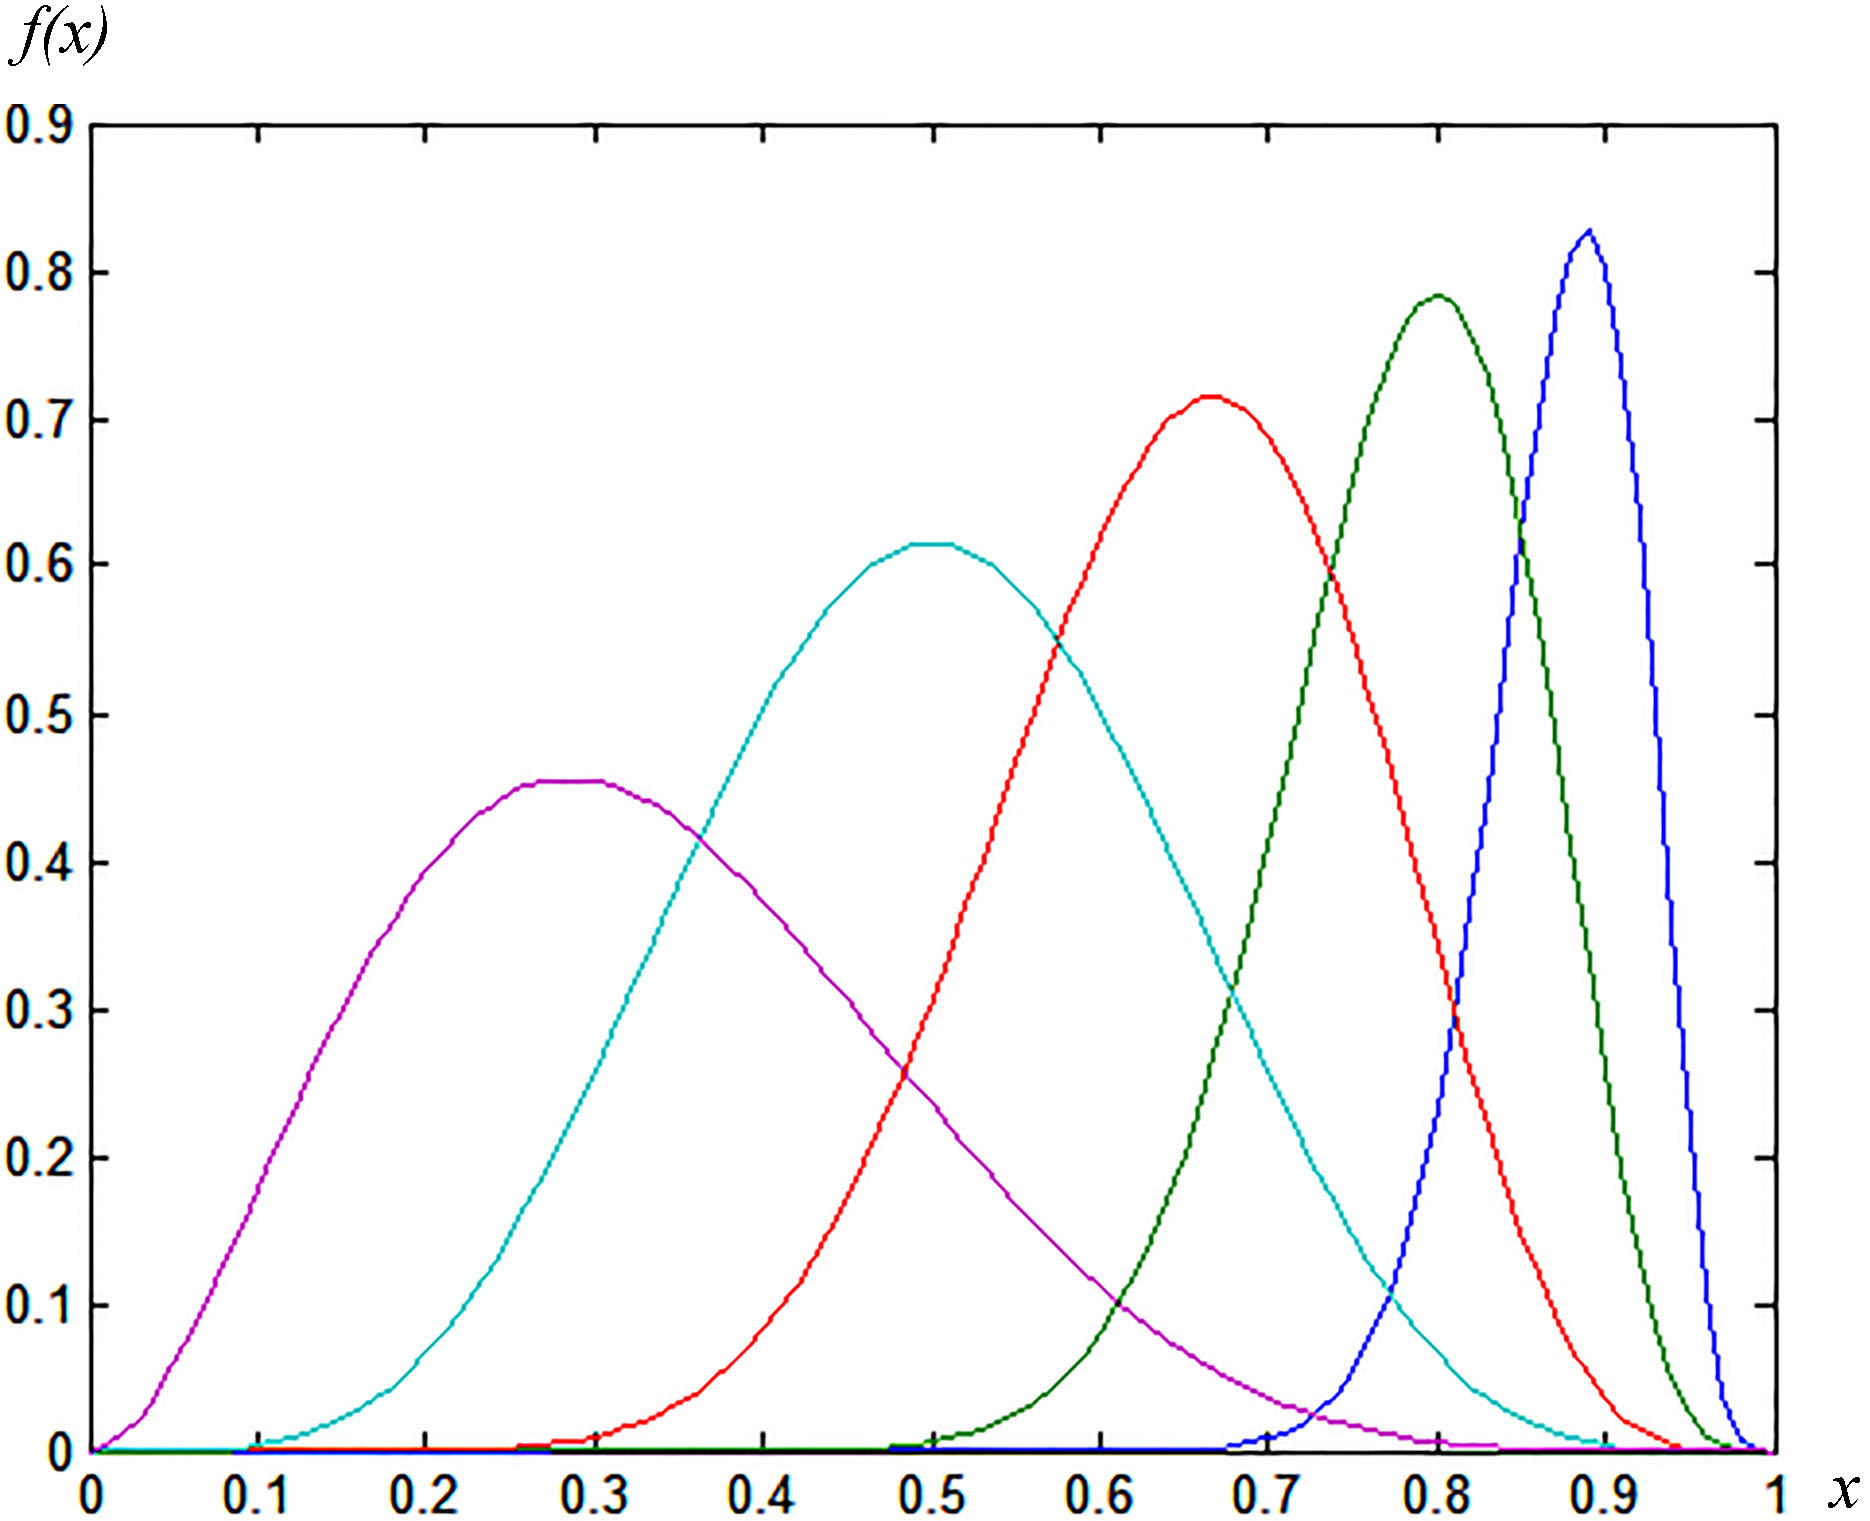
When the distribution of Beta is a single peak, it is more suitable to fit the random changes of the index of fuzzy set distance in this paper, and which is shown in Figs 4 and 5.
Distribution density function of Beta, ( 2, 40, 20, 10, 5, 2).
Distribution density function of Beta, ( 2, 5, 10, 20, 40, 5).
With the decrease of , the peak of the density function curve is moved to the right, and the function is reduced from the left deviation. With the decrease of , the peak is moved to the left, the function decreases from the right deviation and the kurtosis is smaller. When the parameters and are relatively small, the kurtosis is smaller and the variance is larger. When and are large, the kurtosis is larger and the variance is smaller. The changes reflect that the Beta distribution density function is symmetric on the parameters and [12]. Mathematical expectation of random variables in Beta distribution are shown below:
When , the mean of the overall distribution tends to be 0. When , the mean tends to be 1. When , the mean is 1/2.
Variance of random variables in Beta distribution are shown below:
It can be shown that the influence of the parameters and is equivalent, and the greater the sum of the variance, the smaller the variance of the overall distribution [13].
Skewness coefficient are shown below:
When , the skewness coefficient of the overall distribution is 0. When , , distribution is right-hand deviation. When , , which is left-hand deviation. The coefficient of skewness varies with and . Kurtosis coefficient are shown below:
It can be shown that the parameters and the influence on the kurtosis coefficient of the overall distribution are equivalent [14].
Research method
Simulation analysis of maximum likelihood estimation under Beta distribution
The foundation for control chart based on index of fuzzy set distance is to estimate the estimators of parameters and under Beta distribution. The samples , is taken from , the maximum likelihood function of the Beta distribution is be shown below [15]:
Using Matlab, random number can be generated under Beta distribution. When parameter of Beta distribution, 1.5 and 11, the sample statistics of parameters and are simulated, which are shown as Tables 1 and 2.
The sample statistics of parameter
Maximum likelihood
Mean
Median
Standard
Skewness
Kurtosis
Minimum
Maximum
Percentile
Percentile
estimation
value
deviation
coefficien
coefficient
0.315%
99.865%
20
1.7287
1.6090
0.5708
1.5539
7.7914
0.6782
7.6738
0.7676
5.1938
50
1.5811
1.5447
0.3028
0.8455
4.3924
0.8503
3.4798
0.9481
2.8317
100
1.5446
1.5267
0.2046
0.5875
3.7455
0.9887
2.6232
1.0571
2.3767
1000
1.5038
1.5021
0.0621
0.1909
3.1990
1.2734
1.7110
1.3252
1.6952
5000
1.5006
1.5004
0.0275
0.0564
2.9941
1.4080
1.6062
1.4187
1.5874
The sample statistics of parameter
Maximum likelihood
Mean
Median
Standard
Skewness
Kurtosis
Minimum
Maximum
Percentile
Percentile
estimation
value
deviation
coefficien
coefficient
0.315%
99.865%
20
13.0325
12.0722
4.8791
1.6519
8.4877
4.1770
57.4055
4.8654
42.4793
50
11.7322
11.4254
2.5736
0.9015
4.7306
5.5471
28.8579
6.4039
22.9363
100
11.3967
11.2301
1.7472
0.6111
3.7184
6.5815
21.6125
7.3421
18.3382
1000
11.0379
11.0258
0.5207
0.1857
3.1102
9.3383
113.3059
9.6009
12.7573
5000
11.0042
11.0033
0.2321
0.0839
3.0497
10.1359
11.9659
10.3329
11.7538
When the sample size is large ( 5000), based on order statistics of the maximum likelihood estimation method, the gap between Mean and median of sample estimates, and the parameter and is very small. It is proved that the maximum likelihood estimation based on the order statistics is better. It means that the random changes of fuzzy set distance index can be described by the Beta distribution.
Analysis of quality control chart under Beta distribution
The statistics of fuzzy quality chart can be derived from of Beta distribution. If and is independent, Joint distribution function is shown as below:
In for Eq. (9), and is a certain constant, then it is be verified that the Simulation of and is shown in Table 3. The overall distribution is Beta (1.5, 11), and the amount of the simulated subsample is 50, modeling 10000 times.
The value of , and
C 0.09
C 0.10
C 0.11
C 0.12
C 0.13
C 0.14
C 0.15
0.05
0.0012
0.0038
0.0044
0.0049
0.0049
0.0049
0.0049
0.0049
0.06
0.0037
0.0195
0.0442
0.0561
0.0586
0.0588
0.0588
0.0588
0.07
0.0047
0.0394
0.1366
0.2263
0.2616
0.2696
0.2707
0.2708
0.08
0.0052
0.0458
0.1986
0.4073
0.5463
0.5881
0.5949
0.5958
0.09
0.0053
0.0474
0.2166
0.4942
0.7327
0.8296
0.8527
0.8554
0.10
0.0053
0.0474
0.2188
0.5125
0.7854
0.9213
0.9616
0.9679
0.11
0.0053
0.0474
0.2190
0.5146
0.7931
0.9378
0.9860
0.9949
0.0053
0.0474
0.2190
0.5148
0.7937
0.9396
0.9898
In Table 3, it is be shown that . According to the principle of Shewhart control chart, the control chart of and are determined in steady state at the same time, the production process is controlled in statistic stability. There is an exception both the control charts, and it is abnormal. Another control chart is no longer available even if there is no exception. The process must be readjusted until the two chart are in steady state at the same time.
From the above results, by using the principle of the Shewhart control chart [16], the center line and the control limit of control chart are shown as:
Similarly, the center line and the control limit of control chart are shown as:
Under Beta (1.5, 11), the amount of the simulated subsample is 50, modeling 10000 times. The change of the Statistic and are shown in Figs 4 and 5.
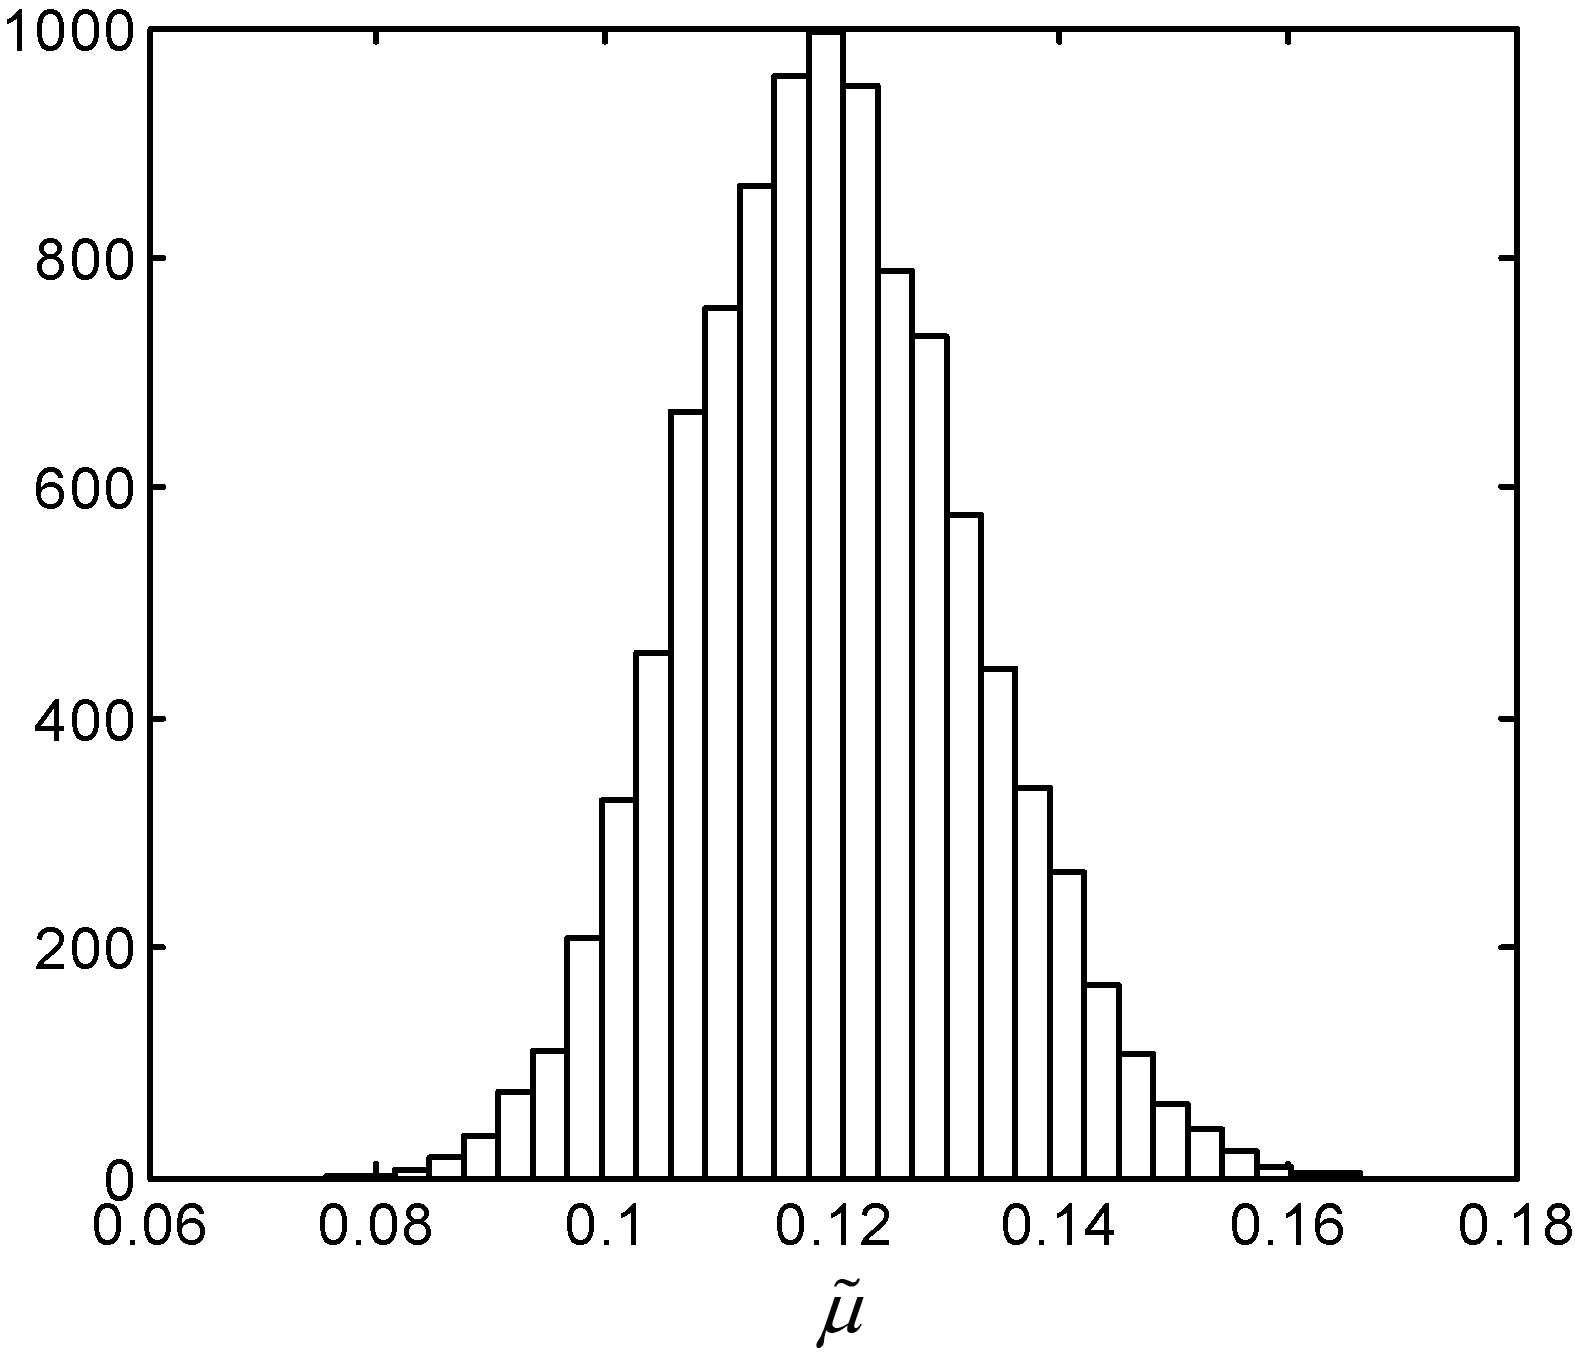
Frequency histogram of .
Frequency histogram of .
In the Figs 6 and 7, the median of mean estimators is 0.1196 and the median of variance estimators is 0.0871. In Beta (1.5, 11), 0.12 and 0.0884. It is slightly smaller than the true value of the parameter. The 99.865% and 0.135% quantiles of mean estimators are respectively 0.1576 and 0.0862. The 99.865% and 0.135% quantiles of variance estimators are respectively 0.1256 and 0.0564. When the process in steady state, the index of fuzzy set distance obeying Beta (1.5, 11). Generating 10000 sets random number, each subgroup is . Then 10000 estimators of and can be calculated separately, and a run length of control chart and can also be calculated. Only when the process is abnormal, the ARL of control chart is obviously less than ARL (0) in steady state.
Optimized analysis on process capability based on lose of product quality
According Boyles (2002) and Hubele (2006), it is restrictive to analyze process capability by single process capability index, more considerations need to get involved [17]. According to the content of research, different values of and have significant reflection on process capability. Thus, the method of analyzing process capability from Hubele (2004) and the method of optimized analysis on process capability from Flaig (2010) can be used for reference [18].
Under the Asymmetric quality loss function given by Li and Chou (2001)
In this Equation, , . is the quality loss at the lower limit of common difference. is the quality loss at the upper limit of common difference. Obviously, in the common situation of asymmetric common difference, . For the situation that fuzzy set distance follows distribution, the average quality loss is [19]:
Obviously, the lower the average quality loss is, the better the process capability is. In Eq. (13), is constant, the value of is determined by and from . In other words, it is determined by mean value and standard deviation . In Eq. (12), the value of should approach which is the ideal value of fuzzy set distance. Ideally, and should equal. Then, when decreases, decreases. The relationship among , , and is shown in Eq. (14) [20].
When , . Then as and decrease, also decreases. When , get the Equation below.
In Eq. (15), . Under the consideration of Eq. (14), can be transformed into the function of and . Due to the complexity of function calculation, the relationship is shown in Fig. 8.
In Fig. 8, as and decreases, decreases. In addition, the marginal impact of average quality loss decline is similar.
Optimized analysis on process capability based on product value
Based on Taguchi quality loss function, product value can be seen as the level of process capability. In other words, the higher the product value is, the higher the level of process capability is. The function of product value is shown below [21].
In Eq. (16), and is constant. Thus, and of determine the value of . In other words, and determine the value of . So, in order to get higher product value, some effects should be taken on and . The get the following Equation [22].
In Eq. (17), then . Under the consideration of Eq. (17), can be transformed into the function of and . This function is shown in Fig. 9.
In Fig. 9, as decreases, decreases. When decreases, increases. The margin impact of product value by decline of is larger than the margin impact of product value by decline of . Although, their order of magnitude are different. Under the effect of and , in asymmetric deviation the level of quality improvement under the change of is higher than the level of quality improvement under the change of .
The sample data of high-end manufacturing process
Serials
Number of
Number of
Number of
Number of
Number of
standard class
secondary class
third class
inferior class
samples
1
121
46
14
5
186
2
130
51
16
7
204
3
145
48
18
8
129
4
139
37
23
4
213
5
109
61
29
3
202
6
98
29
40
11
188
7
85
44
8
10
157
8
105
78
11
9
203
9
118
58
10
8
194
10
140
79
28
7
254
11
110
64
25
8
197
12
136
49
12
6
203
13
130
45
19
5
199
14
115
35
15
12
177
15
120
25
27
10
182
16
139
68
8
2
157
17
106
75
31
3
215
18
140
51
35
6
232
19
125
23
18
12
178
20
118
39
26
15
198
21
127
18
19
5
169
22
167
55
17
9
248
23
150
70
19
7
246
24
181
33
9
6
229
25
117
28
31
11
187
26
130
35
23
31
219
27
167
39
21
2
229
28
85
41
26
17
179
29
129
58
10
15
212
30
110
61
20
7
198
Results and discussion
Calculation case
The data are from real high-end manufacturing process. This company’s products are classified by the quality experts at four levels: Standard class (no defect or only one invisible small defect), Second class (only one visible small defect and do not affect the use), Third class (only one visible big defect and do not affect the use), Inferior class (existing defect and affect the use).
In the production process, the data in per pried of half hour will be gathered, and the samples number of inspection is variable. An example date list as follow.
In the case, there are four product classes. The closest to the center value which represents the optimal product quality is Standard classes. The index of distance must be used to measure the distance from the center value as fuzzy quality index. The fuzzy quality characteristic value is close to the statistical steady state, which is a kind of control chart based on fuzzy quality indicators for monitoring object index control chart. The normal distribution is not applicable, if the control chart is used to monitor the process. The Beta distribution is applicable in the application of control chart.
To transfer these classified dates to indexes of the fuzzy similarity, we firstly set four quality classes (standard class, secondary class, third class, inferior class) respectively corresponding to four sections of fuzzy similarity index: [0, 0.25], [0.25, 0. 5], [0.5, 0.75], [0.75, 1]. Moreover, we also set the fuzzy similarity indexes conforming to the uniform distribution. Based on above conditions, we can apply these dates to estimate the parameters of the Beta distribution, establish the fuzzy similarity control chart for and .
Based on the weights of the range data, and of the every sample can be evaluated, and the formulas are as follows:
In these, are frequencies of various categories products in every sample, then the formulas can be simplified:
According to above function, we can calculate and. The result is listed as following.
and of closeness index on Porcelain product
Samples
Samples
1
0.235623
0.193874
16
0.255863
0.183472
2
0.297324
0.203840
17
0.292247
0.204648
3
0.224609
0.218474
18
0.237485
0.183589
4
0.250001
0.194748
19
0.203788
0.214648
5
0.252376
0.224243
20
0.217831
0.204758
6
0.204723
0.203764
21
0.262238
0.214855
7
0.273271
0.235758
22
0.257134
0.234658
8
0.351093
0.189664
23
0.294427
0.194748
9
0.251200
0.214758
24
0.241359
0.204794
10
0.263780
0.264264
25
0.230967
0.217985
11
0.273633
0.194764
26
0.211738
0.224637
12
0.214529
0.225754
27
0.27837
0.189581
13
0.292389
0.194648
28
0.237846
0.204648
14
0.243261
0.204783
29
0.212734
0.225759
15
0.283680
0.215324
30
0.264327
0.194758
control chart and control chart. Based on and listed above, we use the data to calculate centerline, upper control limits and lower control limits of chart and chart. The calculate centerline, upper control limits and lower control limits for control chart:
The calculate centerline, upper control limits and lower control limits for control chart:
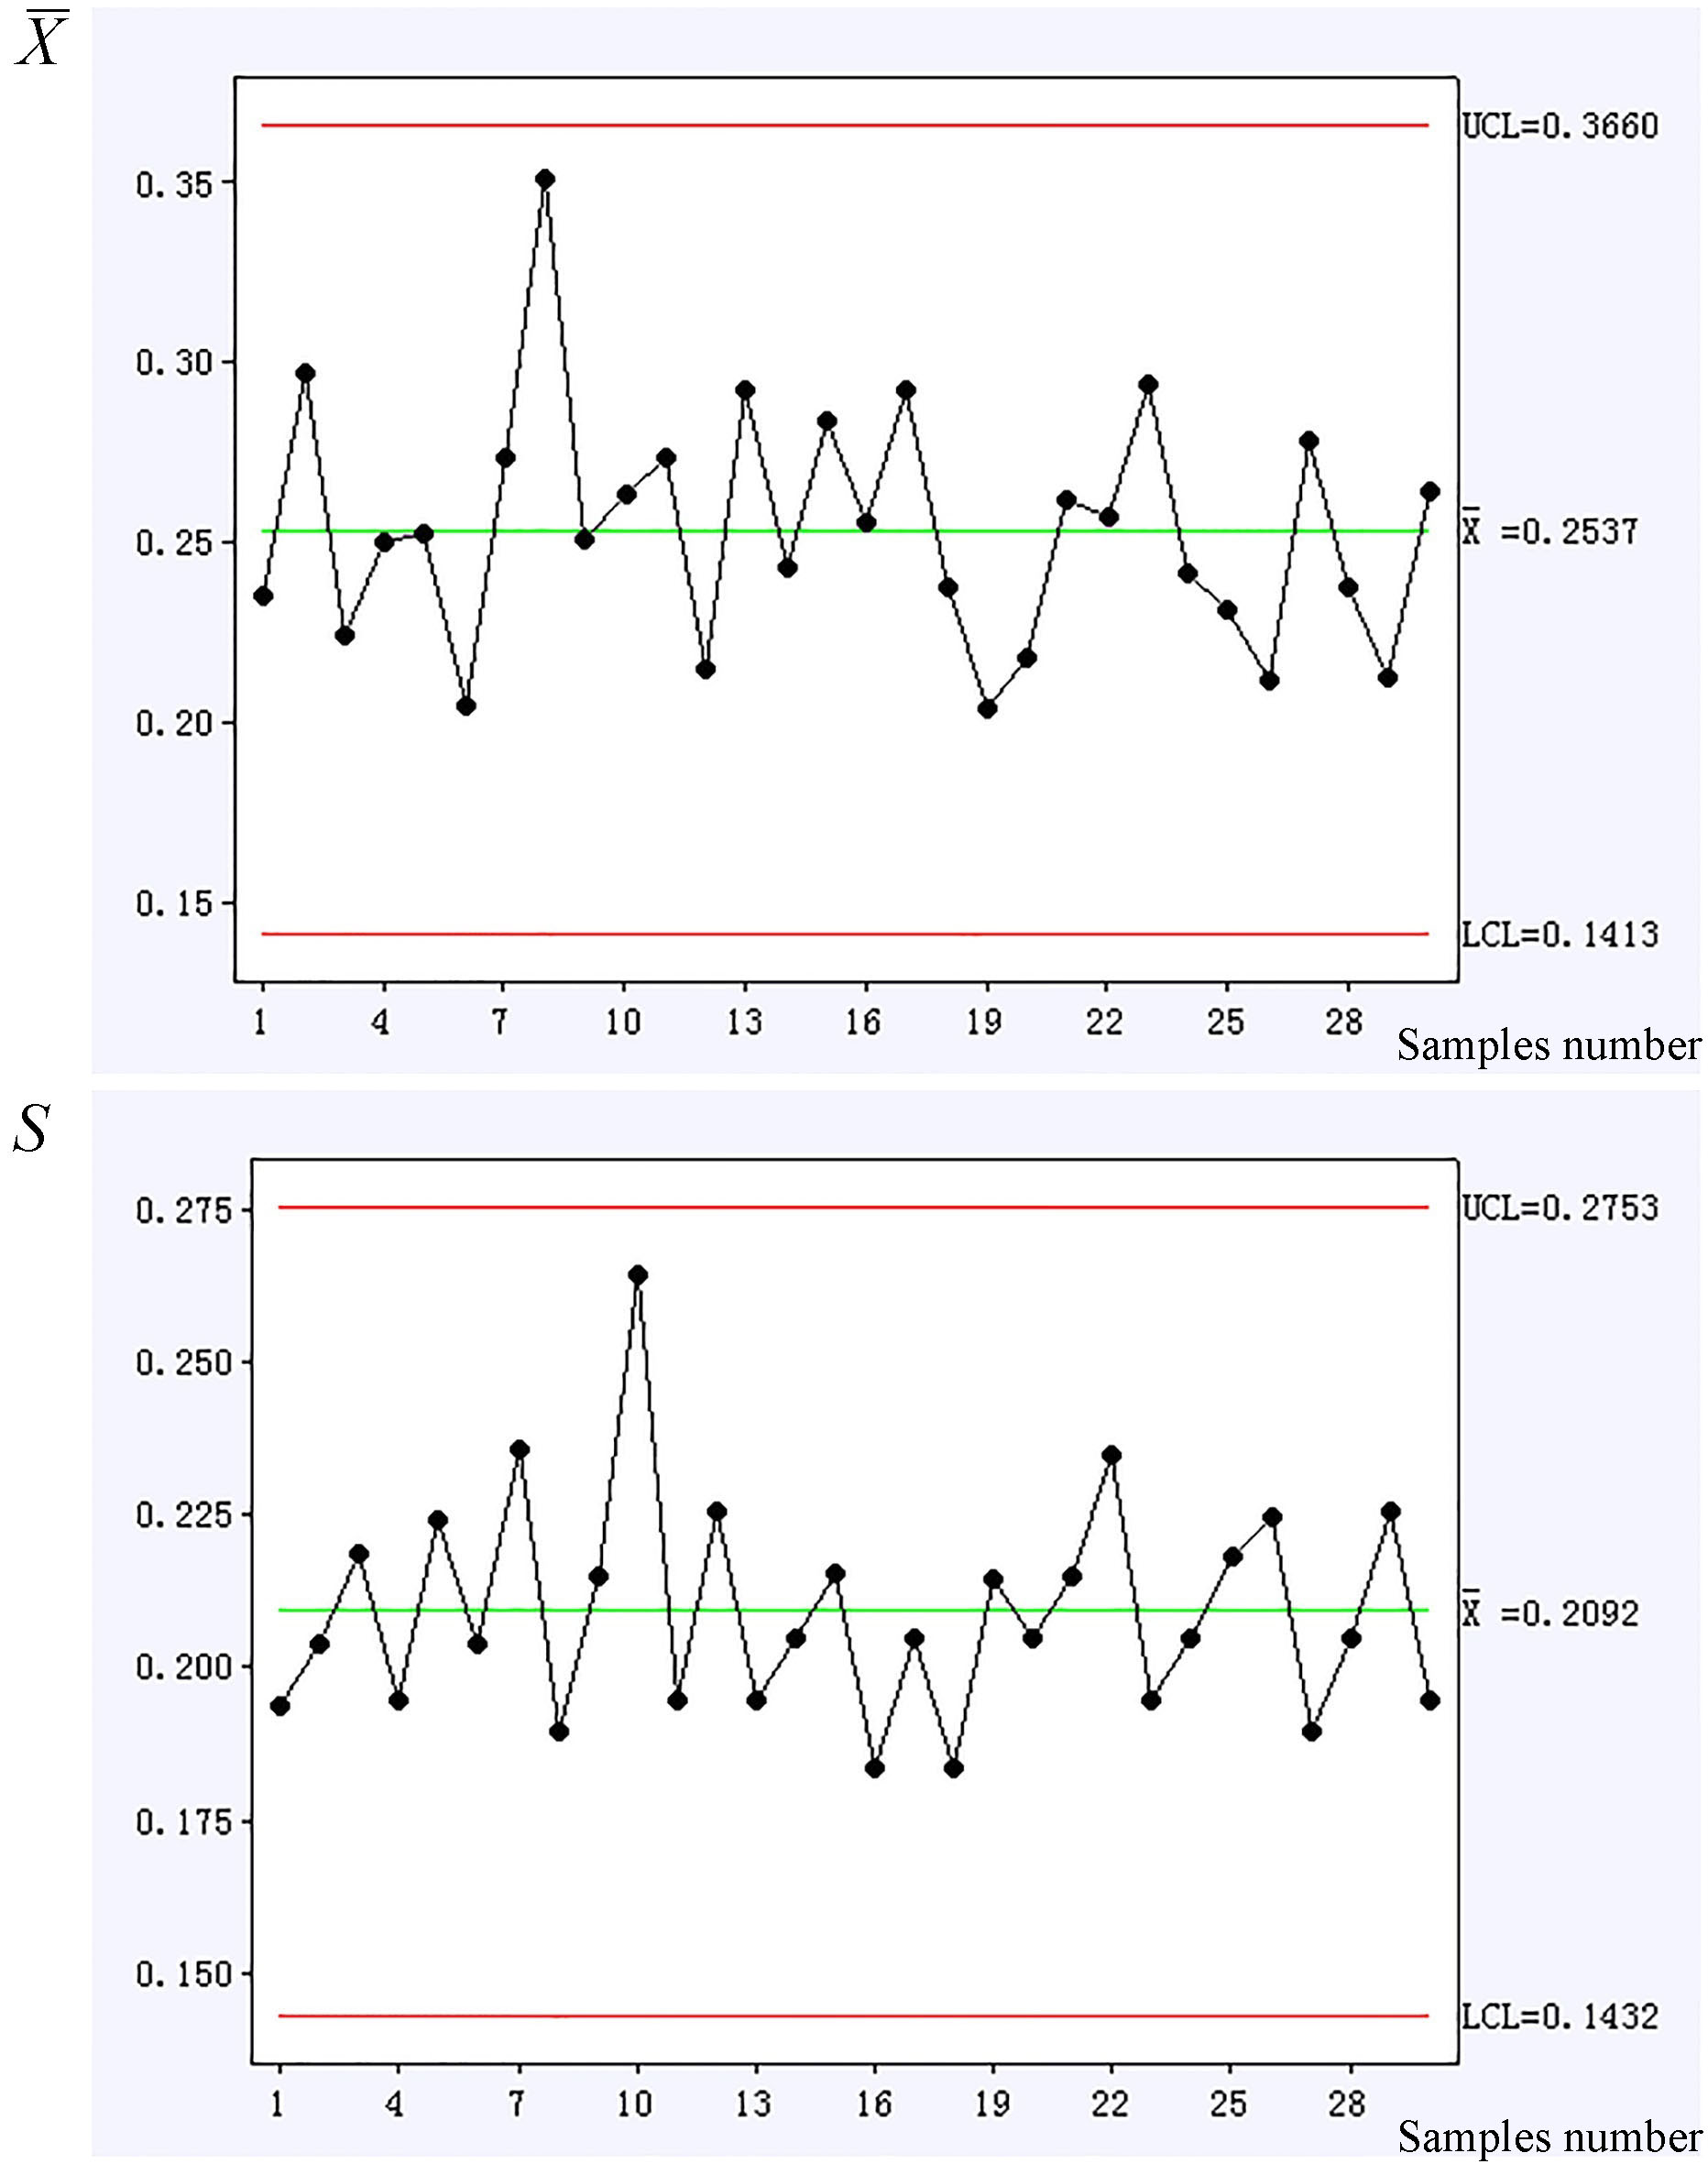
Use the data of the Table 5 as sample dates to trace points in the control chart and control chart as following Fig. 10.
and control chart of fuzzy set distanc.
In the Fig. 10, there are shown that the points all are between the upper control limits and lower control limits. The process is stable on the whole. We can understand if the process is controlled from the control chart and control chart.
Process capability index under Beta distribution
According to abnormal distribution, analyzing process capability indexes. Set 0.135%. Then get and correspond to 0.135% and 99.865% quintiles of fuzzy set distance, respectively. Then process capability index under Beta distribution is [23]:
In Eq. (20), is the selection range of production. Based on control chart of fuzzy set distance, technical standard is usually , and . is the upper limit of common difference. When the middle of common difference and the middle of quality feature distribution are different, define skew process capability index as below [24]:
In Eq. (21), is the median of Beta distribution. is the tolerance center. According to these formulas, when quality characteristic value follows normal distribution, and equal to and , respectively.
In the process of producing, fuzzy set distance is variable. According to this feature. Based on Beta distribution, the relations among the mean value of fuzzy set distance, the standard deviation of fuzzy set distance, and distribution index and are shown below:
When and change, process capability index changes, then analyze the feature of process capability index.Assume common difference 0.5, in other words, technical standard is . Then get the curve surface chart of , when and changes. When and changes, is shown in Fig. 11.
When the lower deviation of technical standard 0, and the upper deviation of technical standard 0.5, and should follow some restrictions. In Fig. 11, the lower curve surface reveals the effects of these restrictions. When decreases, increases. It means the change of reflects process capability. Meanwhile, when decreases to the ideal value of fuzzy set distance, increases at the first, then decreases a little bit. And lower the value of is, better the process capability is. According to the analysis above, the change of can reveal the change of process capability in some kind, but not properly. Therefore, is restrictive when used as the index of revealing process capability.
By using the same method, get frequency distribution of and relatively. Furthermore, after simulation, get the sample statistic value of and , shown in Table 6.
Estimate value of and
Statistic
C 0.09
C 0.10
C 0.11
C 0.12
C 0.13
C 0.14
C 0.15
( 20)
1.06189
1.02831
0.21676
0.974853
4.57097
0.57851
2.25435
( 50)
1.02568
1.01278
0.12713
0.653427
3.80332
0.67745
1.75105
( 100)
1.01439
1.00853
0.08798
0.457785
3.39333
0.77271
1.40713
( 1000)
1.00134
1.00080
0.027296
0.174460
3.10742
0.90594
1.12863
( 20)
0.74066
0.72389
0.14259
0.827304
4.31304
0.38870
1.57933
( 50)
0.71707
0.71024
0.08494
0.503901
3.52968
0.44853
1.15525
( 100)
0.70913
0.70616
0.05928
0.377703
3.33335
0.53376
0.99427
( 1000)
0.70058
0.70016
0.01847
0.127817
3.05023
0.64028
0.78421
When and get different value, the curve surface of .
This paper analyzes process capability by the features of random variable in fuzzy set distance. Based on reference [25], extend the definition of process capability index and . Then, get two process capability indexes , which follow Beta distribution. However, these indexes are restrictive for leveling process capability. Then, with optimized analysis on process capability of rate of rejection, product quality loss, and product value, get the way to optimize overall parameters of Beta distribution. At last, introduce and as the estimate value of and relatively. Due to complexity of these estimate values, Monte Carlo method is introduced to get distribution simulation, then take deep analysis on these distribution.
Conclusion
By the above comprehensive analysis and evaluation, the conclusion can be summed up, as following:
For the control of fuzzy quality attributes, normal distribution is not applicable. It is necessary to design unconventional fuzzy quality control charts.
It is feasible that Taguchi’s quality loss function is as the theoretical support of fuzzy quality control chart.
Beta distribution as statistical basis of fuzzy control model is applicable. When the range of similarity index is in [0, 1], it is a kind of control chart based on fuzzy quality indicators for monitoring object index.
The sufficient mathematical calculus and statistical simulation is used to prove the correctness and rationality of the proposed hypothesis.
This paper conducts the fuzzy quality control under Beta distribution, using Taguchi quality loss function, and fuzzy set distance method. And it is discussed that process is controlled or not based on case study. It can be drawn a conclusion that the fuzzy control charts of fuzzy set distance are applicable based on Taguchi quality loss function.
Footnotes
Acknowledgments
Project supported by Social Science Foundation of Beijing, China (14JGC105); the project of “real training” for the 2017–2018 academic year of the Beijing Municipal Education Committee; the project of Beijing Knowledge Management Base (71F1810916).
References
1.
ChengC., Fuzzy process control: construction of control charts with fuzzy numbers [J], Fuzzy Sets and Systems154 (2003), 287–303.
2.
TalebH. and LimamM., Fuzzy and probabilistic control charts [J], International Journal of Production Research40 (2012), 2849–2863.
3.
FranceschiniF. and RomanoD., Control chart for linguistic variables: a method based on the use of linguistic quantifiers [J], Journal of Production37 (1999), 3791–3801.
4.
Thomas FosterS., Design for an SPRT control scheme based on linguistic data [J], International Journal of Production Research41(6) (2003), 1299–1309.
5.
WangL.R. and RowlandsH., An approach of fuzzy logic evaluation and control in SPC [J], Quality and Reliability Engineering International16 (2000), 91–98.
6.
ChengC., Fuzzy process control: construction of control charts with fuzzy numbers [J], Fuzzy Sets and Systems154 (2015), 287–303.
7.
ImmB.-Y.LeeJ.H. and LeeS.H., Sensory quality index (SQI) for commercial food products, Food Quality and Preference22 (2011), 748–752.
8.
GülbayM.KahramanC. and RuanD., Probability theory and fuzzy logic are complementary rather than competitive [J], Technometrics37(3) (1995), 271–276.
9.
ChengC., Fuzzy process control: construction of control charts with fuzzy numbers [J], Fuzzy Sets and Systems154 (2015), 287–303.
10.
FranceschiniF. and RomanoD., Control chart for linguistic variables: a method based on the use of linguistic quantifiers [J], Journal of Production37(16) (1999), 3791–3801.
11.
Discriminant models based on sensory evaluations: Single assessors versus panel average, P.M. Granittoa, b, F. Biasioli, Food Quality and Preference, 2015.
12.
ZadehL.A., Probability theory and fuzzy logic are complementary rather than competitive [J], Technometrics37(3) (1995), 271–276.
13.
HuC.ZhouX. and SunB., Nussbaum-based fuzzy adaptive nonlinear fault-tolerant control for hypersonic vehicles with diverse actuator faults, Aerospace Science and Technolgy71 (2017), 432–440.
14.
WoodallW.H.TsuiK.L. and TuckerG.R., A review of statistical and fuzzy control charts based on categorical data [J], Frontiers in Statistical Quality Control5 (2007), 83–89.
15.
WuX. and NieL., Robust fuzzy quality function deployment based on the mean-end-chain concept: Service station evaluation problem for rail catering services, European Journal of Operational Research263 (2017), 974–995.
16.
SakthivelR.SaravanakumarT.MaY.K. and AnthoniS.M., Finite-time resilient reliable sampled-data control for fuzzy systems with randomly occurring uncertainties, Fuzzy Sets and Systems329 (2017), 1–18.
17.
ThomsonaD.M.H.CrockerC. and MarketoC.G., Linking sensory characteristics to emotions: An example using dark chocolate [J], Food Quality and Preference12 (2010), 1117–1125.
18.
SenturkS. and ErginelN., Development of fuzzy and control charts using a-Cuts [J], Information Sciences179 (2009), 1542–1551.
19.
JaegerS.R. and AxtenL.G., PLS discriminant analysis applied to conventional sensory profiling data [J], Food Quality and Preference235 (2016), 234–241.
20.
YuF.-J.LowC.-Y. and ChengS.-S., Design for an SPRT control scheme based on inguistic data [J], International Journal of Production Research41 (2013), 1299–1309.
21.
GülbayM. and KahramanaC., An alternative approach to fuzzy control charts: Direct fuzzy approach [J], Information Sciences177 (2007), 1463–1480.
22.
SenturkS. and ErginelN., Development of fuzzy and control charts using a-Cuts [J], Information Sciences179 (2016), 1542–1551.
23.
GülbayM.KahramanC. and RuanD., a-Cut fuzzy control charts for linguistic data [J], International Journal of Intelligent Systems19 (2014), 1173–1195.
24.
CastagliolaP.CelanoG.CostaA. and FicheraS., Study on fuzzy and probabilistic control charts [J], International Journal of Production Research40(12) (2002), 2849–2863.
25.
LiZ.MiaoR.WeiC.Q.LiZ.F. and JiangZ.B., A robust MEWMA control chart based on FAST-MCD algorithm [J], Advanced Materials Research13 (2013), 562–564, 2013.