
Abstract
As an important way to obtain ground information, high resolution remote sensing images have been widely used in many fields, such as urban planning, base map updating, cadastre investigation, and precision agriculture. Because the application of remote sensing images on different occasions puts forward different requirements for remote sensing image processing, the important link in image processing–image classification, becomes even more important. This paper begins with image segmentation, combines algorithm of patch purification, region growing and superpixel segmentation, to implement semi-supervised classification using a small number of labeled sample points to obtain higher-accuracy classification results.
Introduction
Remote sensing image segmentation is an important way to analyze the information contained in remote sensing images [4]. It refers to the process of dividing the image into different regions according to different features in order to extract the region of interest from the image. The internal features of the segmented patches are similar. The features here can be the spectral information or texture information of the image, and the region of interest can be one or some of them. Region, image segmentation can provide a powerful help for extracting homogeneous regions.
Research status of image segmentation methods
Image segmentation is the process of generating image objects. It divides the image into several non-overlapping non-empty sub-regions. Each sub-region is connected and has the same or similar characteristics within the same region. The characteristics here can be spectrum, texture, shape and so on. Any two adjacent regions are heterogeneous. Experts and scholars have always attached great importance to the research of image segmentation, so far, many different types of segmentation algorithms have been proposed. One classification method is to divide the image segmentation algorithm into four categories: histogram threshold segmentation, feature space clustering segmentation, region segmentation, edge detection segmentation.
Research status of road center line extraction based on GPS data
The trajectory data of moving objects is different from the general spatial data. The trajectory data records abundant spatial and temporal information and can obtain more information related to roads. The extraction of road network is a very complex problem. Data preprocessing can not completely eliminate the original error of GPS trajectory. At present, there is no complete and mature road network extraction method. The main problems are the complexity of road shape, the error of GPS trajectory, and the uneven distribution of GPS trajectory. However, many scholars have achieved some research results.
Texture-based image segmentation
Image model description
For a window
Considering the image of the uniform texture region shown in Fig. 1, assuming that the spectral histogram in the uniform region is approximately constant, the local spectral histogram representing each region can be calculated from the window in each region, and the spectral histogram in the region Under the assumption of constancy, the local spectral histogram of pixel A can be approximated by a weighted sum of representative histograms of two adjacent regions, wherein the weight corresponds to the region coverage within the window, and thus can indicate which pixel A belongs to region. Too large a scale of the filter will result in severe distortion of the histogram near the boundary. In the case of no distortion, the same analysis can be performed on other filter responses, since the purpose of filtering in the local spectral histogram is to acquire the region. Basic texture features, so choose a small-scale filter.
Split image display.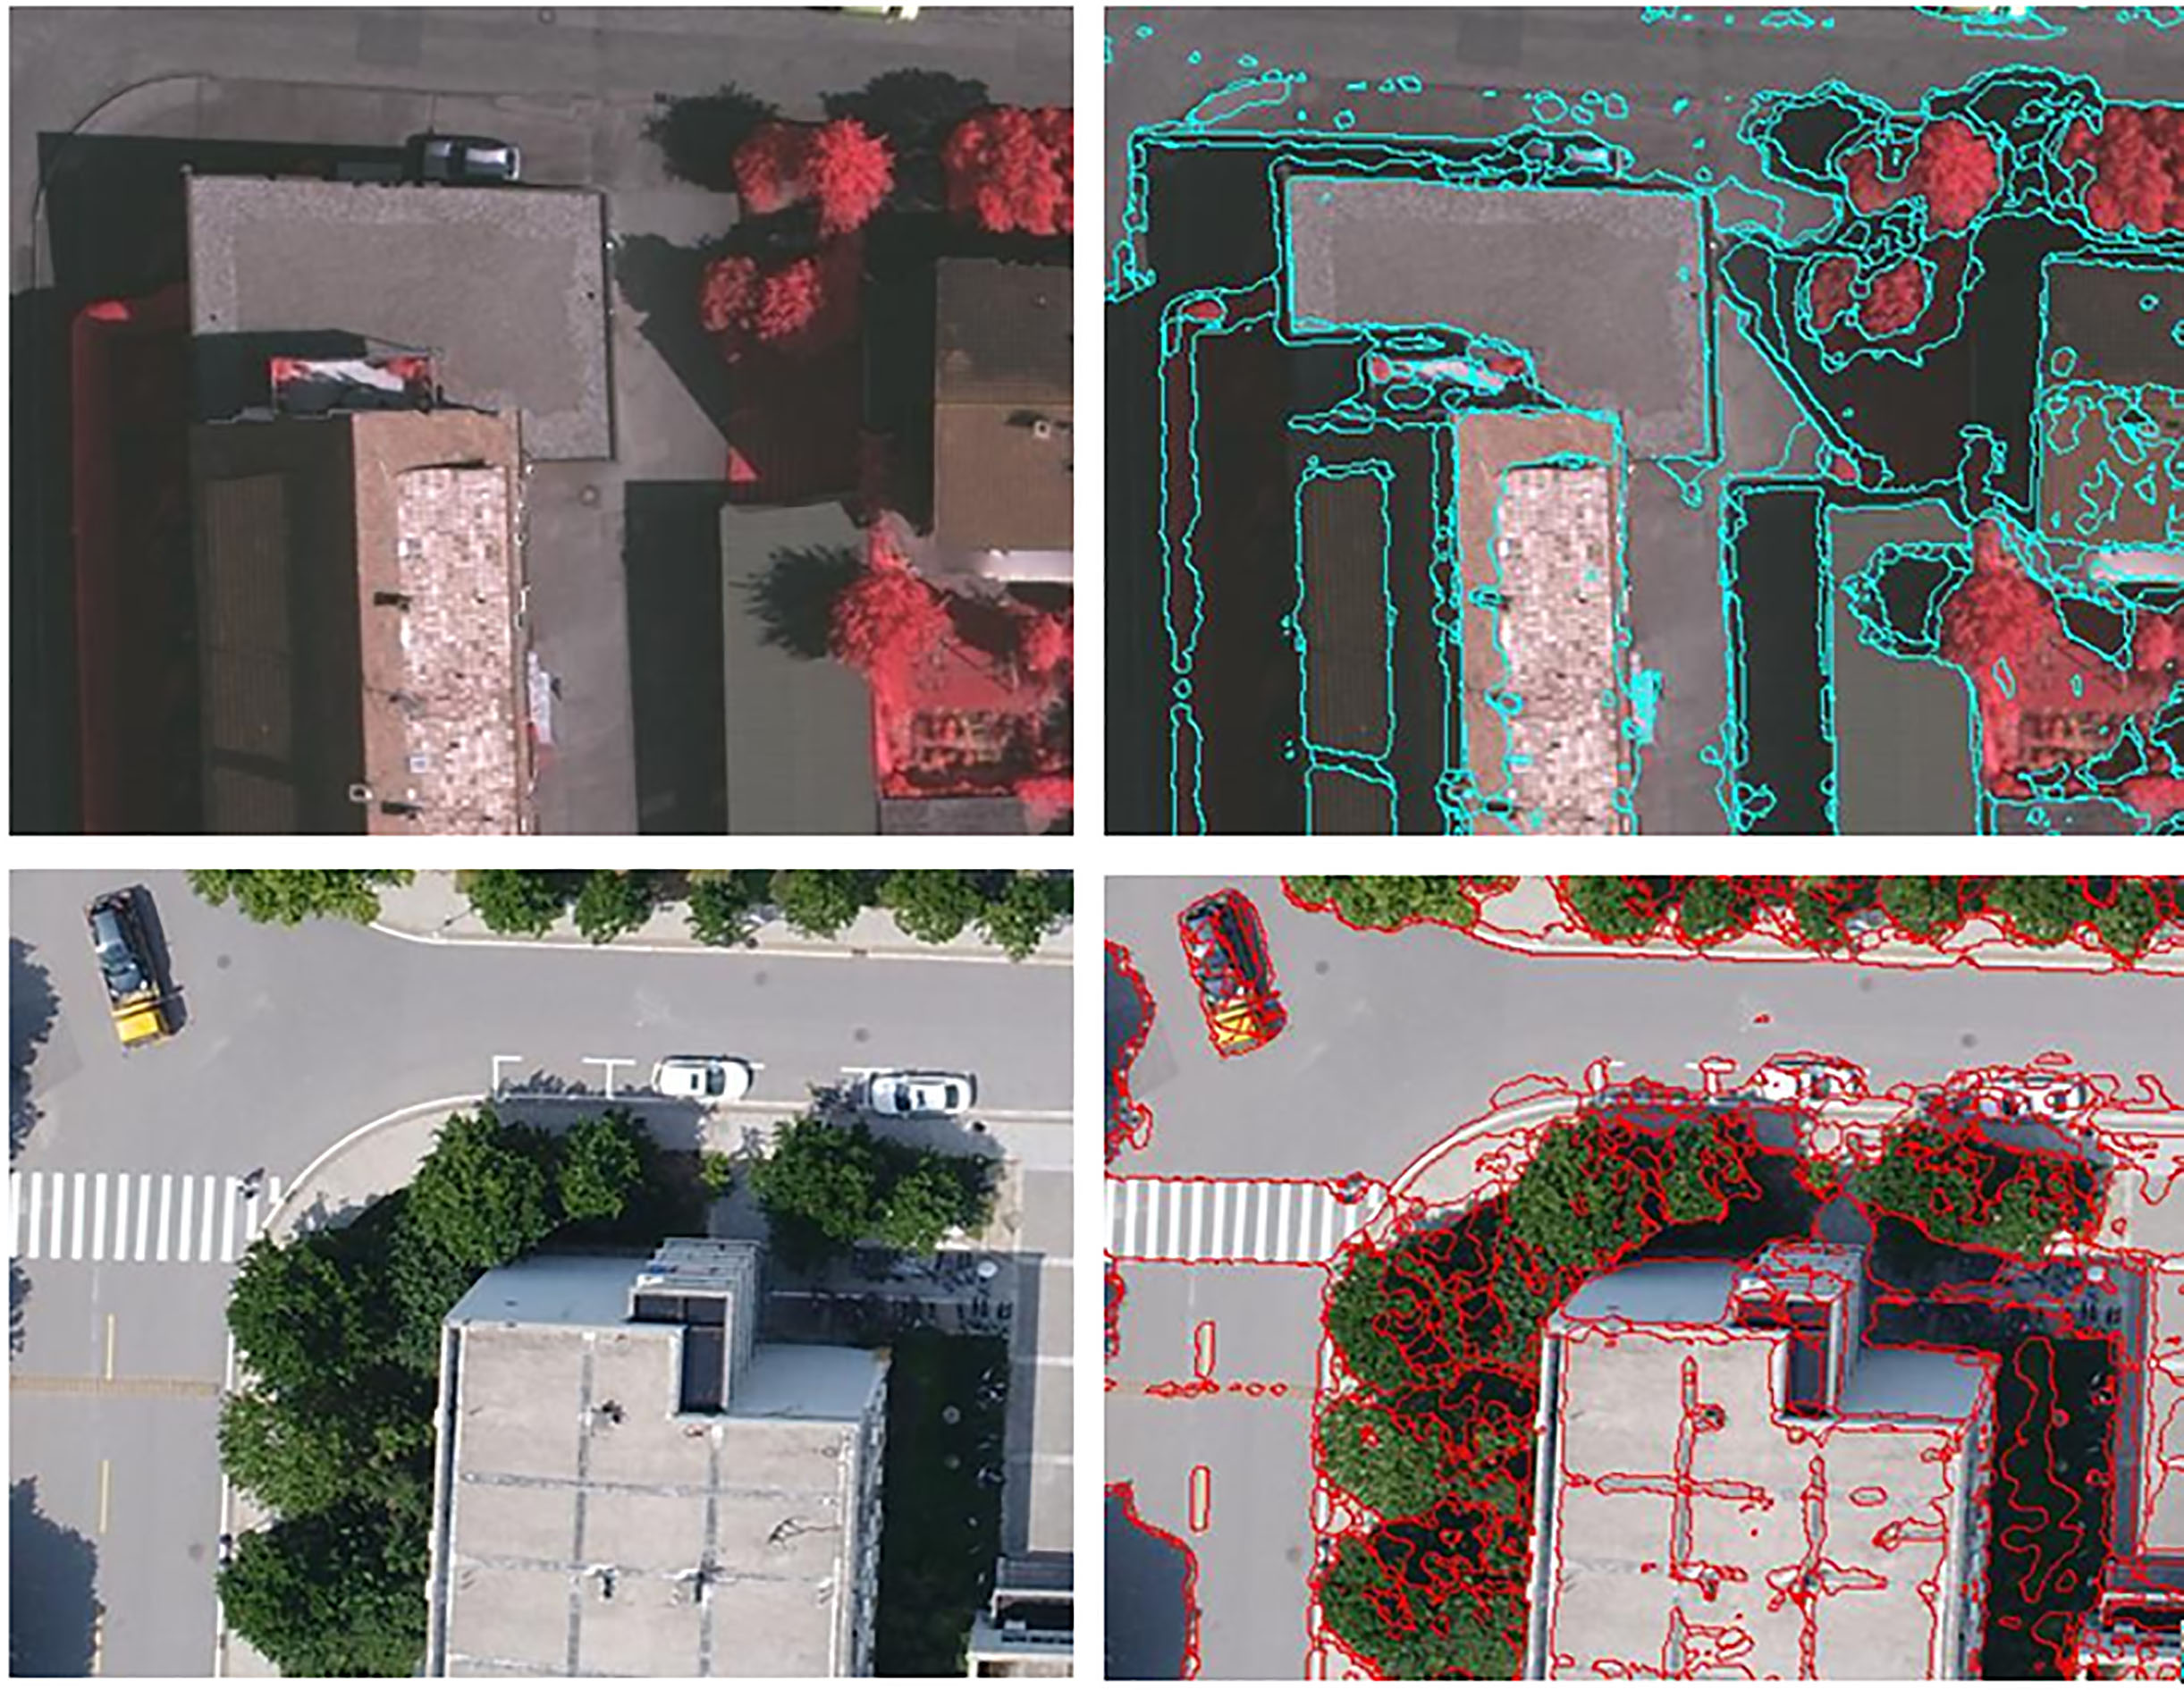
Through the above analysis, the characteristics of each pixel can be considered as a linear combination of all representative features of the corresponding coverage area. In the case where the window is completely within one region, the weight of the representative features of the region is close to 1, while the other weights are close to 0.
An image with
The representatively selected matrix
The only solution to the existence of Eq. (2) is that
Based on singular value decomposition (SVD), the feature matrix is decomposed into:
From previous experience, the combined weights should have two constraints: non-negative, fully additive (and 1). Experiments show that full additivity has no effect on the classification of images, so the alternating least squares (ALS) algorithm is used to effectively provide low rank approximations of nonnegative factor matrices. The ALS algorithm starts from the initial matrix
Experimental image information
Experimental image information
Experimental selection filter
Experimental image.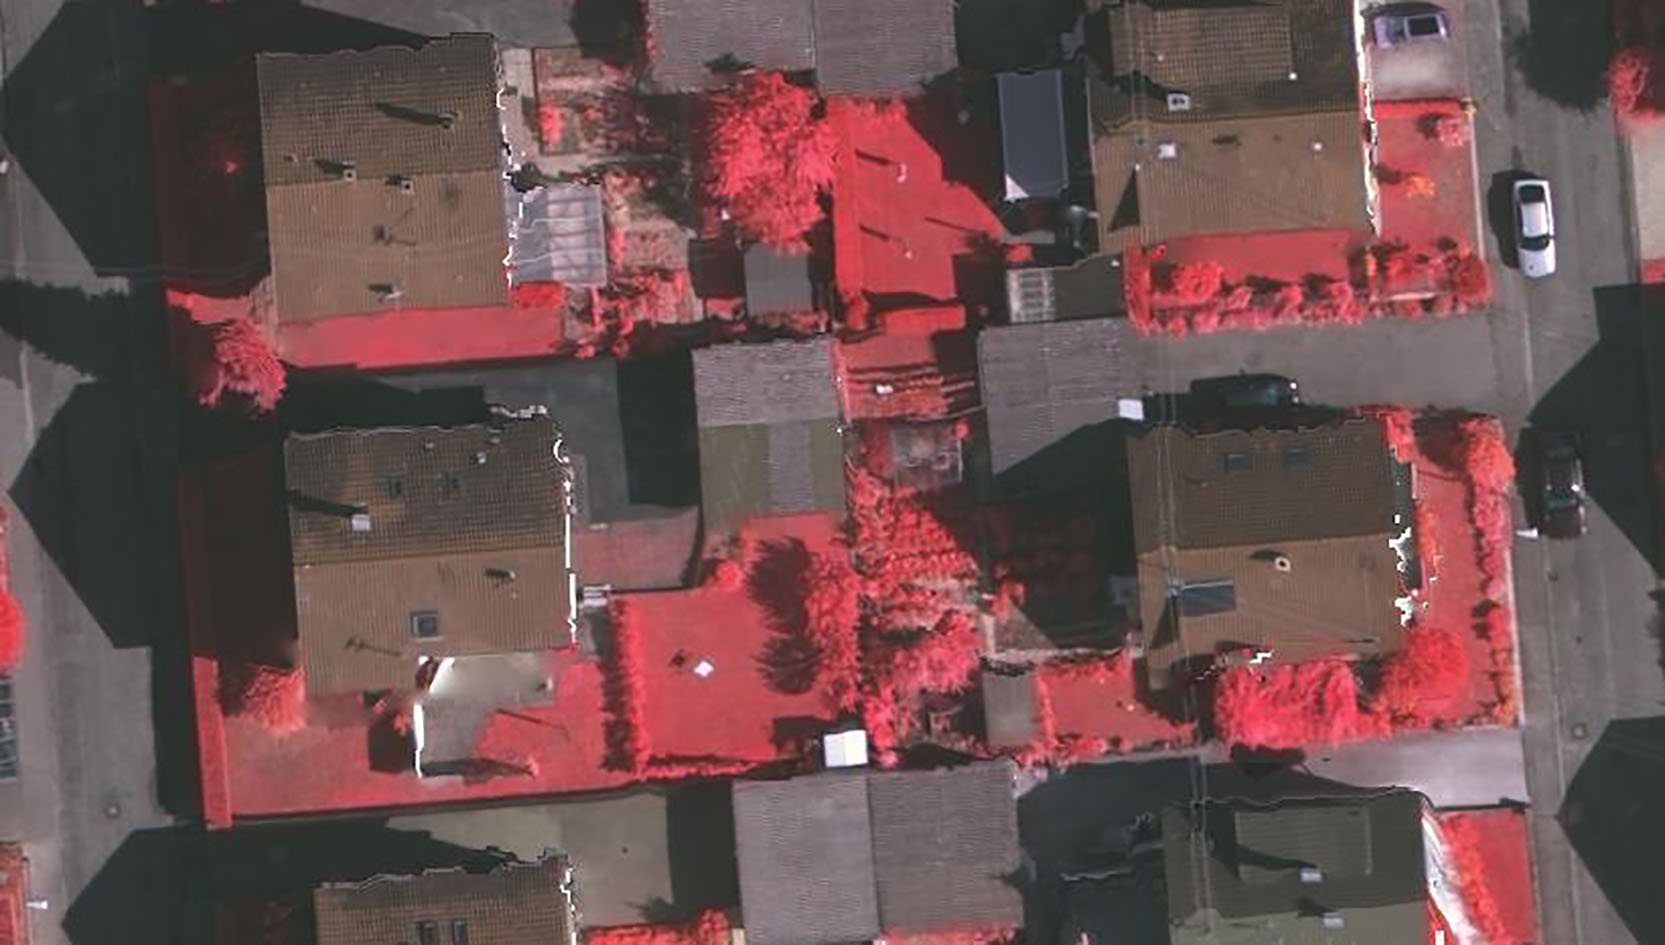
In order to verify the applicability of the above method to remote sensing images, ISPRS high-resolution remote sensing image data and high-resolution images obtained by school drones were used as experimental data. The former is a false color image and the latter is an RGB image. Both are 9 cm. In order to clearly view the segmentation, the image is cut to a size of 350
filter display.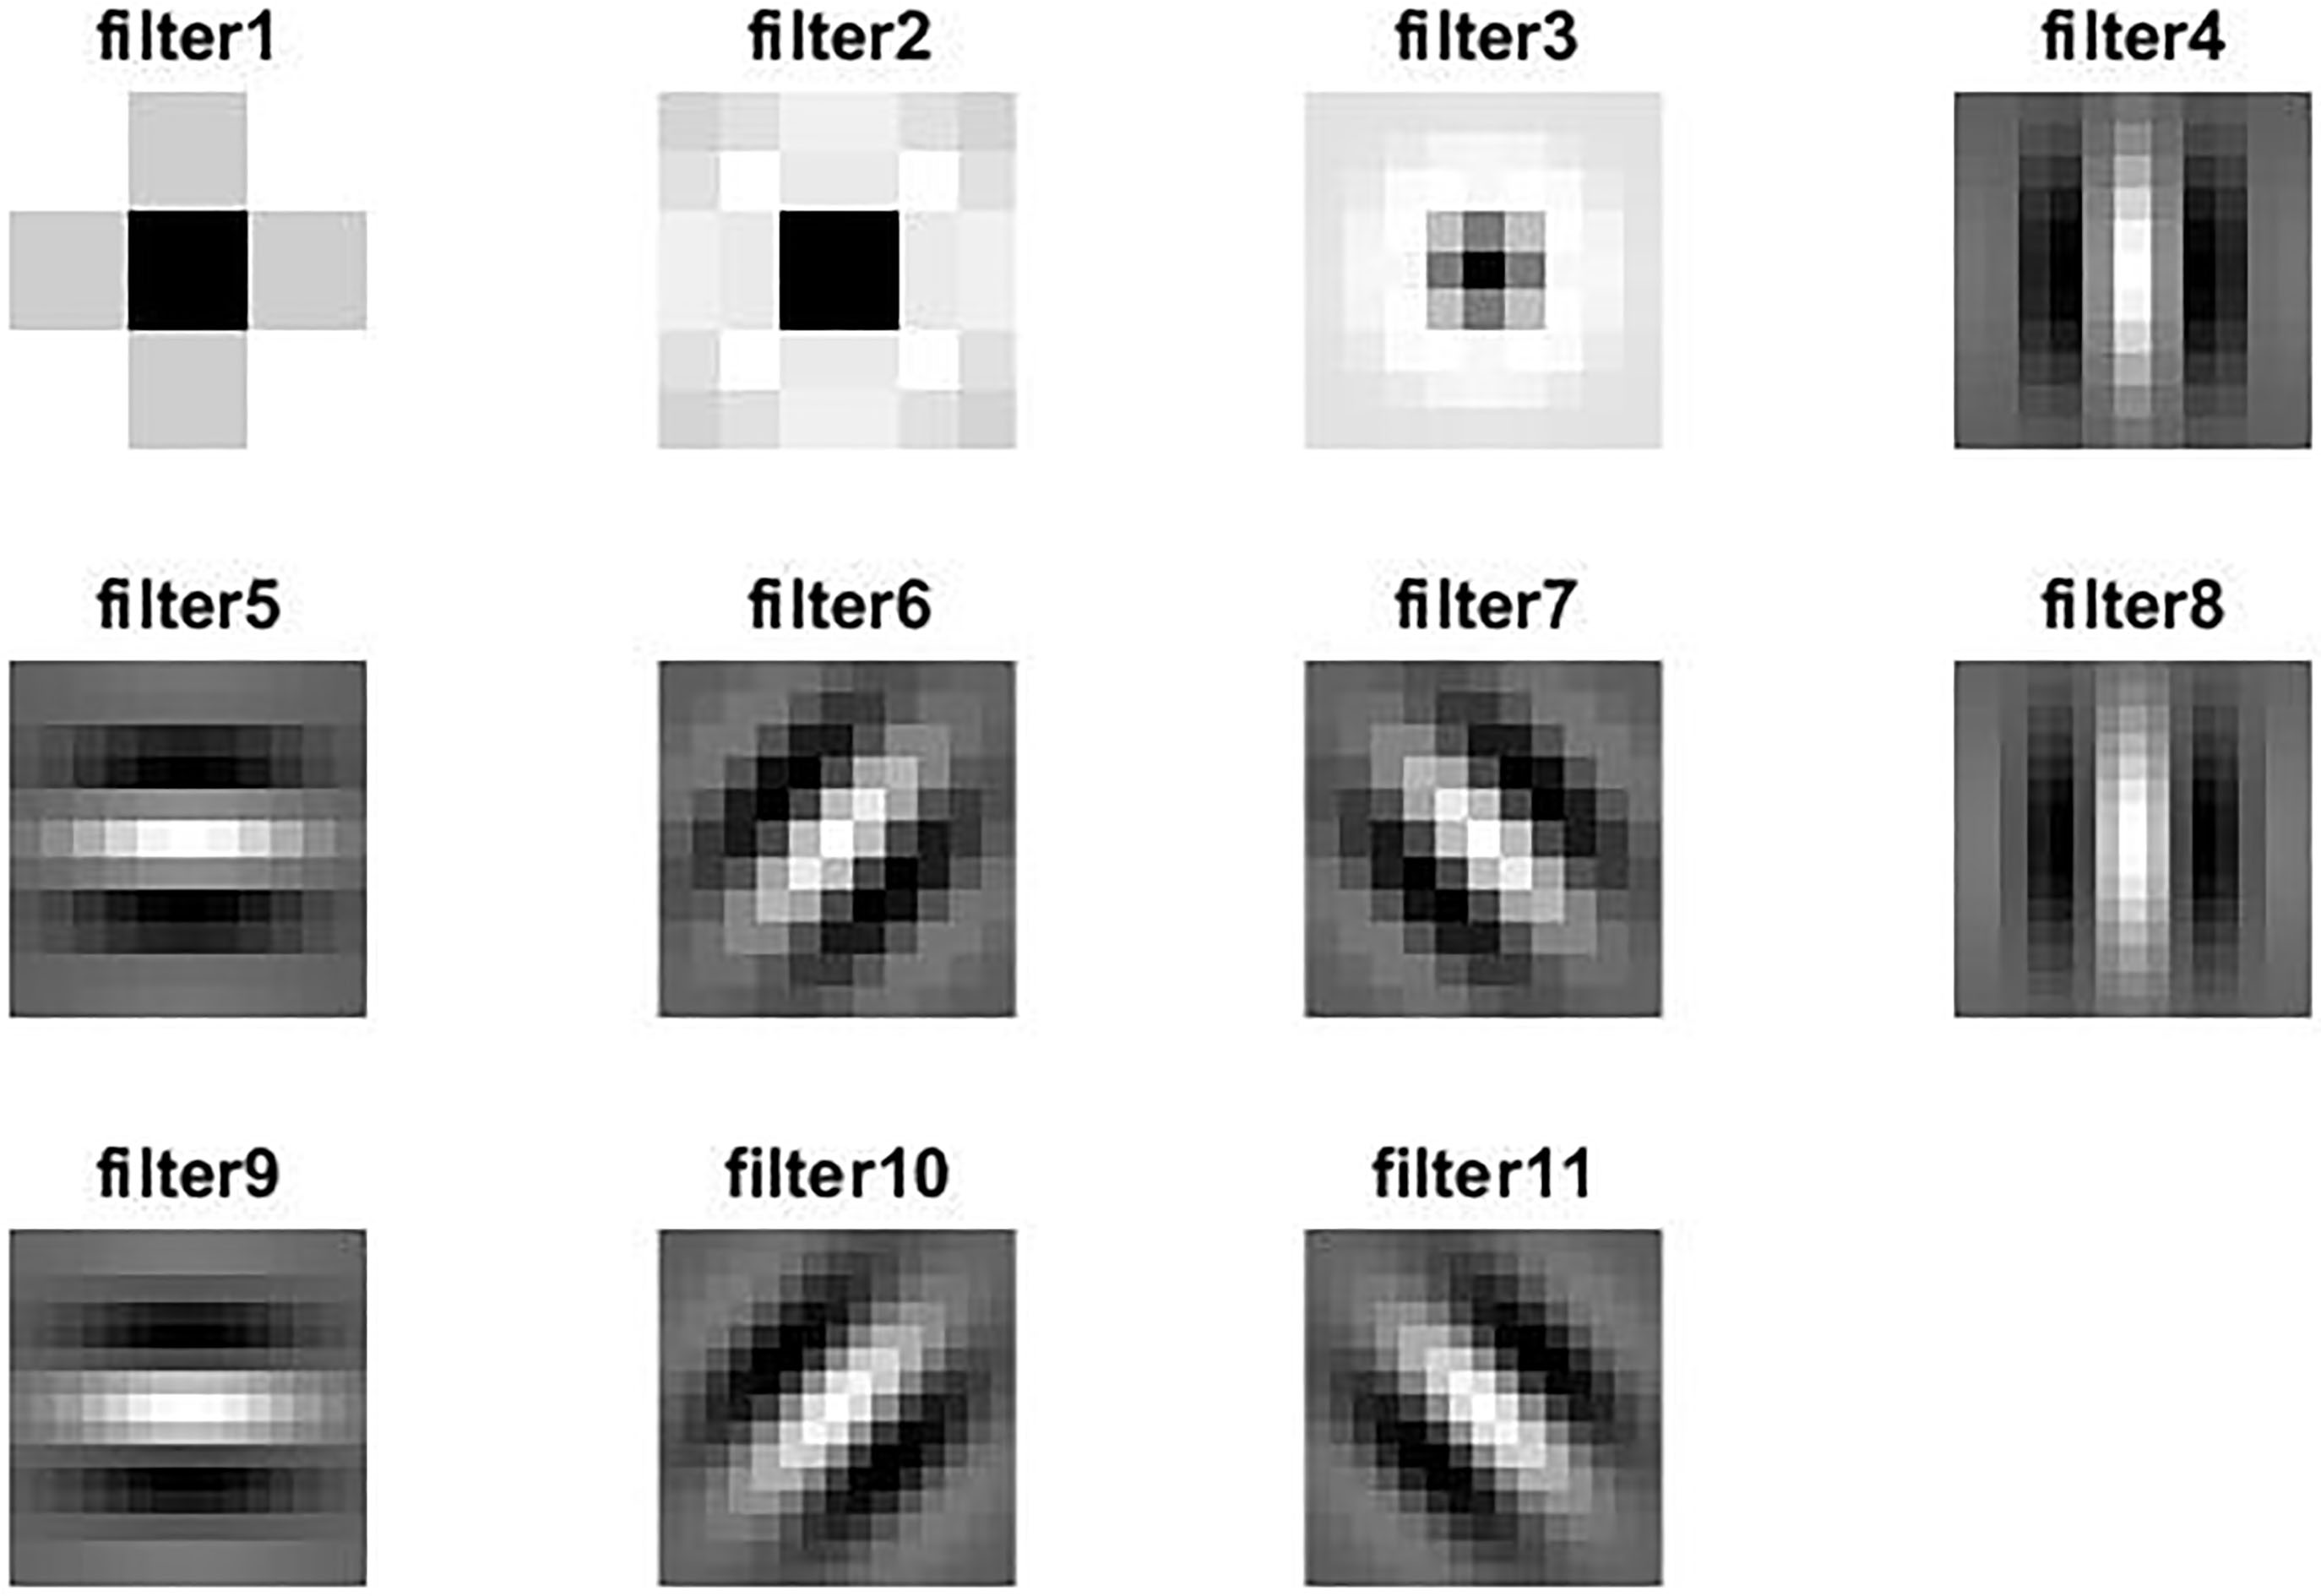
Experimental image segmentation results.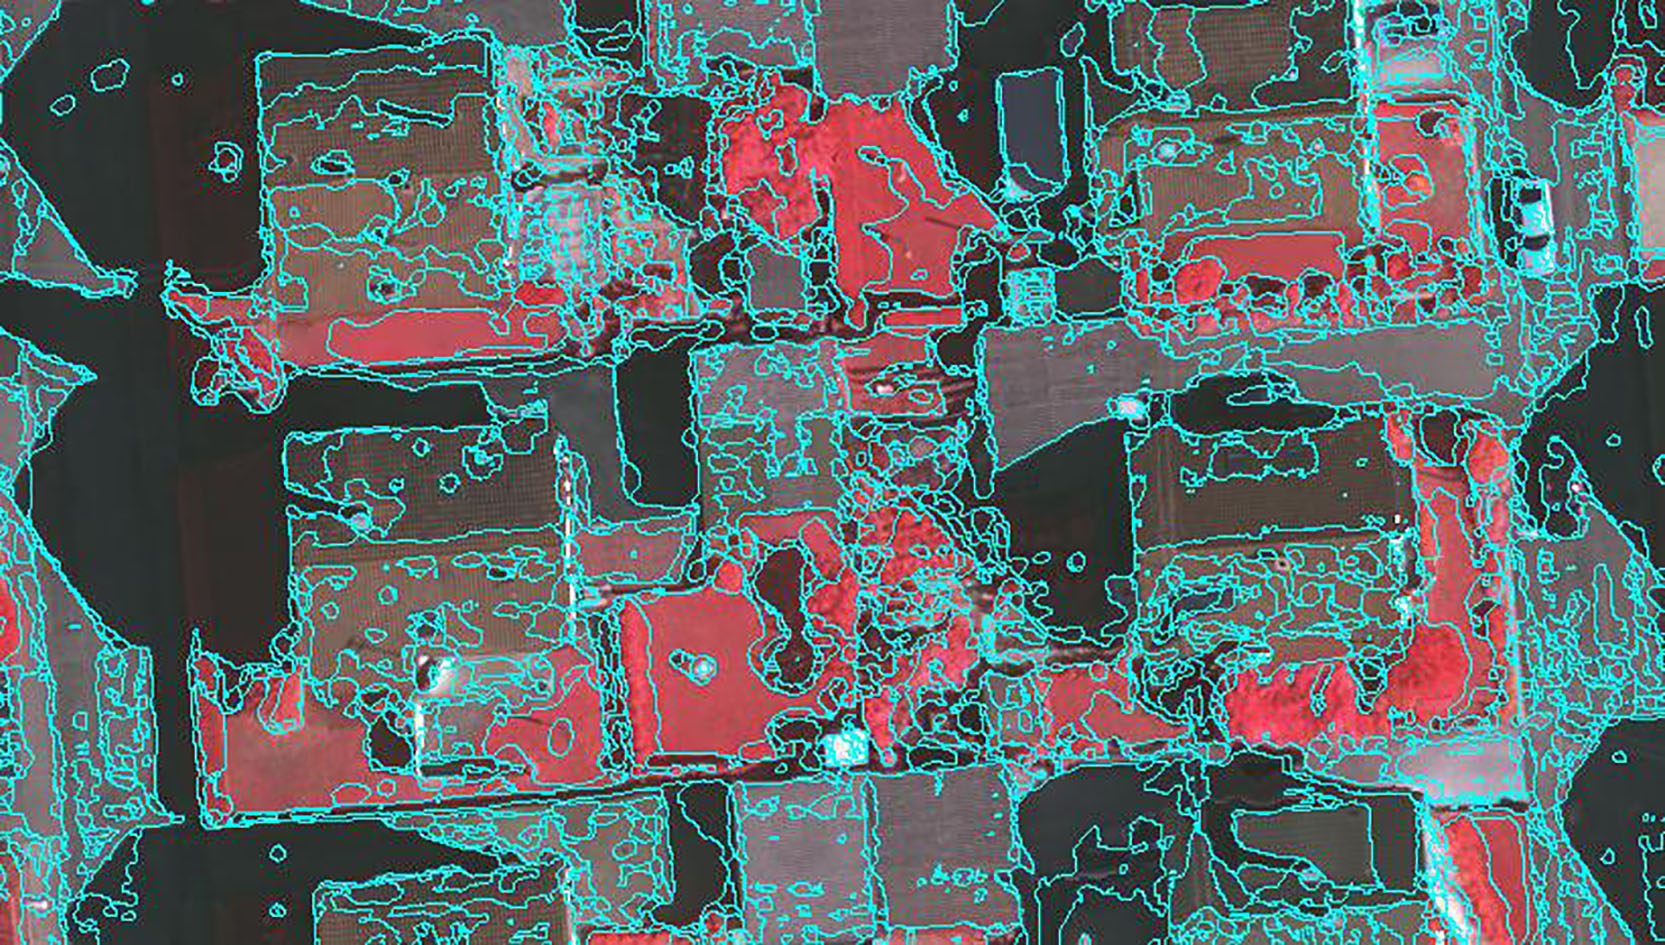
Test data and segmentation results
The experimental data uses high-resolution UAV images and their corresponding ground maps (groundtruth, hereinafter referred to as gt) and DSM elevation images. In this experiment, the intercepted part of one of the figures is used, the size is 466
The image is a false color image composed of the near-infrared band, the red band and the green band. The texture features used in the segmentation include multi-scale filter response and statistical texture features. The statistical texture features use local gray-scale features, and the size is 3
The filter filters the texture of the first channel of the image, and the statistical texture feature is also obtained for the first channel of the image. These features are superimposed with the three channels to form 15-dimensional feature information, and the bin takes 11 to obtain Its local spectral histogram gives the final image feature matrix: 165
Conclusion
In this paper, the process of setting the mean shift algorithm based on the image texture feature matrix and the actual image patch is as follows:
Using the feature as a coordinate value, calculate the feature mean of all pixels, and use it as the center point center1; The characteristics of all the pixels are inferior to the features of the center point, and are arranged in ascending order; Take the first 40% of the pixel points of q, and calculate the feature mean as the new center point center2; Calculate the sum of the feature differences between center2 and center1; Finally, take the point where the difference from the feature center point does not exceed 60% of the maximum difference as the homogenous point of the plaque.
Through experiments, it is found that the shadow part is basically divided as a whole. Because the brightness of the shadow area is low, the internal different types of objects cannot be extracted as the homogenous area. The experimental image used is a false color image, and the three channels are: near-infrared, red band, green band. The red and green bands are very sensitive to shadows and non-shadows. By statistic of the gray values of the shadows and non-shadows, you can see the obvious difference between the shaded and non-shaded areas. The ratio of the number of pixels with gray values below 80 in the block to the total number of patches (ratioR and ratioG) is used as a criterion for distinguishing between shadows and non-shadows. This experiment defines that the plaque is a shadow plaque when ratioR and ratioG are greater than 0.95 at the same time. By observing the spectral bands of the shadow and non-shadow categories, it is found that the difference between the shadow and the non-shadow in the red and green bands is large, so the common threshold constraint of the two bands is used to detect the shadow plaque, and the detection is detected. The shadow-like plaque is gray-scale stretched, so that the texture information of different features can be recognized, and the shadow plaque after the gray-scale stretching can obtain the homogenous plaque in the shadow category by using the above method. It has been experimentally verified that the large-scale homogenous plaques in the shaded and non-shaded areas have higher plaque purity than the real ground markers and can be used as subsequent classification data.
Footnotes
Acknowledgments
The authors acknowledge the Young Key Teachers Training Program in Henan Higher Education Institutions (Grant: 2017GGJS255).