
Abstract
Pu’er tea as the landmark product of Yunnan province, which plays a decisive role in the national tea industry and the economic development of Yunnan province. At present, the qualitative and quantitative methods cannot be accurately predicted the price of Pu’er tea. In order to solve this problem, this paper tries to use MLP neural network to forecast Pu’er tea price. Firstly, determine the influencing factors of Pu’er tea price, then established the MLP neural network model, selection activation function and design the number of neurons and the hidden layer size, finally compare the method between MLP and random forest to verify the feasibility and effectiveness of the MLP method.
Introduction
According to the China and Yunnan Statistical Yearbook and China Tea Circulation Association market analysis report, in 2018, the national tea production has reached 2.61 million tons, and the number of tea drinkers is nearly 500 million. Production of Pu’er tea was 170 thousand tons, accounting for 6.69 percent of the national tea production. There are more than 8 million tea farmers and more than 11 million people in this industry, accounting for about 1/4 of the total population of Yunnan province. Pu’er tea as the landmark product of Yunnan province, which plays a decisive role in the national tea industry and the economic development of Yunnan province. Therefore, Pu’er tea has great significance and status both for the development of national tea industry and Yunnan economy. During the 16 years of development, Pu’er tea industry has experienced two changes – crash in 2007 and tumble in 2014. Until 2018, the production of Pu’er tea has increased to 170 thousand tons, and the price of Pu’er tea also recovered to a certain extent. However, the price fluctuation of Pu’er tea without any warning will directly harms the tea worker’s interests and is harmful to the healthy development of this industry.
The price forecast method are qualitative forecast methods and quantitative forecast methods. Among them, the qualitative forecast method is highly subjective and easy to be affected by human factors, and the forecast results are higher uncertain and unstable. Conversely, the forecast results of the quantitative forecast method have strong certainty and stability. Most quantitative methods adopt intelligent algorithms, which mainly include artificial neural network algorithms, gray forecast algorithms, genetic algorithms, wavelet analysis and so on. The artificial neural network algorithm is one kind of mathematical model for simulating the biological neural system for information processing. The constructed predictive model is more intelligent and has a higher forecast rate. In particular, the traditional artificial neural network algorithm is improved to avoid the disadvantages of the traditional algorithm and further improve the accuracy of the forecast. At present, Pu’er tea price forecasting method is mainly adopt qualitative method, predict tea prices based on experience, such as climate drought reduced Pu’er tea production and then increase the price, economic conditions affect consumers’ consumption power, which causes price fluctuations. Although the above qualitative analysis method has certain rationality, it also has great subjectivity, so it is impossible to accurately predict the price. The quantitative analysis methods in this field are mainly based on relevant data to make forecasts. For example, Xu [1] used field investigation method to investigate the price of Pu’er tea. However, due to the limitations in manpower and technology, only three locations could be selected so the investigation did not fully reflect the situation of the tea industry. Dou [2] based on the analysis of raw materials and labor costs, it is concluded that spring tea in 2013 will have a certain increase but in a very reasonable 10% to 15%. In recent years, with the rapid development of artificial intelligence, more and more scholars have tried to use machine learning methods to predict the prices of various industries, such as Zahid et al. [3] based on enhanced convolutional neural networks and enhanced support vector regression to predicts electricity prices and loads. Berradi and Lazaar [4] used principal component analysis combined with recurrent neural networks to predict the stock price of the Casablanca Stock Exchange. Peng et al. [5] used a recurrent neural network to predict stock prices and increase the accuracy by about 30%. Wang and Xue [6] based on the cyclic neural network to predict the stock price. Li and He [7] raised license plate location algorithm based on convolutional neural network. Bento et al. [8] raised the short-term price forecast method of neural network and wavelet transform based on bat algorithm. Loureiro et al. [9] used deep neural networks to predict fashion sales. Chen et al. [10] used BP neural networks to predict building energy consumption. Wu et al. [11] used the method of mean influence value (MIV), genetic algorithm (GA) and BP neural network to conduct cotton price forecast research and concluded that the method has good fitting precision and high forecast accuracy. The sample can reflect 99% of the sample characteristics. Mostafa and El-Masry [12] used gene expression programming and artificial neural networks to predict oil prices.
By studying domestic and foreign literature, scholars mainly use neural network methods to predict prices of oil, stock and real estate. However, in the field of Pu’er tea, no scholars use neural network methods to forecast. Therefore, attempt to use the neural network method for price forecast is an attempt and exploration in this field, thus providing some suggestions for the government to formulate relevant policies and guarantee healthy development of the tea industry.
Analysis influence factors of Pu’er tea price
Influence factor index system
The price of Pu’er tea was affected by many factors. By analyzing relevant factors and referring to relevant literature, this paper takes the price of Pu’er tea as explained variable and the production of Pu’er tea, national tea production, sales volume of Pu’er tea and the number of tea drinkers in China as the explanatory variables. According to the theory of supply and demand, the increase of Pu’er tea production will lead to supply increase and thus affect the price. The increase of national tea production reflects the tea consumption groups or per capita consumption. According to the China and Yunnan Statistical Yearbook and China Tea Circulation Association market analysis report, the proportion of Pu’er tea production is about 5.5%, thus can known the market share and market influence of Pu’er tea. The sales volume of Pu’er tea directly reflects the market recognition and acceptance of Pu’er tea. According to the statistical data, the sales volume of Pu’er tea increases year by year but have different growth proportion. When sales increase to a certain extent, supply will exceed demand in the market and causes price drop. The number of tea drinkers nationwide is equal to the number of tea consumers, the per capita consumption of tea is 3.3 kilograms every year, while the sales volume of Pu’er tea accounts for about 4.5% of the national tea sales volume. The tea consumption increase will expand the demand of tea, thus affecting the price of Pu’er tea. Among them, the price of Pu’er tea is set as (RMB/kg), production of Pu’er tea is X1 (tons), national production of tea is X2 (tons), sales of Pu’er tea is X3 (tons), and the number of tea drinkers is X4 (100 million). Statistical data such as Table 1.
Price and influencing factors of Pu’er tea from 2003 to 2018
Price and influencing factors of Pu’er tea from 2003 to 2018
Source: China Statistical Yearbook, Yunnan Statistical Yearbook.
The reasons for this abnormal fluctuation are as follows: Pu’er tea has attracted people’s attention due to its characteristics of increasing fragrance and value. From mainstream media to portal websites, Pu’er tea was described as a financial product that can be invested for a long time. A large number of transactions by major auction houses have further increased people’s collecting enthusiasm. Serious drought in Yunnan, forced a large number of merchants rise tea price. But this industry is not yet mature, Dayi, Xiaguan mass release goods caused the entire Pu’er tea collection market was broken. People blindly hype Pu’er tea as will bring huge investment returns and storage, but after hot and market speculation the tea market gradually become cold and cheerless, a lot of Pu’er tea in stock caused the serious mismatch between supply and demand, coupled with drought, earthquake, etc., brought a fatal blow to Pu’er tea market in 2007 and tea prices fell back quickly. Due to the large abnormal fluctuation in 2006, the prediction model may be disturbed. Therefore, established the MLP neural network model to deal with the nonlinear relationship to achieve a more optimized fitting effect.
Neural network price prediction model
Perceptron is a concept in artificial neural network, which is divided into single-layer and multi-layer perceptron. The single-layer perceptron only contains input and output layer, and the input layer is directly connected to the output layer. This paper selects a multi-layer perceptron that can deal with nonlinear problems. It is a multi-layer feed-forward artificial neural network model. In addition to the input and output layer, it also contains one or more hidden layers. The structure is shown in Fig. 1. Among them, input layer neurons receive input signals, hidden and output layer carry out nonlinear processing of input signals, finally output results from the output layer.
Multilayer feed-forward artificial neural network.
When using the neural network to construct the price forecasting model of Pu’er tea, this paper takes four variables as characteristics. Therefore, the input layer of this prediction model contains 4 neurons, and the number of neurons in the hidden layer is
Considering the price prediction is a regression problem, the neural network contains only one output layer neuron. The threshold value of neurons in the output layer is
The experiment in this paper consists two parts. One is the parameter analysis of MLP neural network. The second is use the neural network model and random forest method for comparative analysis.
Introduction to the experimental environment
This paper use Intel(R) Pentium (R) CPU N3540@2.16 GHz processor, 4 GB memory, 64-bit operating system, Python3.6.3 scikit-learn data package, MLP Regression model with a maximum of 2000 training times as termination condition.
Parameter analysis of MLP neural network
Selection of activation function
Activation function enable MLP model to deal with nonlinear problems, so the selection of activation function has a crucial impact on the accuracy of model prediction. In this paper, Relu function and Tanh function are used for comparison, and the number of neural network unit layers is set as 2, 3, 4 and 5 layers respectively to predict the price in 2017 and 2018. According to the comparative analysis of the experimental results of different activation functions, then the activation function is determined.
Comparison of relative error results of activation functions
Comparison of relative error results of activation functions
Experimental results shows that the relative error of Relu are all smaller than Tanh activation function, so selected Relu as the activation function in this paper (see Table 2).
After determining the activation function, analysis the price prediction results of the number of hidden layer neurons and the number of hidden layer. The number of neurons is 10, 20, 30, 40, 50, 60. The number of cell layers is 2, 3, 4 and 5, using Relu activation function, the data from 2003 to 2016 are used as the training set, and the data from 2017 and 2018 are used as the verification set. The experimental results are as follows (see Table 3 and Fig. 2).
The relative errors of the number of neurons and the number of cell layers
The relative errors of the number of neurons and the number of cell layers
The relative errors of the number of neurons and the number of cell layers.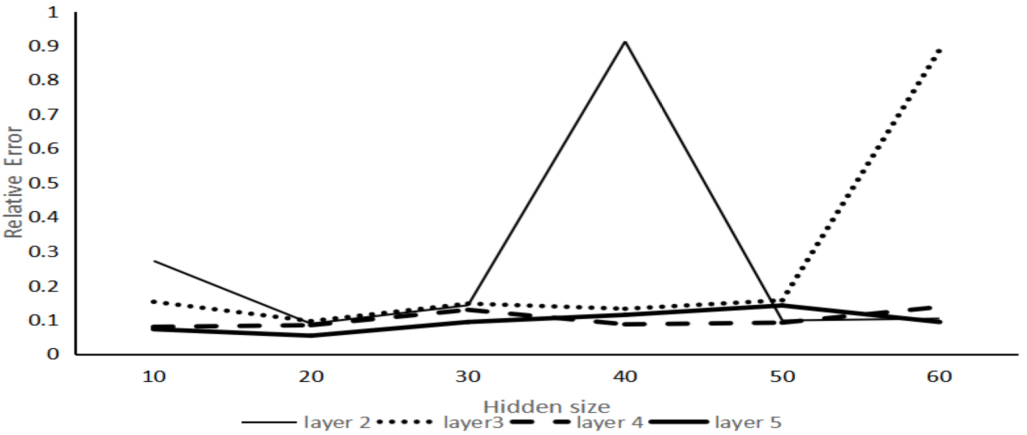
According to the experimental results, the average relative error rate of price prediction results in 2017 and 2018 is 5.35% when the number of neural units is 20 and the number of unit layers is 5, the verification value is close to the real value. However, whether it is the optimal result still needs further verification. Therefore, the data from 2003 to 2017 are adopted as the training set, and the data from 2018 as the verification set. The verification results are as follows (see Fig. 3).
According to the experimental results, the number of neurons is 20 and the number of layers is 2. The number of neurons is 20, and the number of layers is 5. Neuron number is 40, layer number is 4, these three points were close to the 2018 real value, but considering the relative error results in experiment 1, the number of neurons is 20, the layer number is 5 have the optimal prediction results, the above results show that the number of hidden layer neurons is too small to fit effect is insufficient, and continue to increase the number of neurons in ascension fitting effect is even worse. Finally, the number of neurons was set to 20 and the number of layers was set to 5.
Experimental results of abnormal points
In the previous paper, the abnormal sample point has been analyzed, but whether if this point will have an impact on price prediction needs to be further analyzed. The sample set contains data from 2003 to 2018, the data of 2006 are abnormal sample points. In order to verify whether this abnormal sample point has an effect on network training and thus affects the training accuracy of the network, this paper conducted 30 independent repeated experiments after eliminating the sample points in 2006. During analysis the influence of abnormal points, the experiment was set as the activation function with Relu function, the number of neurons was 20, and the number of hidden layers was 5, the result as shown in Table 4.
Experimental results of abnormal points
Experimental results of abnormal points
Training result.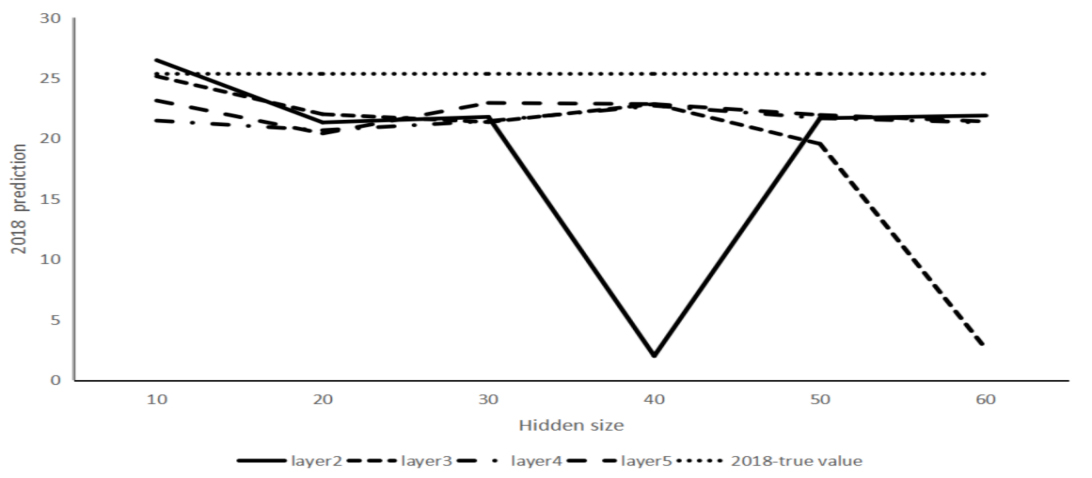
According to the above experimental results, eliminate abnormal sample points does not have a significant impact on the training. Therefore, under the current parameter setting, even if there are abnormal samples in the sample set, they will not have significant impact on the output results, which shows strong robustness. The main reason is that the maximum iteration number was used as the termination condition during the experiment, rather than the training error. This can not only effectively prevent over fitting, but also reduce the impact of data disturbance effective.
In addition, considering the number of training samples will have an impact on the experimental results, this paper respectively use 5 sample sets from 2012 to 2016, 10 sample sets from 2007 to 2016 and 14 sample sets from 2003 to 2016 to predict the tea price in 2017 and 2018. The predicted results are shown in Table 5.
Prediction results of different training sets
Prediction results of different training sets
Experimental results show that use 2012–2016 and 2007–2016 samples as the training sample set, the average relative error of the tea prices in 2017 and 2018 prediction are above 20%, compare with the 2003–2016 samples as the training sample have a large gap, so in order to the accuracy of experimental results, choose 2003–2016 as a training set of sample.
In order to further verify the effectiveness of MLP algorithm, the random forest algorithm is used to compare and analyze the price prediction results. As a common nonlinear prediction method, random forest is an algorithm that integrates multiple trees through the idea of ensemble learning. Its basic unit is decision tree, while its essence belongs to ensemble learning, a branch of machine learning. In this paper, X1 from 2003 to 2016 is used for regression to obtain the estimated values of X1 in 2017 and 2018. Using this method, X2, X3 and X4 values from 2003 to 2016 are successively regression to obtain the estimated values of X2, X3 and X4. The results are as follows (see Table 6).
Regression results of independent variables
Regression results of independent variables
Then estimated values of X1, X2, X3 and X4 in 2017 and 2018 are used to forecast the tea price in 2017 and 2018, and the forecast results are 21.04 and 19.84 (see Table 7).
Comparison results of MLP and Random Forest
The above table shows that use the method of random forests, average relative error rate reached 10.87%, while use the MLP method the predictive value of 2017 is 22.22 RMB and 2018 forecasts is 24.52 RMB, and the average relative error is 5.35%, which verify the feasibility and effectiveness of the MLP method, this method has a certain reference value to Pu’er tea industry.
Based on analysis of the tea prices influence factors, firstly, choose the activation function, secondly, established the MLP neural network model, analysis the number of neurons and the number of hidden layers, then analysis and verification of the abnormal point, finally, comparing with random forests by MLP method and verify the feasibility and effectiveness of the MLP method. Using the sample data from 2003 to 2016 as the training set and the sample data from 2017 and 2018 as the verification set, the average relative error rate of MLP was 5.35%. This method can provide a reference for the government and has certain theoretical and practical significance.
However, due to the small sample data of Yunnan Pu’er tea industry, this paper may not consider the influencing factors comprehensively, which reduces the accuracy of MLP neural network to a certain extent, which needs to be further analyzed and improved in the future research.
Footnotes
Acknowledgments
National Natural Science Foundation of China (61762088): Intelligent method of urban logistics coordination under urban logistics service platform.