
Abstract
On the basis of summarizing low-load electric vehicle frame research, taking pure electric patrol vehicle frame as research object of lightweight design, the section size parameter optimization method is adopted to achieve lightweight targets design. According to bearing capacity of the frame, a mathematical model is established, which takes the minimum mass of single longitudinal beam as objective function and the strength and stiffness as constraints condition. The initial-design frame is optimized in workbench. The results show that overall mass after optimization is reduced from 80.532 kg to 70.409 kg, and the frame mass induced by 12.6%. Then frame statics analysis before and after optimization is carried in workbench and the results show that the frame before and after optimization meets the corresponding strength and stiffness requirements under bending and torsion conditions. Finally, frame modal analysis before and after optimization shows that no resonance phenomenon occurs in the frame before and after optimization.
Introduction
With the rapid development of the automotive industry and increasingly fierce competition, improving automobiles quality, reforming automobiles manufacturing technology and reducing the overall production cost have gradually become the goals pursued by automobile companies. For traditional vehicles, the lightweight frame can effectively reduce the fuel consumption rate and exhaust emissions, so as to achieve energy conservation and emission reduction. For electric vehicles, reducing frame mass can increase the battery driving range after a charge, and increase the vehicle’s power performance. Researches find that reducing electric vehicles mass has a significant effect on increasing driving range and reducing energy consumption. If the mass is reduced by 100 kg, the driving range will increase by 1.2%, and the energy consumption of 100 km will be reduced by 1.6% [1]. According to statistics, body and frame mass accounts for about 40%
Frame model
Define materials and loads
The frame material is Q235, and its characteristic parameters are shown in Table 1. Since the power battery and the motor are large in volume and mass, it is not suitable to be arranged in the front and middle of the electric patrol. Therefore, motor rear drive will be adopted in the electric patrol vehicle, and the power battery will also be placed in the back of the body [6, 7].
Main performance parameters of Q235
Main performance parameters of Q235
The total mass includes 4 members (include a driver), the average mass of each member is 75 kg. All loads on patrol vehicles are shown in Table 2.
Load on the frame
3D model of the frame.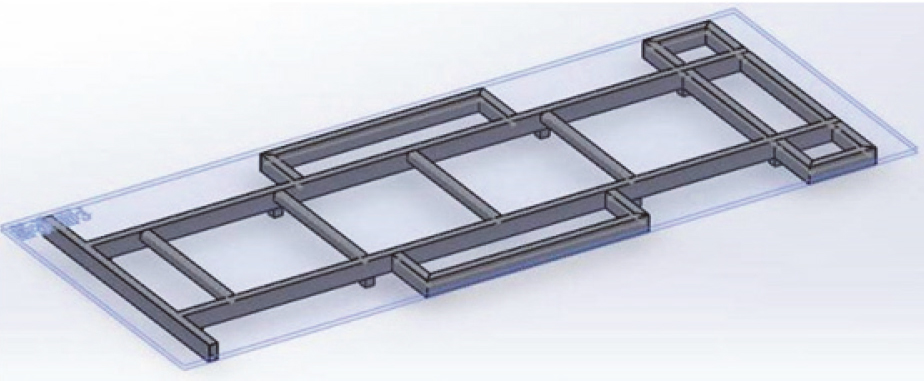
Since the electric patrol vehicle belongs to low-load electric vehicle, the load on the frame is not large, mainly including members, power battery, motor, body and other accessories. Currently, most electric vehicles are welded with square steel and angle steel [8]. A three-dimensional model of the frame with the peripheral frame as the main design standard is built, and all hollow square tubes in the frame are established by welding. Finally, the frame is designed to be 3000 mm long, with two longitudinal beams 700 mm apart in space, total width of the frame is 1200 mm, the beam face size is 40
Frame lightweight optimization design
Design variables
In mechanical design, according to different design schemes, a group of design parameters with different values are usually selected to represent the variables of optimization design, and the optimal solution of objective function is obtained by setting corresponding constraint conditions. According to the possibility of the actual optimization of the frame size, the optimization is mainly carried out from the dimension parameters (such as the rotary inertia, the thickness of plate, the cross section size of the bar beam) [9].
When the car is working, the frame will not only be subject to load impact from ground, but also be subject to various forces generated by various parts inside the car, which makes it difficult to carry optimization analysis for the whole frame’s lightweight. In addition, the longitudinal beam on both sides is the main load-bearing structure and it is long length and large mass. In order to reduce lightweight analysis complexity of the overall vehicle frame, the section size optimization design is only carried out for these two longitudinal beams size [10]. On the basis of the original frame design, the lightweight design will take the inner rectangle of the longitudinal beam section as the optimization object. Since the size of the outer rectangle is fixed, the wall thickness
Optimization variables of the frame longitudinal beam
Optimization variables of the frame longitudinal beam
The section dimensions of longitudinal beam are shown in Fig. 2.
Section size of longitudinal beam.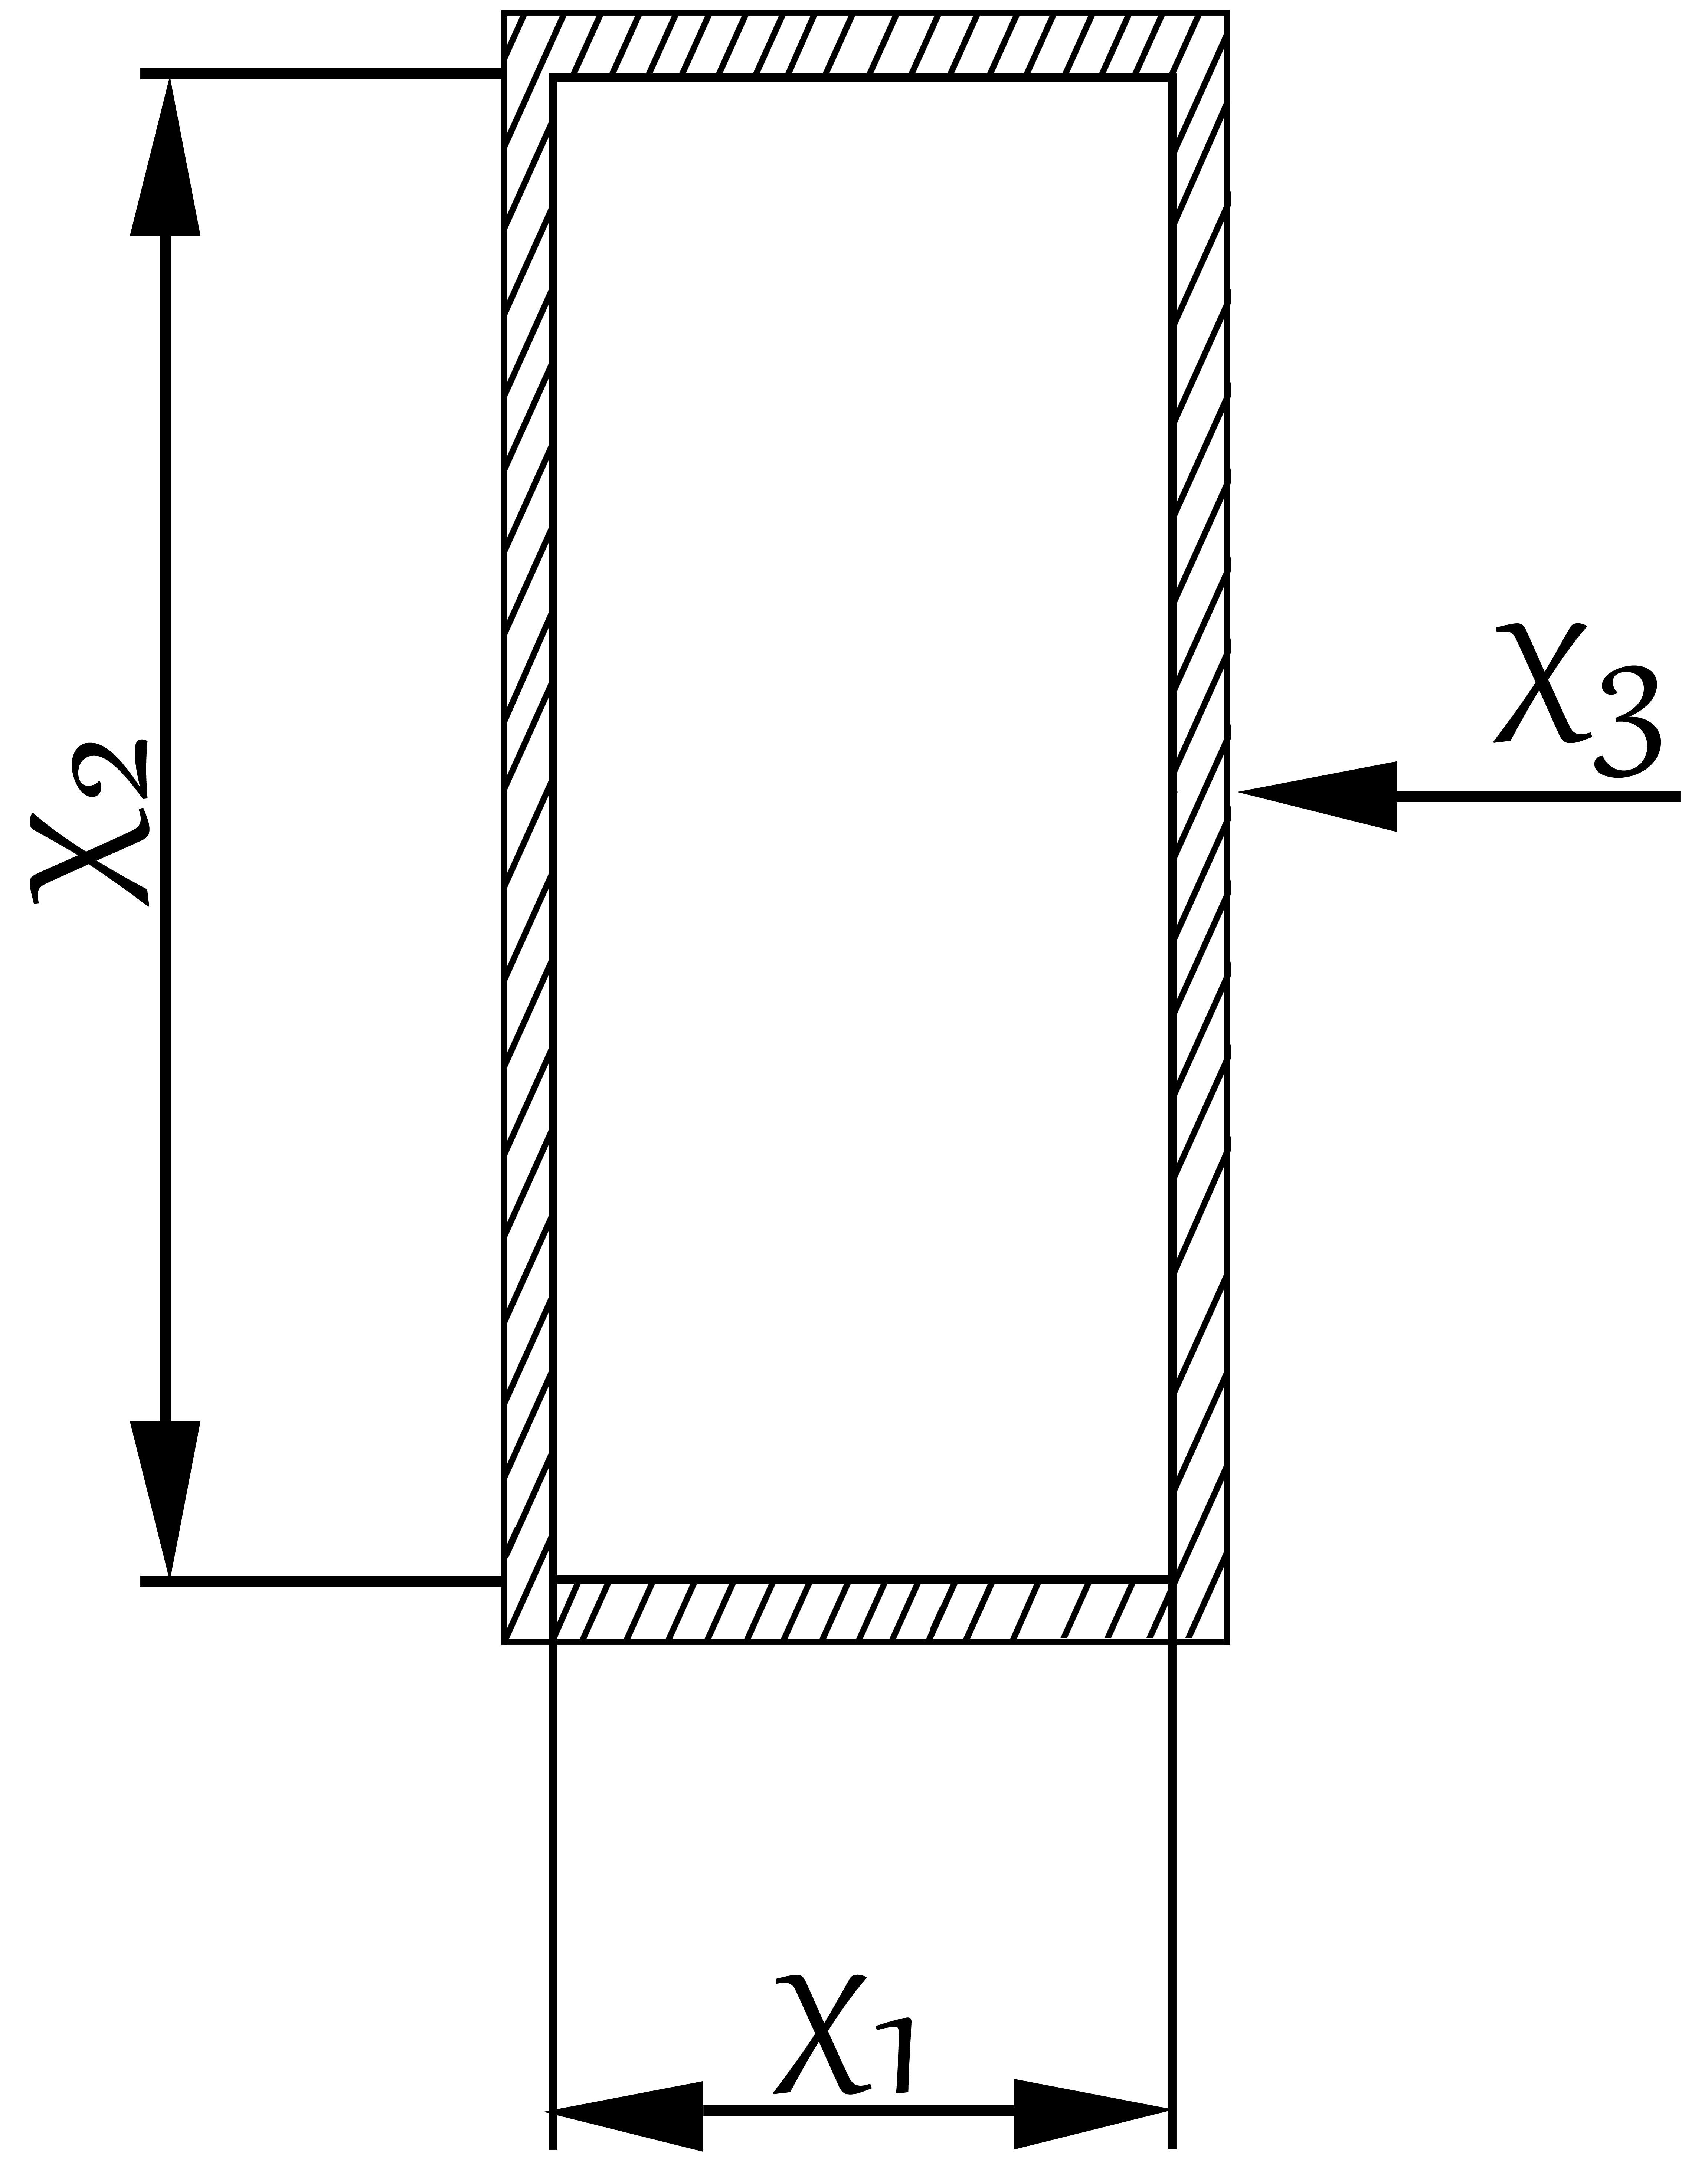
Under the premise of ensuring the safety, longitudinal beam of the frame is the key to control the overall production cost of vehicle frame. The optimization goal of lightweight design is to reduce the total volume of the vehicle frame by finding the optimal section area of the longitudinal beam, so as to achieve reducing frame mass. Therefore, the objective function is:
Where
The optimization design problem not only needs to make the design index what we selected scheme reach the best value, but also must meet some constraints condition. Frame strength and stiffness are particularly important in electric vehicles design. At present, there is no uniform industry regulation for stiffness and strength evaluation, and there is no clear standard specification requirement in relevant automobile industry. Due to the large number of models, the implementation requirements of enterprises are different.
According to the boundary condition of the design variable
The maximum bending stress of the frame shall not exceed the limit of the allowable stress, that is to say:
Where
Where
The maximum deflection of the stringer shall be less than or equal to the allowable deflection:
Where
Where
Formula for calculating frame bending stiffness:
Where
Formula for calculating frame torsional stiffness:
Where
The total mass of each part of frame is 890 kg, converted to gravity equivalent to 8722 N. In the optimization analysis, this gravity is the load to be borne by two longitudinal beams. Considering the uneven load distribution on the two beams, therefore, the load on a single longitudinal beam can be calculated with 4700 N. Firstly, single longitudinal beam 3D model is built, and then a corresponding supporting surface is built beneath the lower part of longitudinal beam to simulate fixed frame. Then the 3D model is imported into workbench for finite element analysis. After finite element analysis, the deformation cloud diagram and stress cloud diagram of single longitudinal beam are shown in Fig. 3. Results show that, under this load, the maximum deformation of a single longitudinal beam is 0.1 mm and the maximum stress value is 15.1 MPa.
Deformation cloud diagram and stress cloud diagram of single longitudinal beam.
Then, an optimization analysis system is created in workbench. The initial length and width of the internal rectangular section were set as 74 mm and 34 mm respectively. Workbench will automatically adjust the wall thickness according to this size, and then take longitudinal beam mass and the maximum stress value in the calculation results as variable parameters, which obtains a series of experimental parameter results. Experimental parameter results are shown in Fig. 4.
Experimental parameter results.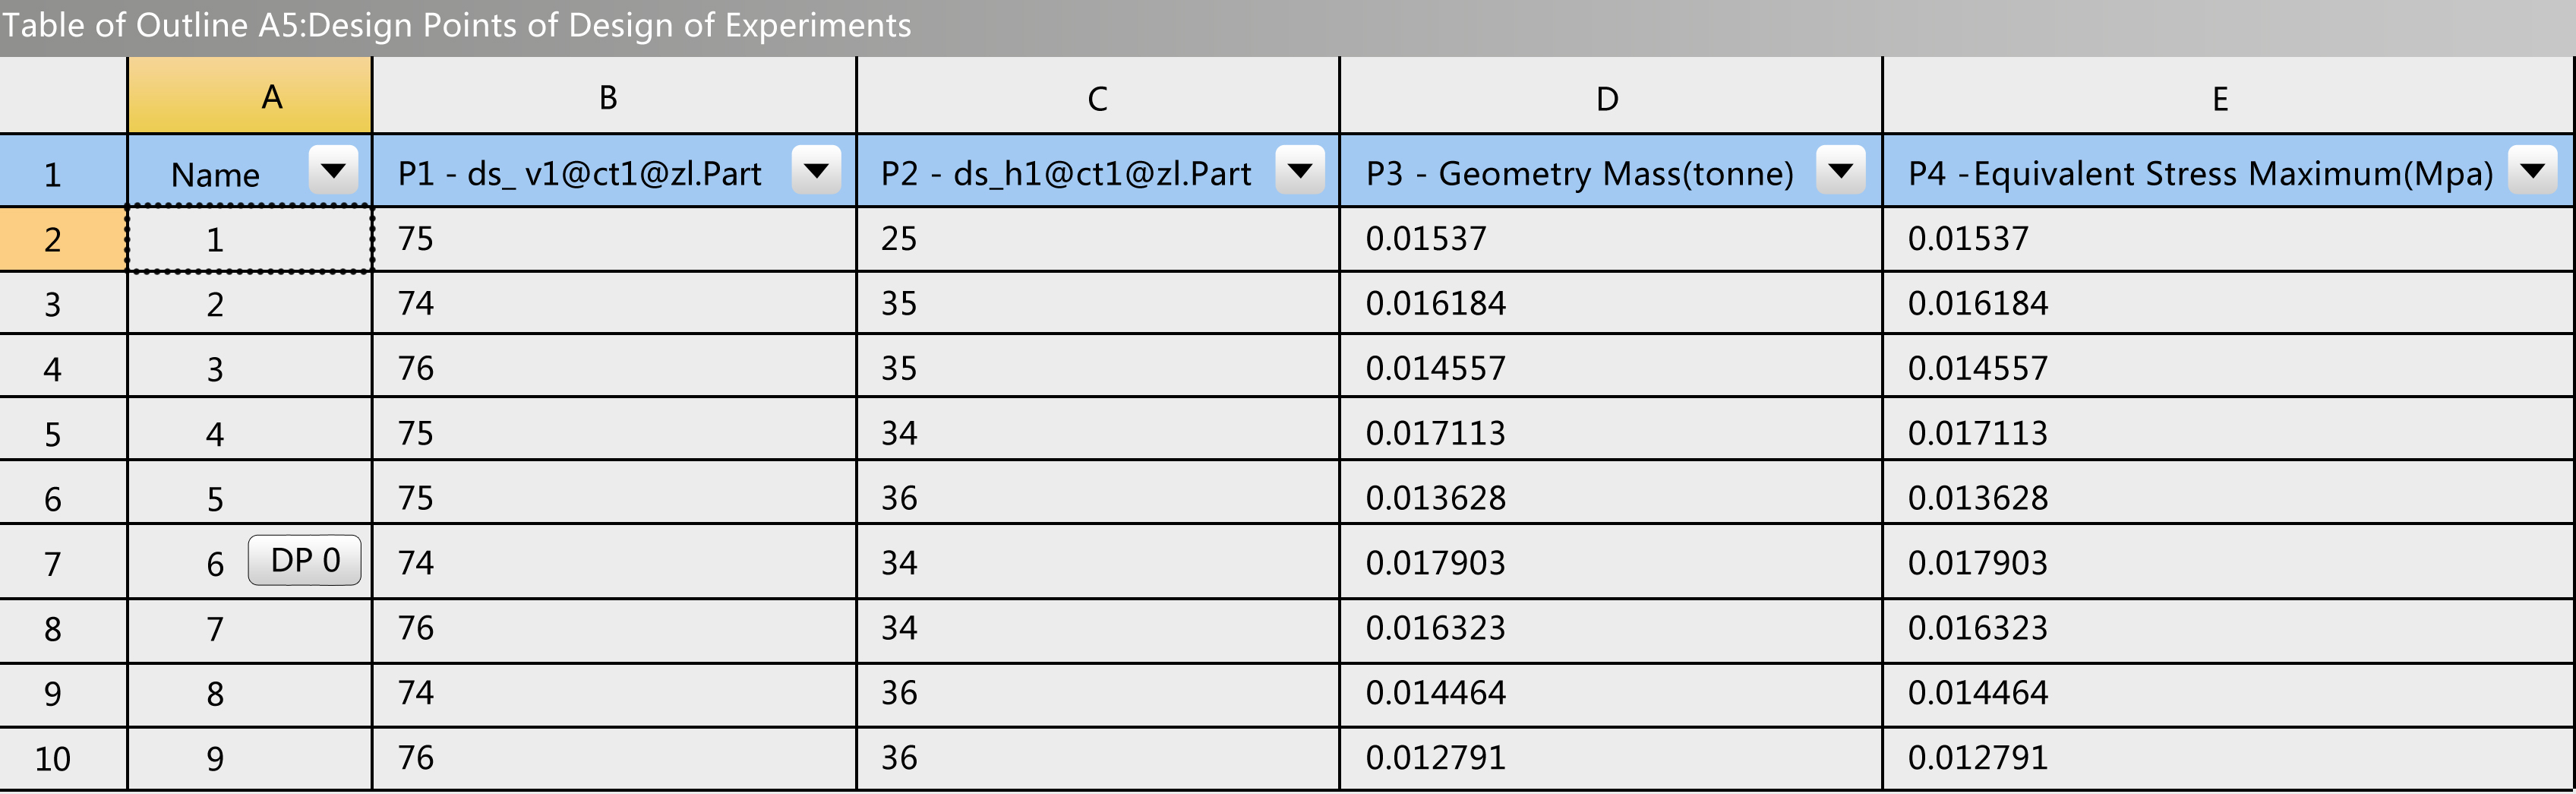
Figure 4 shows the relationship between internal size, weight and maximum stress. It can be clearly seen that with the decrease of size, the mass decreases while the maximum stress increases, which is accord with the law completely.
And then optimization parameters and constraint conditions are set. The yield limit stress of Q235 is 230 MPa and the safety factor is 1.4, so the maximum allowable stress is 167 MPa. The actual value should not exceed the maximum allowable stress, 164 MPa is available here. The constraint conditions and objective functions of each parameter are set in the optimization design interface, as shown in Fig. 5.
Optimization of parameter settings.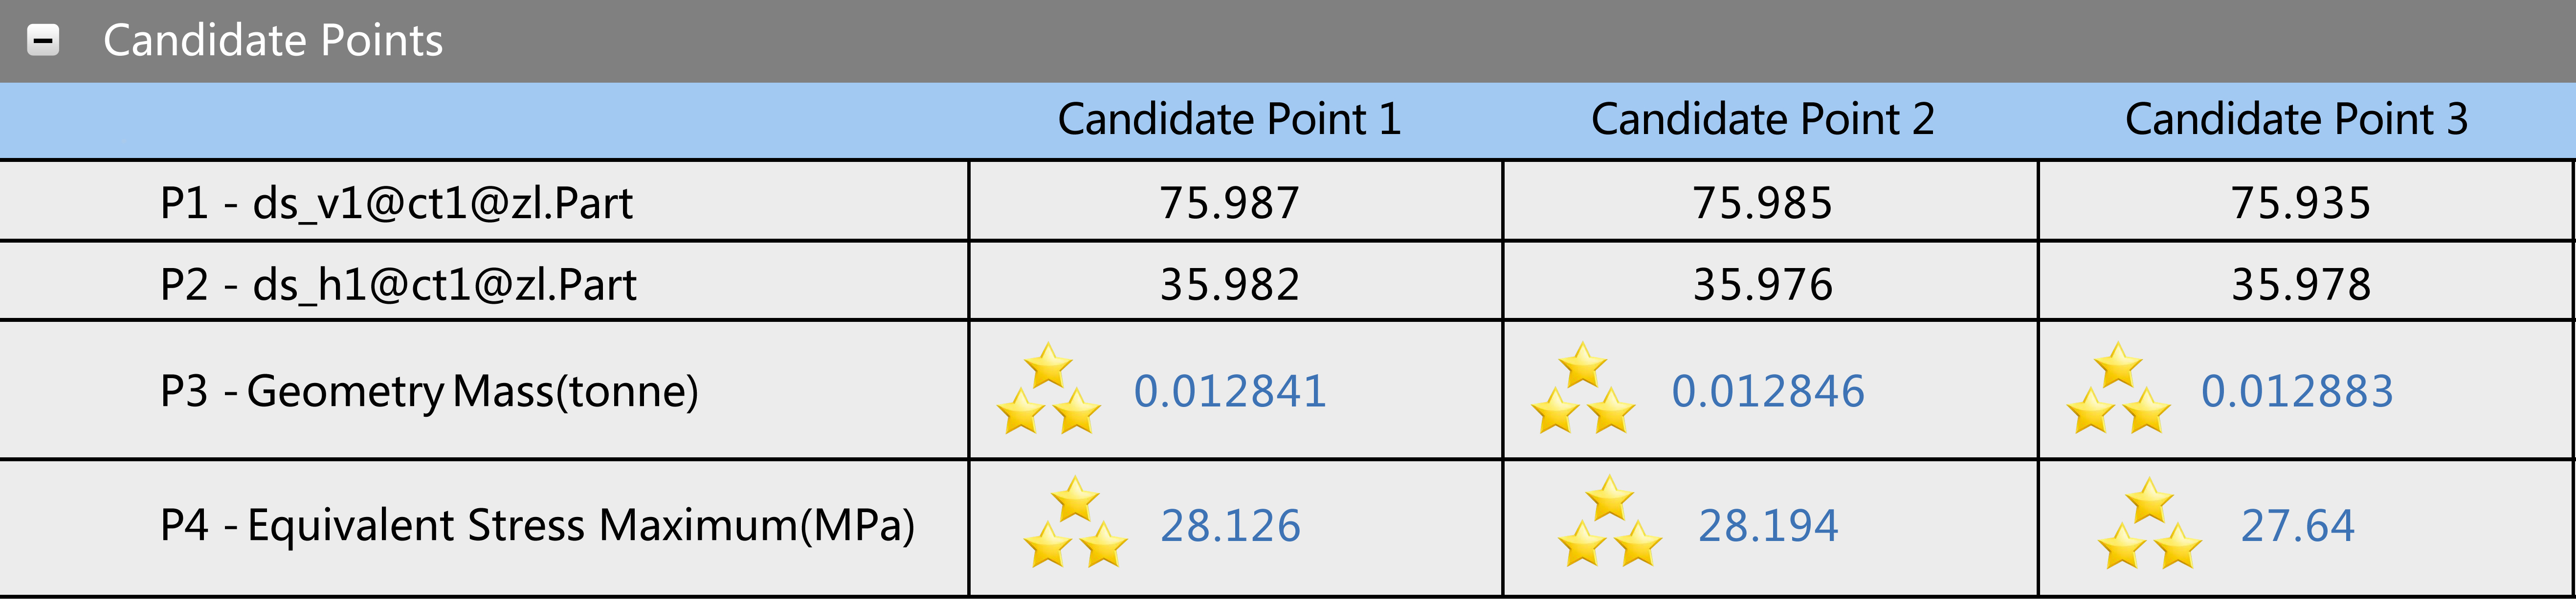
Optimization results.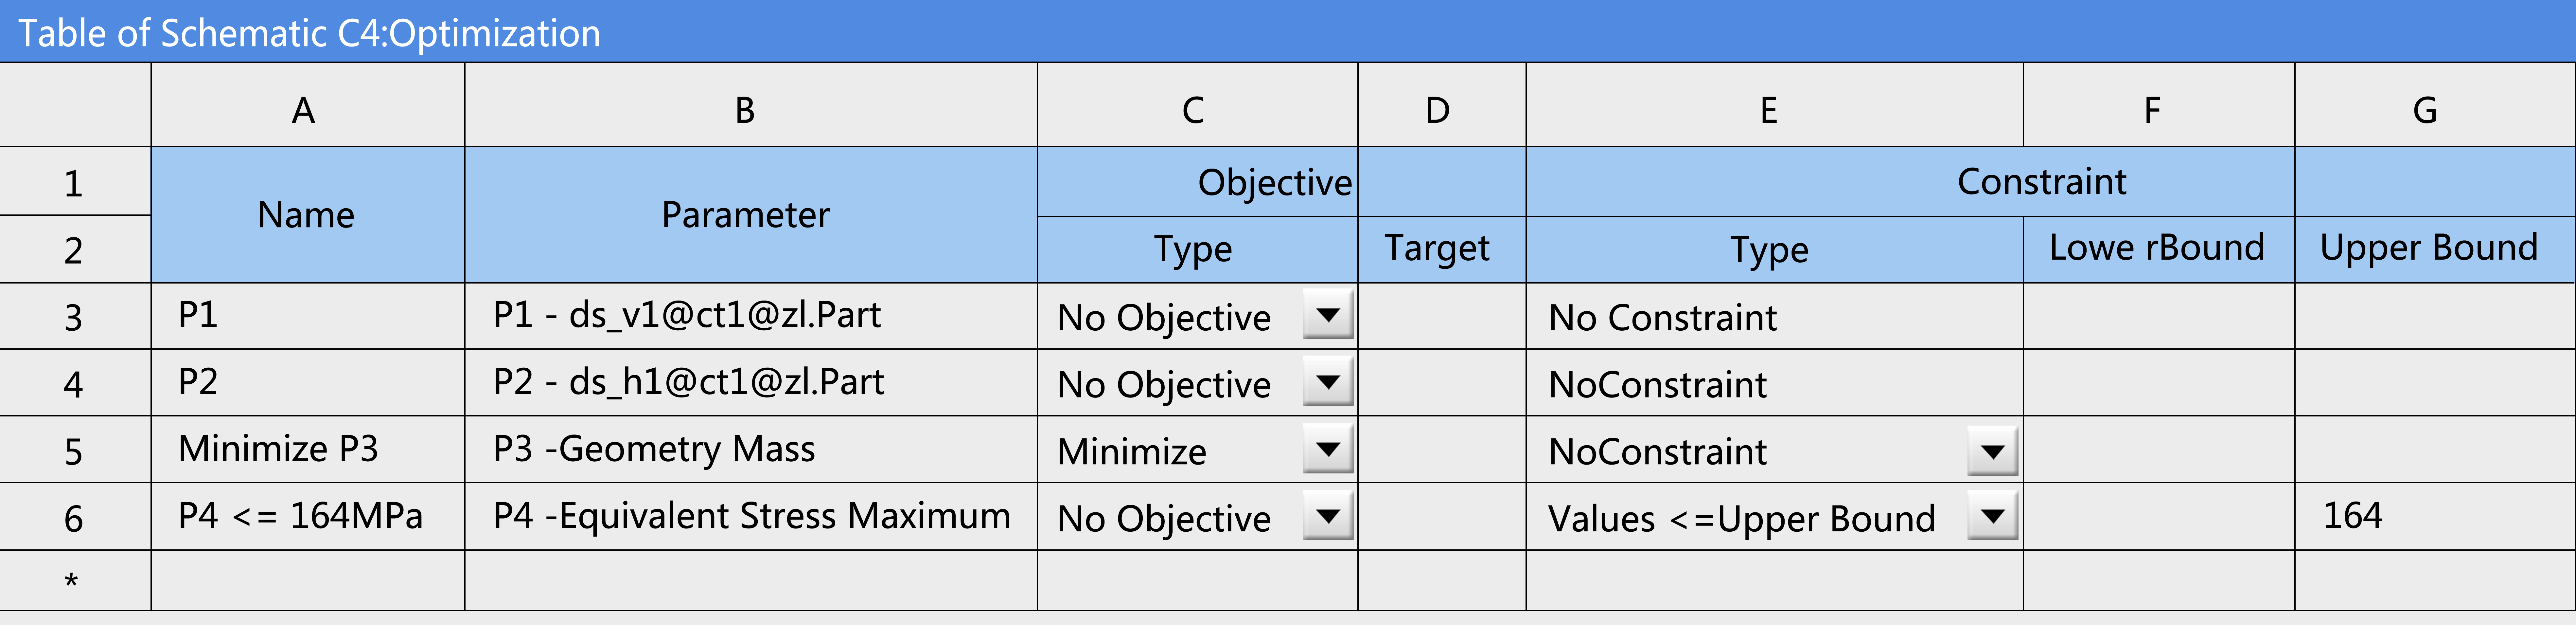
After parameters are set, calculations and results can be viewed. Select “update” in the optimization design panel and wait for finishing calculation, as shown in Fig. 6.
Figure 6 is the optimization result. The optimal result is that internal section height is 75.978 mm and width is 35.982 mm. The total frame mass after optimization is 70.409 kg, and the total frame mass before optimization is 80.532 kg, which reduces by 12.6%. The optimization effect is obvious, and the goal of frame lightweight design is achieved.
Analysis prepare
When a car is working, the frame will form different conditions. Naturally, the load on the frame will be different, the bending conditions and the bending and torsional conditions have a greater impact on the frame structure [11].
Considering the influence of dynamic load on the frame, a dynamic load coefficient is usually introduced to check frame stress and deformation. In the FEA, load multiplied by the dynamic load coefficient is applied to the corresponding parts. The dynamic load coefficient is related to the speed, vehicle structural parameters, the road condition and other external conditions [12]. Because target frame is suitable for vehicles with low speed but large weight, and the bending condition is the main condition, the dynamic load coefficient select as 1.5. In addition, mainly driving on urban roads, there are fewer cases of torsion conditions, so the dynamic load coefficient of torsional condition select as 1.1.
Bending condition
Bending condition refers to simulating frame deformation and stress distribution under full load. The load on the frame needs to be multiplied by the dynamic load coefficient 1.5, that is 8722
Deformation cloud diagram and stress cloud diagram.
Results analysis and discussion:
It can be known from (a) and (b) in Fig. 7, under full load, frame deformation mainly occurs in the middle and back, the maximum value before optimization is 0.26 mm and after optimization is 0.29 mm, which indicates that frame bending stiffness is good. It can be known from (c) and (d) in Fig. 7, Most of the stress is small, and the maximum stress appears in the middle of the longitudinal beam. The maximum stress is 16.1 MPa before optimization and 27.4 MPa after optimization, which is far less than the allowable strength of the material 167 Mpa. That is to say, frame stress under bending condition meets the requirement.
Torsional condition mainly simulates the influence that a side wheel raised or suspended on the frame deformation degree and stress distribution when the vehicle is driving on the bumpy road. The load imposed on the frame needs to be multiplied by the dynamic load coefficient 1.1, that is 8722
Deformation cloud diagram and stress cloud diagram.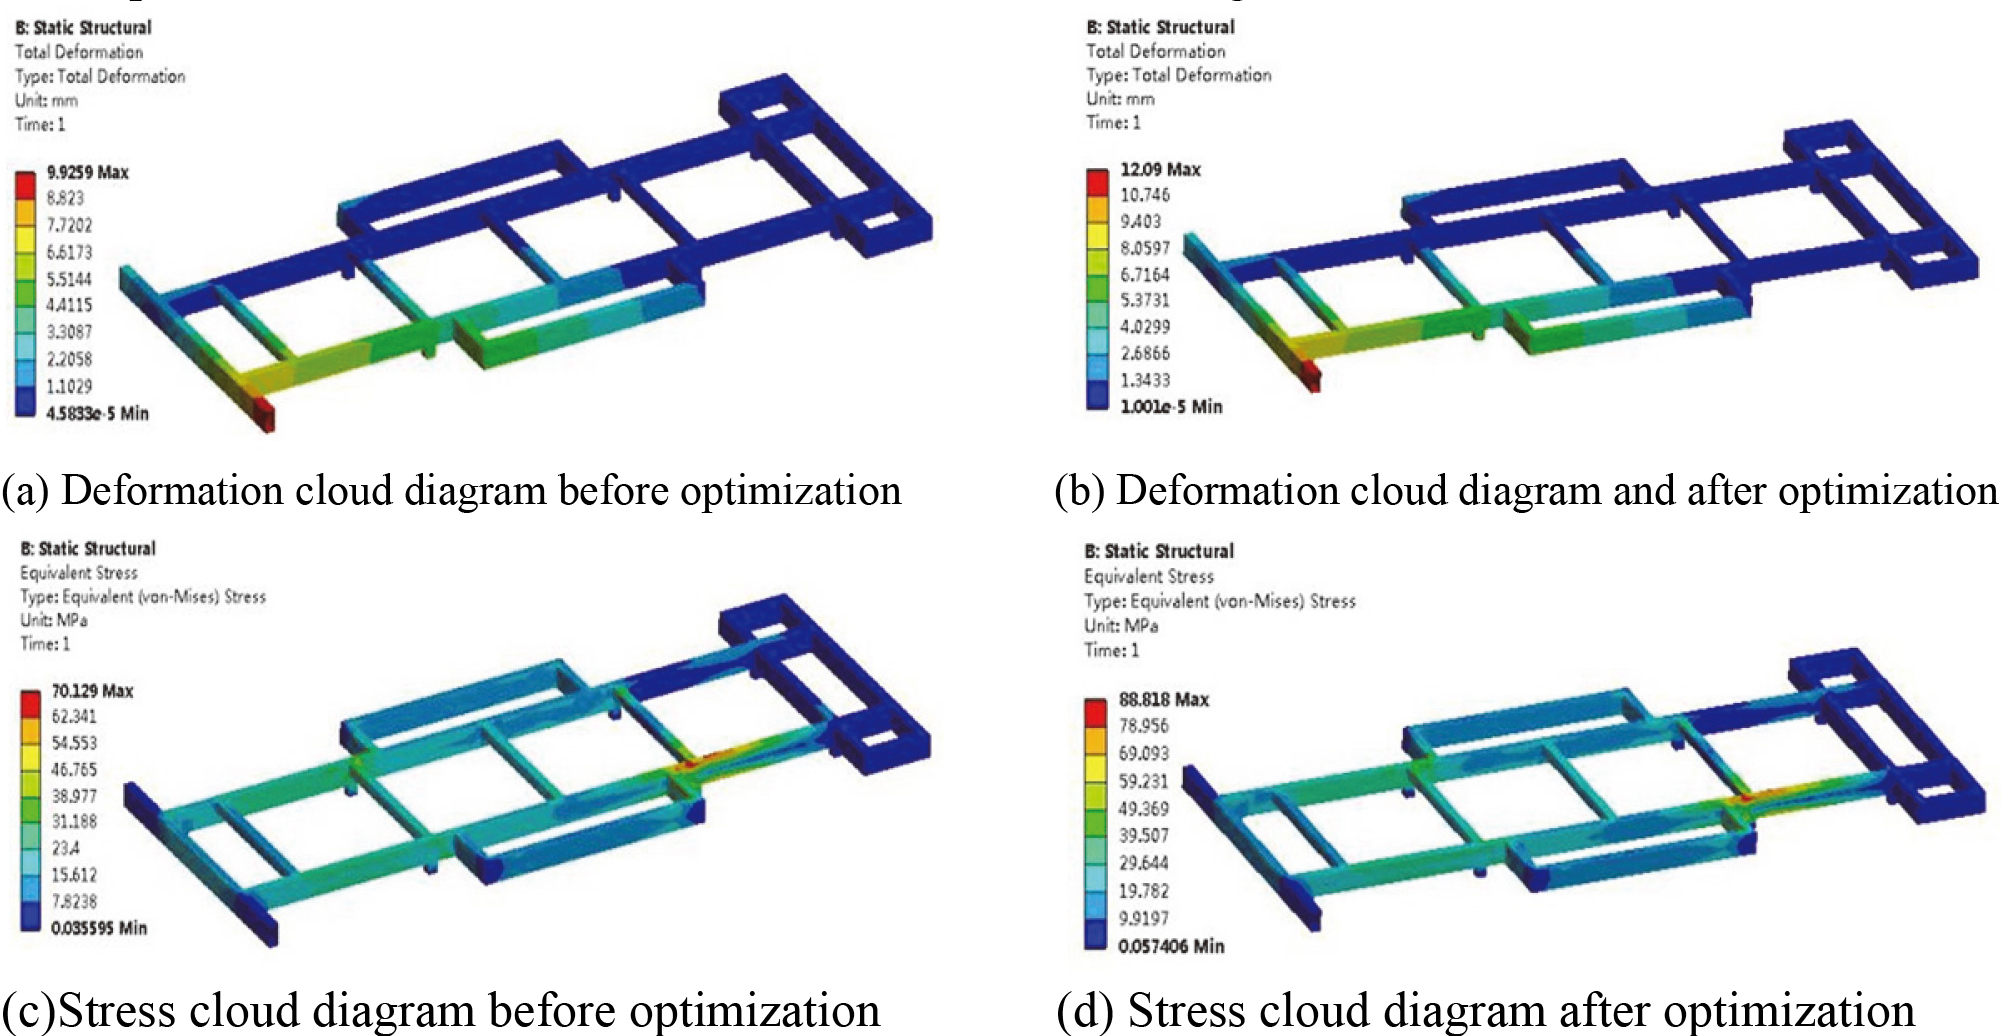
Results analysis and discussion:
It can be known from (a) and (b) in Fig. 8, under full load, frame deformation mainly occurs in the left front end of the frame. Before optimization, the maximum deformation is 9.9 mm; after optimization, the maximum deformation is 12 mm. It can be known from (c) and (d) in Fig. 8, most of the stress values are small, the maximum stress before optimization is 70.1 MPa, and after optimization is 88.8 MPa, all of which are less than the allowable strength of the material 167 MPa and meet the requirements.
As a complex vibration system, the resonance frequency of the frame can be determined through modal analysis, and frame deformation degree under different loads can be known, so as to fully understand vehicle’s motion characteristics [13, 14]. To analyze the vibration characteristics of the optimized frame, the first six orders modal frequency of the optimized frame are determined by the FEA. The modal deformation cloud diagrams of the first 6 orders before optimization are shown in Fig. 9.
The modal deformation cloud diagrams of the first six orders of the optimized frame are shown in Fig. 10.
The corresponding meanings of each order mode are analyzed below, as shown in Table 4.
Optimized frame modal frequency and mode
Optimized frame modal frequency and mode
The modal deformation cloud diagrams before optimization.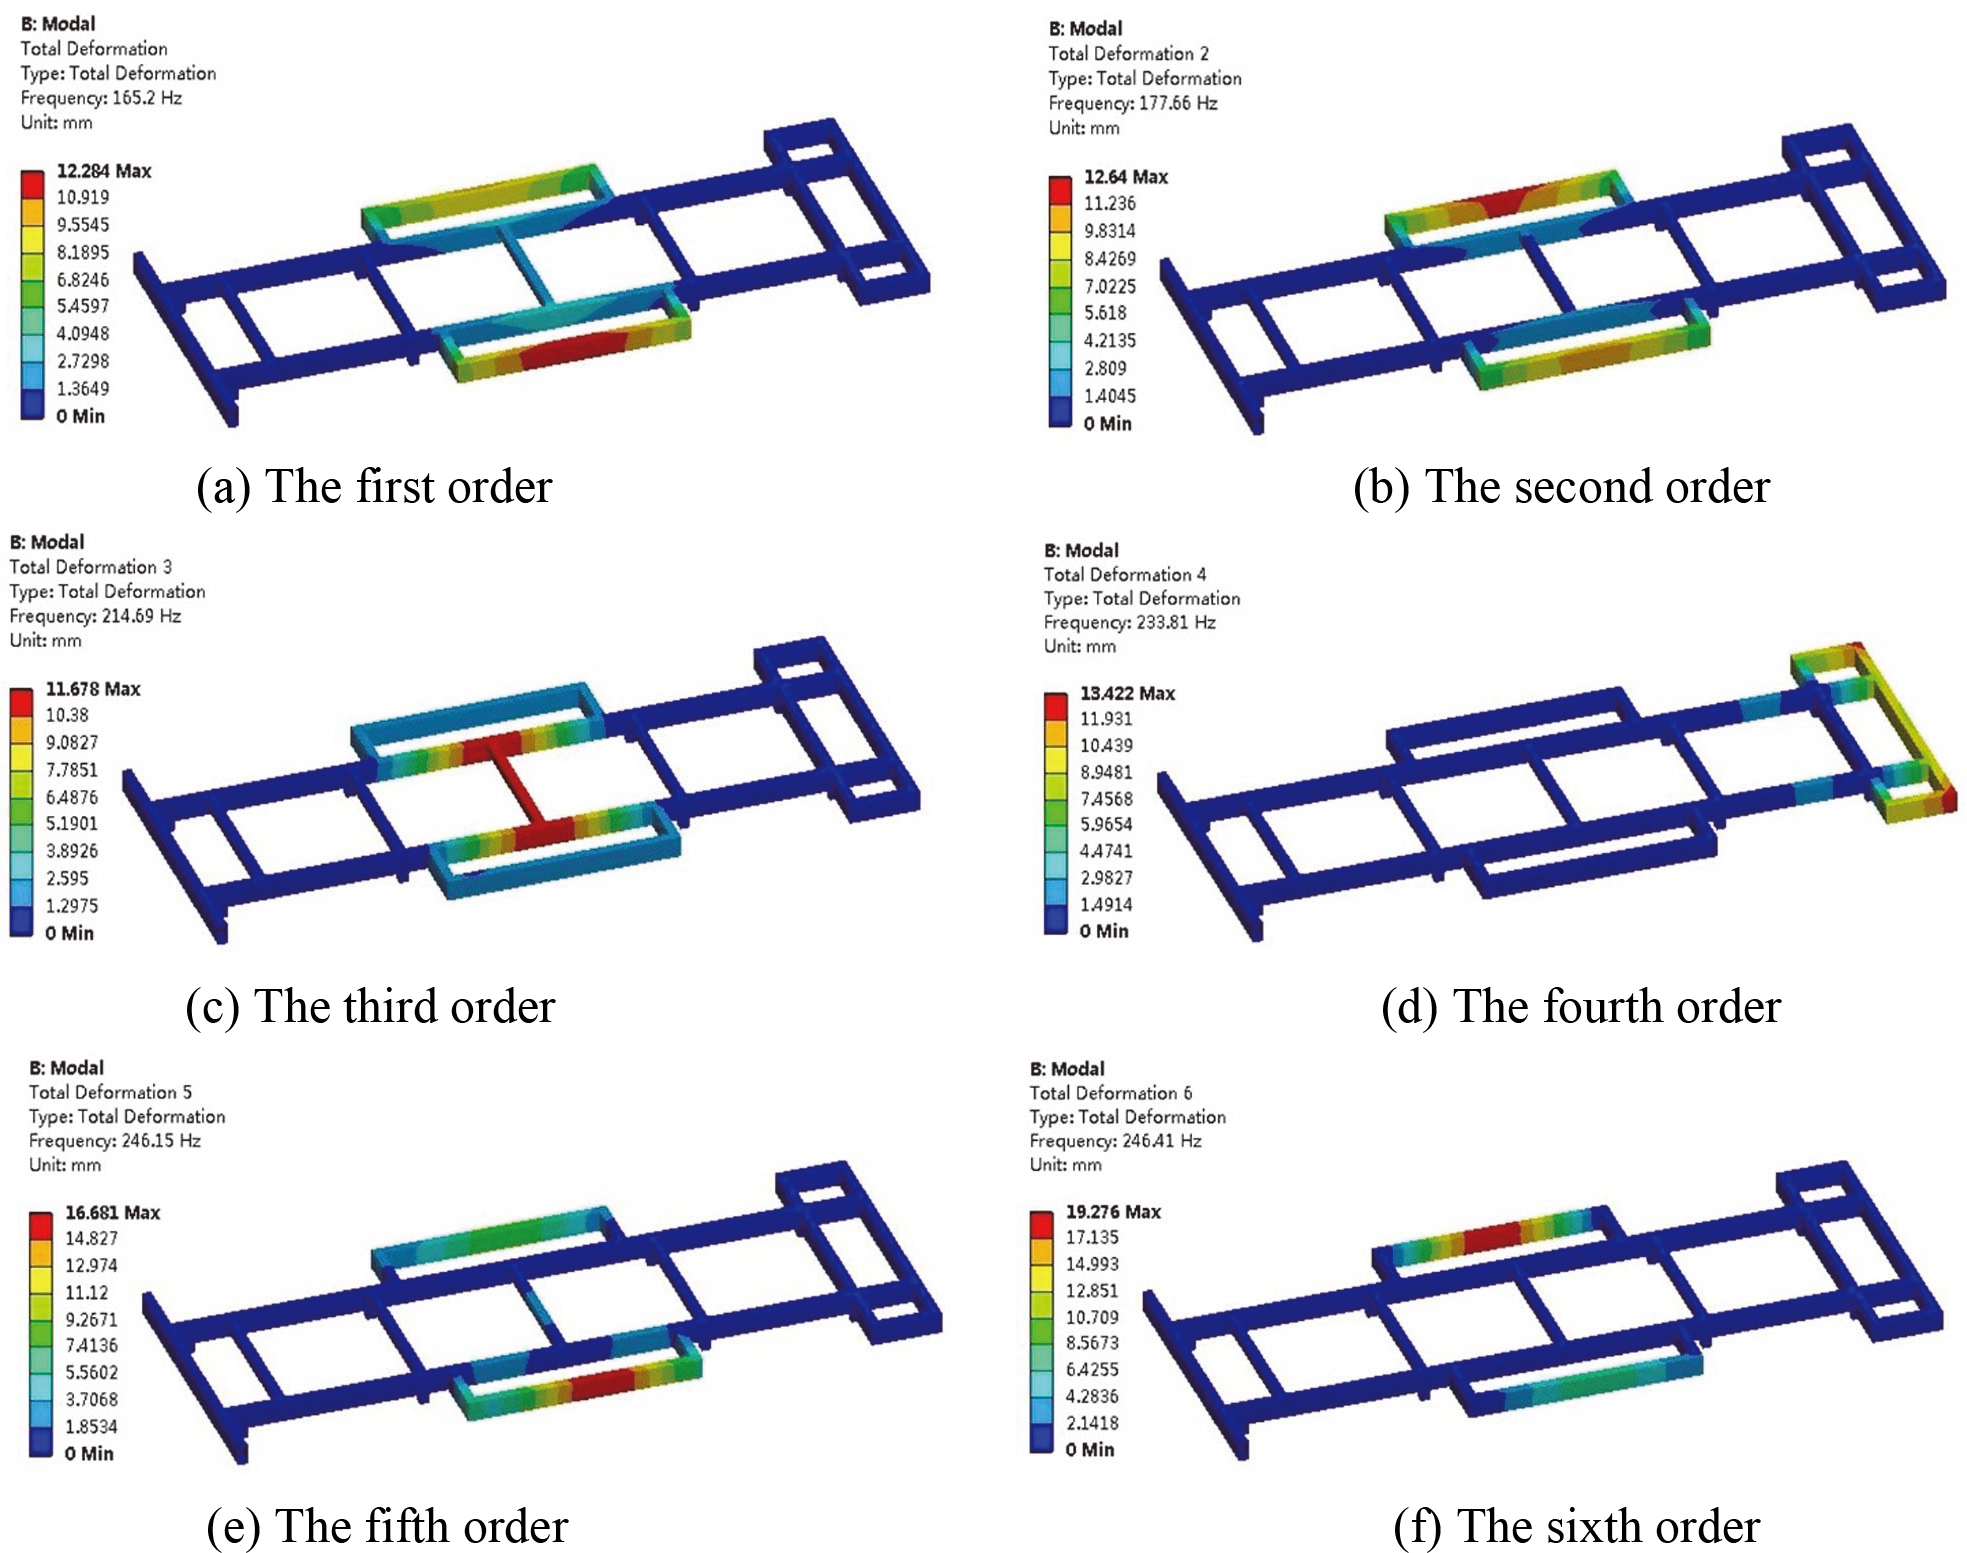
The modal deformation cloud diagrams the optimized frame.
Result analysis and discussion:
The designed electric vehicle frame is mainly used for urban driving, and the road conditions are good. The excitation frequency for frame is generally lower than 3 Hz, and the excitation component is large. The frequency of each organ in the human body is 3–17 Hz; Motor excitation frequency is generally 20–3000 Hz, but the excitation component is small. As can be seen from Figs 8 and 9 and Table 4, the frequency and mode of the frame are basically the same before and after optimization. The modal frequency is different from the above frequency. Although the right part will overlaps under low frequency, the overlapped part takes up a very small proportion in overall excitation frequency of motor, accounting for only 0.4%, and generally no resonance will occur.
After optimization, frame mass is reduced from 88.532 kg to 70.409 kg, with a mass reduction ratio of 12.6%, obtaining obvious optimization effect and achieving lightweight frame targets. Frame deformation and stress model before and after optimization were analyzed under bending and torsional conditions, and the maximum deformation before optimization was 9.9 mm and after optimization was 12 mm. The maximum stress before optimization was 70.1 MPa, and after optimization was 88.8 MPa. Although the stress and deformation increased, it still met the requirements of material use and design. The modal analysis of the optimized frame shows that frame vibration frequency and formation meet the design requirements. At the same time, the vibration frequency can stagger road excitation frequency and human organs vibration frequency. Although there is a small overlap part with motor excitation frequency, the overlap part only accounts for 0.4%, which can effectively avoid resonance.
Footnotes
Acknowledgments
This program was supported by the 2018 Research Program of Education Office of Sichuan Province, China (Grant: 18ZA0293). This program was also supported by the 2019 Research Program of Panzhihua University, China (Grant: 2019ZD002).