
Abstract
A large number of practical applications of the recommendation system found that the novelty of the recommendation results and the user satisfaction are more closely related, making the novelty recommendation recently widely concerned and studied. Many novelty recommendation algorithms used the popularity of the item to measure novelty, but this method is too simple, and the change of item popularity is more reflective of its novelty. According to the product life cycle theory (PLC), this study proposed a novelty recommendation algorithm that recommends item that be not popular now and may be popular in the future to improve the novelty of the recommendation results, The time change of the popularity of the items to be recommended is analyzed, and the future popularity of the items are predicted by analogy. Two strategies for selecting recommended selection are selecting future popular items (the predicting popularity-based filtering Algorithm, PP algorithm) and excluding future recession items (the Excluding Recession-based filtering algorithm, ER algorithm), according to the definition of novelty of the item, recommended the novelty items to the target user. The effectiveness of the proposed algorithm was verified through an offline experiment. Results indicate that PP algorithm can significantly improve the accuracy and novelty, but seriously sacrifice the coverage and reduce the ability of the recommendation system to mine the long tail items when the number of alternative items N is small, the novelty of the recommendation list of the ER algorithm is remarkably higher than that of traditional algorithms, the novelty is high when the quantity of alternative sets reaches around 350, where the average popularity of the recommendation list declines by 40%, and the coverage is elevated by 150%, thereby improving the ability of the proposed system to extract all kinds of items. This study serves as reference for the improvement of user satisfaction with recommendation systems.
Introduction
In the past decade, the mining and analysis of data and complex networks has made tremendous progress. Due to the increasing problem of Internet information overload, the recommendation system has become one of the most important research topics in the industry and academia. The accuracy of the current recommendation system is not the only topic of discussion. Because of the closer relationship between other indicators such as novelty and diversity and user satisfaction, novelty recommendation and diversity recommendation have recently received much attention and research [1, 2, 3]. However, novelty and accuracy are often not balanced, and improvements in the novelty of the recommendation system often reduce accuracy, and vice versa. Therefore, most of the novelty and diversity recommendation algorithms lead to a decrease in accuracy [4]. One difficulty in the novelty recommendation is that the recommended item is unknown to the target user. However, it is very difficult to judge the unpredictability of a item to the target user through the historical data of the user. Users can learn about a item from many sources, and this information cannot be reflected in a specific dataset. Therefore, many novel recommendation algorithms assume that the more popular item users are more likely to know [5]. However, the popularity represents “public wisdom” [6]. The algorithm of most recommendation systems is to recommend the composite item to the target users according to the “public wisdom”, and to eliminate the popularity in order to improve the novelty of the recommendation system. A high item will inevitably reduce the accuracy of the recommendation system. The popularity is related to the accuracy of the recommendation system and the novelty of the recommendation system. Therefore, how to use the popularity indicator reasonably in the recommendation algorithm is the key to novelty recommendation.
PLC describes the change of sales volume over time from the time of entering the market to being eliminated by the market, and analyzes the market status and corporate marketing strategy of each stage in the whole process. Product life cycle theory points out that when products enter the growth and maturity period, sales volume increases significantly, and products are accepted by most customers in the market. The popularity of a item refers to the number of interactions in which the item is evaluated, purchased, and browsed by the user. In essence, the popularity of the item and the sales volume of the product are the same, so the time series data of the item popularity can be used to predict the item. The future development trend, and then judge the life cycle stage of the item, to analyze the possibility of the item being accepted by the user. Recommending non-popular products can improve the novelty of the recommendation system, and recommending items that become popular in the future can guarantee the accuracy of the recommendation system. In this regard, we asked four research questions:
Is the change of item popularity consistent with the characteristics of product life cycle curve? How to predict the trend of item popularity? How to select alternative item sets? Is it better to rule out the popular recession items or to choose the popular ones in the future?
Novelty recommendations have gradually attracted increasing attention in terms of their accuracy in recent years. For the user, the novelty of the item is inversely proportional to the likelihood that the user knows or is familiar with the item [7]. The more long tail items included in the recommendation list, the greater the novelty, so the average popularity of the recommended list [8] or the average self-information indicator can be used to measure its novelty [9].
The popularity-based novelty recommendation is currently the most used method. Shani [10] believes that popular items and active users are less recommended, so the weights should be reduced in the evaluation indicators, that is, the user activity and item popularity should be considered in the accuracy index of the ranking weights. This adjustment can increase the possibility of recommending unpopular items. Celma and Herrera [11] also proposed to increase the effectiveness of the recommendation system by considering the popularity in the accuracy indicator. Jinoh et al. [12] proposed a novelty recommendation based on personal pop preferences, using KL distance and EMD (earth Mover’s Distance) to calculate the distance between two popular frequency distributions. The popularity frequency distribution of the recommended list is as close as possible to the user’s individual. The popularity frequency distribution, while ensuring that the predicted score value is in a higher range. Fabiano et al. added the novelty index (defined label novelty to IFF (Inverse Feature Frequency), which is -log p(tag)) as an attribute and objective function to the label recommendation based on genetic algorithm. Experiments were conducted in LastFM, YouTube and YahooVideo, which improved the novelty and diversity of recommendations [13]. Xu proposed a new method for calculating the similarity in a binary network. When the computational nodes interact with each other, the popularity is added to replace the traditional cosine algorithm, which improves the accuracy and diversity of the recommendation system [14]. Zhou et al. adopted a hybrid algorithm to solve the inverse phenomenon of accuracy and diversity in the recommendation system [15]. Adomavicius and Kwon used a bipartite graph maximum matching method to maximize the diversity of recommendation systems [16]. However, most of the novelty and diversity recommendation algorithms lead to low accuracy, which is to obtain higher novelty and diversity by sacrificing accuracy. The main reason is that these algorithms improve novelty and diversity by reducing the popularity of recommendation lists, and the popularity and accuracy of the item is directly proportional.
Hong and Junhua found that the newly recommended items with extremely low popularity are not known and novel by the majority of users and measured the novelty of recommendation results on the basis of the proportion of new items occupied in the recommendation list [17]. Chou et al. defined the percentage occupied by artists, who are known by users, as the novel music recommendation list [18]. The abovementioned studies have only evaluated the overall novelty of recommendation results and ignored the novelty of items. In terms of scoring time, Chen et al. introduced the concepts of “renovator” and “potential follower” and believed that the items rated by renovators are novel for target users [19]. Kapoor et al. deemed that the novel items for a system are unrated and newly added items that are unpopular or forgotten by users [20]. Considering that item popularity is easy to calculate, commodities with low popularity have high novelty [21, 22]. However, global values cannot reflect user interests or represent the novelty of the same item for different users. Wu et al. used parameters to combine random walk with heat conduction theory to improve accuracy and novelty on the basis of a user-item bipartite graph [23]. Wang et al. proposed a discovery-based user-item relation recommendation model and compared it with traditional k-nearest neighbor and min-min roughness-based classical algorithms in terms of improvement to effectively improve the novelty and diversity of recommendation lists [24]. Yu et al. presented the association between users and communities in a neighborhood and a user-community distance measurement method to calculate the novelty of candidate communities and provide novel community recommendations, thereby improving the accuracy of recommendation results [25]. Pietro et al. introduced the concept of “adjacent possible” to redesign a recommendation system to meet user demands [26].
For users, novelty is a “new” thing and differs from known things, making it a kind of user perception [27]. Saranya et al. used maximum cosine and average cosine distances to measure the distance of new documents to those already known by users for verifying their novelty [28]. Wael et al. used a deep semantic similarity model to implicitly measure the semantic similarity between user interest and recommended available resources for the recommendation of novel learning resources [29]. Jorge et al. optimized the novelty and diversity of recommendation list through factorization [30]. Kminkas and Bridge analyzed the differences and associations of four metrics, namely, diversity, surprise, novelty, and coverage, through several experiments on the basis of their definitions and a summary of optimal technologies. They proposed multiple optimal strategies to improve the four metrics by analyzing their influences on accuracy [31]. Pathak et al. introduced the characteristic space-based diversification technology by investigating the associations of diversity and novelty principles of information retrieved using recommendation systems [32]. Fm et al. presented theme association attribute random forest and diversity and novelty improvement algorithms for implicit tag recommendation by integrating three aspects, namely relevance of tag suggestions, diversity, and novelty of explicit themes [33].
The popularity of the item is actually changing over time. The future development trend of the popularity determines the possibility that the item will be accepted by the user, and the cumulative popularity of the item determines the probability that the item will be known by the user. This provides an idea to address the problem of accuracy and novelty, namely, recommending items that are not currently popular and that are most likely to become popular in the future.
The remainder of this study is organized as follows. Section 3 analyzes the popularity time series, establishes the popularity prediction model, and designs the novelty algorithm based on the product life cycle. Section 4 part introduces the experimental design and results analysis. Section 5 summarizes the conclusions.
Methodology
PLC and novelty recommendation
The PLC refers to the market life cycle of a product, that is, the whole process from the time the product enters the market to the market is eliminated [34]. The product life cycle can be roughly divided into four phases, as shown in the Fig. 1. The first is the introduction period. The product has just entered the market, the users are not familiar with it, the demand is not large, and the sales channel of the product is also in the initial stage of construction, so the sales growth is slow. The second stage is the growth period. The products have basically been recognized by the market, the distribution channels have been smooth, and the sales volume has grown rapidly. With the scale effect, the company has obtained a large amount of profits. The third stage is the maturity period, the market tends to be saturated, and the sales volume growth is not obvious. The fourth stage is the recession period, and the sales volume has changed from a slow decline to a sharp decline. The product gradually withdraws from the market due to technological advancement and the emergence of alternative products. Fig. 1 shows the product life cycle curve under ideal conditions, but the product life cycle curves are different [35], as shown in Fig. 2.
The ideal product life cycle curve.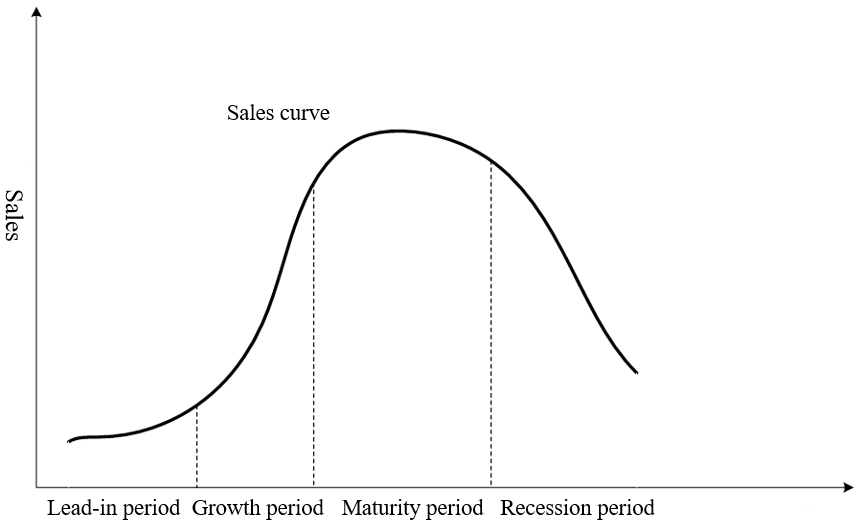
Life cycle curve for style, fashion and boom products.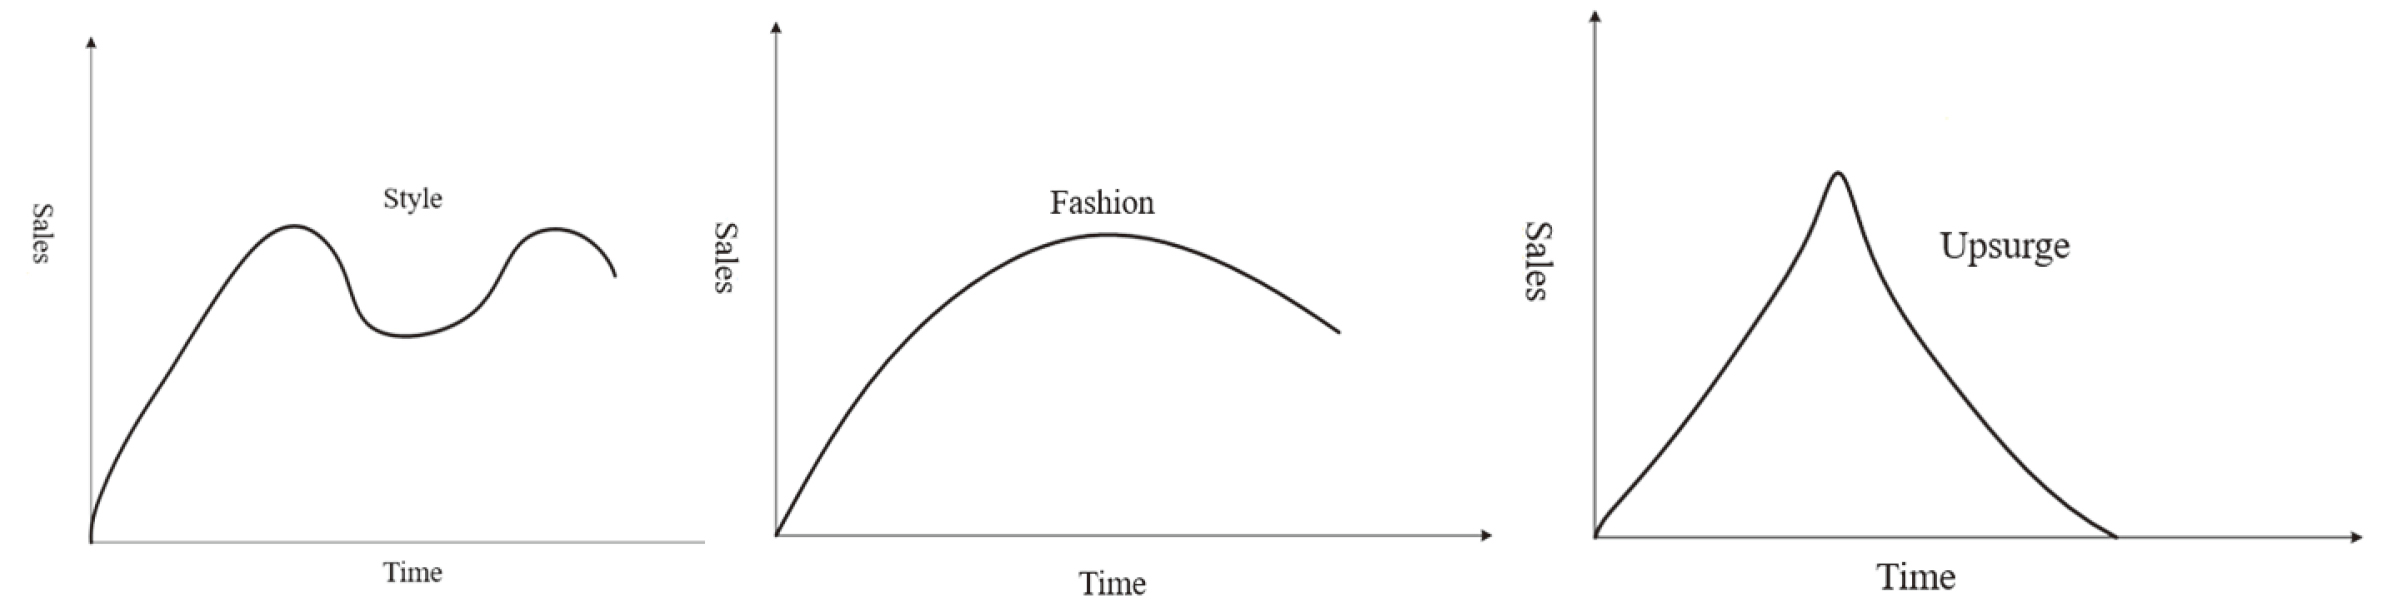
KP and AP of the item at different life cycle stages.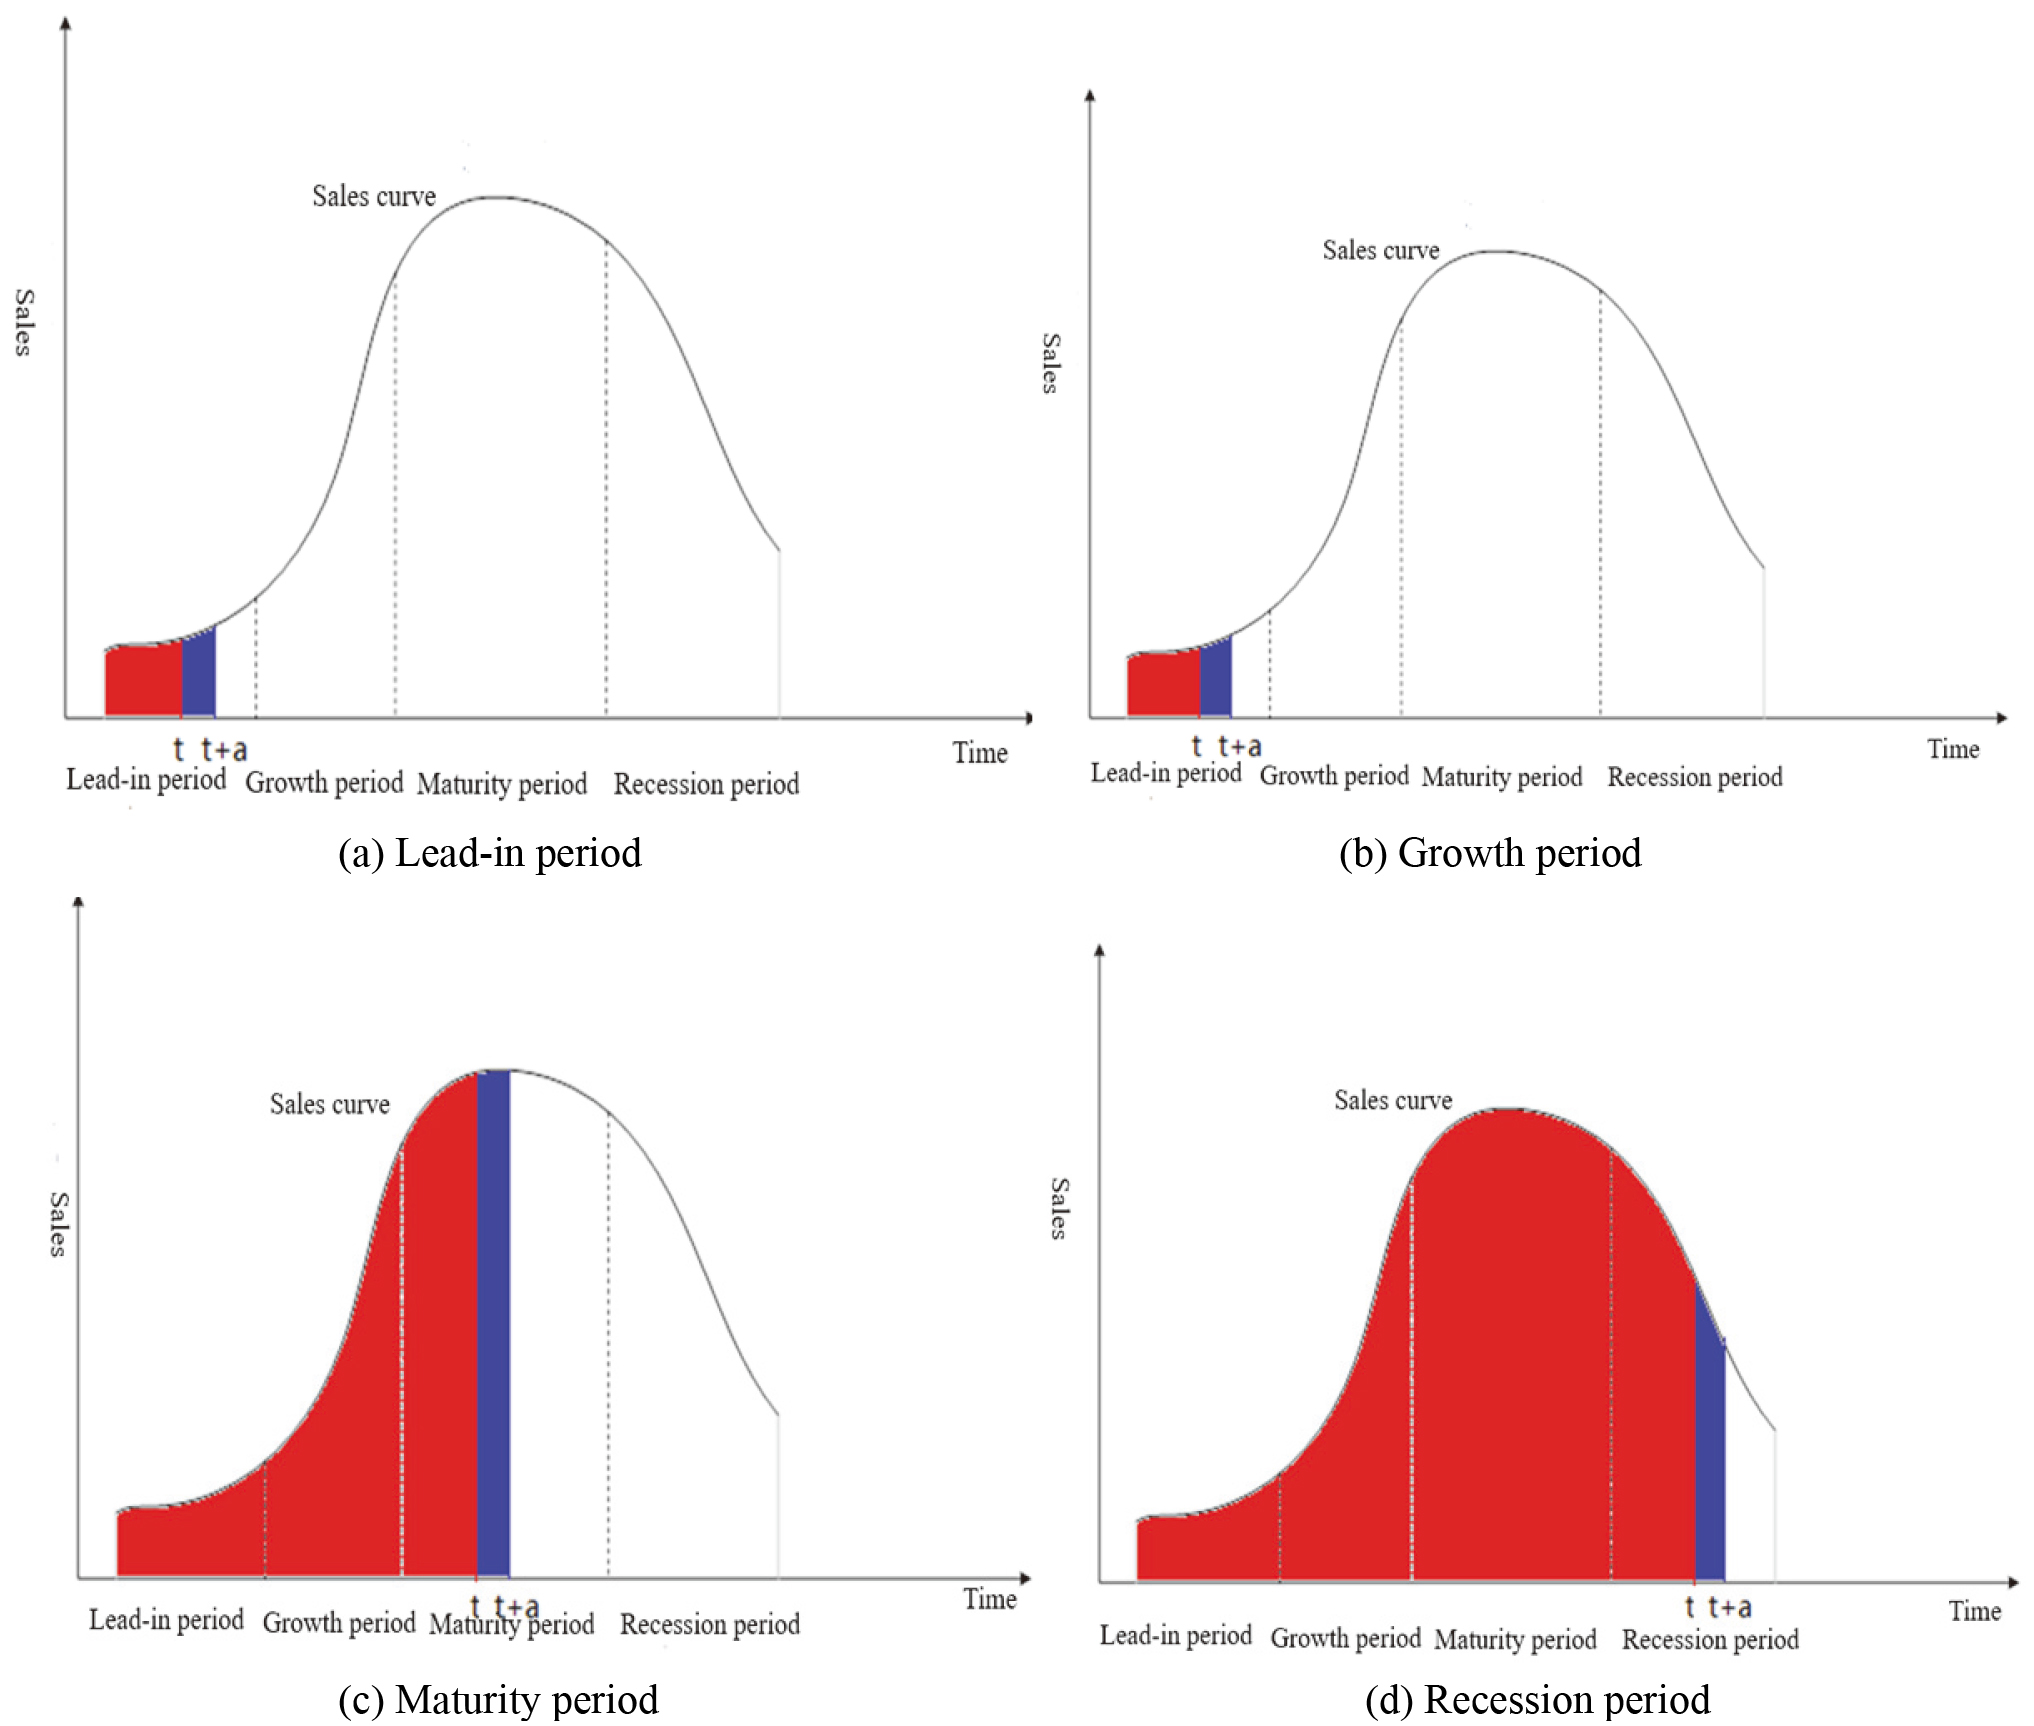
The recommendation system is to recommend the item to the target user at a specific time, and the time attribute should be considered when analyzing the accuracy and novelty of the recommendation list. Taking the recommended time t as the demarcation point, the accuracy and novelty of the recommended items for the current users in t
For the accuracy and novelty of the recommendation system, it is recommended that the non-popular products will increase the novelty for the user, and the future high popularity of the recommended item can guarantee the accuracy. This is the main idea of the novel recommendation algorithm based on PLC. Consider the time attribute when analyzing item popularity, study the evolution of item popularity over time, and predict the future trend of the item. To this end, the appropriate time interval can be selected to form the time series data of the item score, and the forecasting method is used to calculate the popularity trend (such as one week, one month, etc.) in the future time period of the item. The lower the item popularity in the future time period, the lower the AP’s AP, so the lower the probability of being recommended. Similarly, although the item is a popular item, that is, the total popularity is high, if the trend of popularity is significantly reduced, the recommendation system should not be recommended, because such a popular product has a high KP for the user, while the AP has a high significantly lower. To improve the novelty of the recommendation system without compromising accuracy, the recommendation list can recommend items that are not currently popular but will become popular in the future.
In the PLC-based novelty recommendation algorithm, the total popularity of the item is calculated to represent the KP of the user to the item, and then the popularity of the item in the future time period is predicted to represent the AP of the item. Two filtration methods are used. The first type first predicts the most popular items in the future time period as an alternative set, and then calculates according to the novelty definition of the item, and recommends the novelty item that best meets the user’s preference. The second method adopts the exclusion method. Firstly, according to the classical algorithm, the item that best matches the user’s preference is found as an alternative set, and then the items with high KP and low AP are found out according to the novelty definition of the item.
The most popular items in the MovieLens dataset.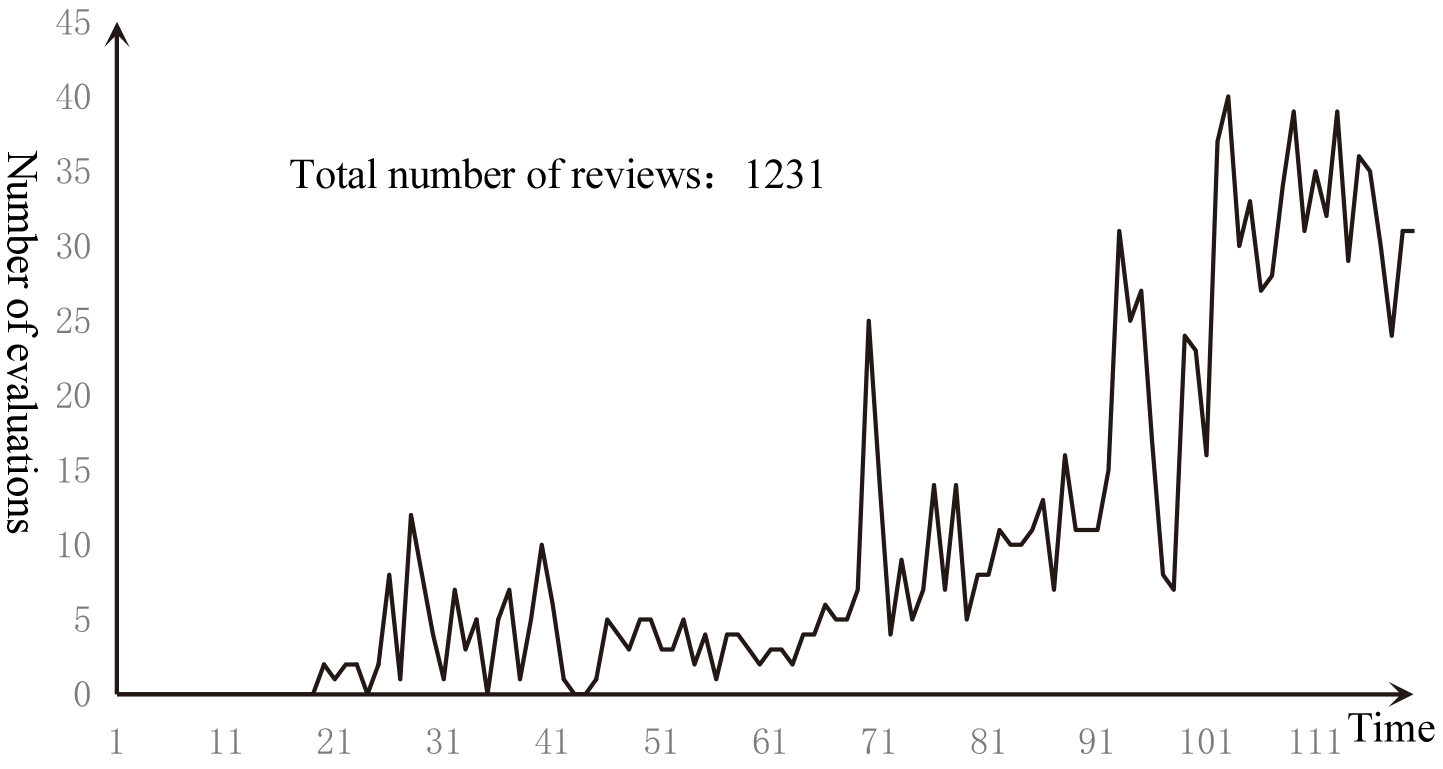
Total evaluation times curve for MovieLens dataset.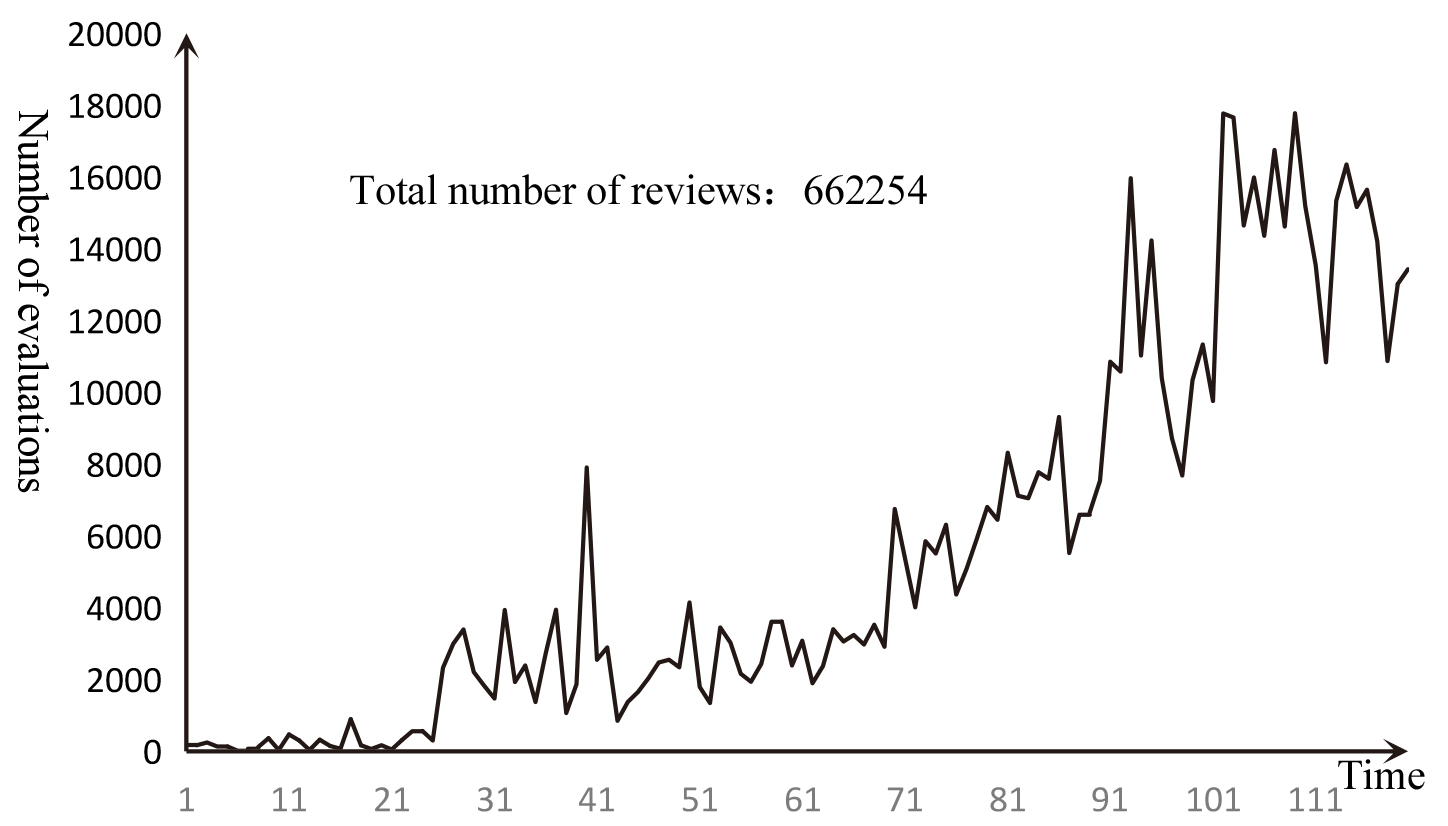
Item popularity and user scoring patterns can be divided into four aspects over time: time deviation, user bias transfer, user preference transfer and item bias transfer [36]. Time deviation refers to the change of the preferences of the whole society over time. User deviation transfer refers to the change of user’s scoring habits over time. For example, a pessimistic user has a low score on the item within a certain period of time. User preference transfer refers to the user’s preference for the type of item changes over time. Item deviation transfer refers to the change of item popularity within a certain period of time. For example, when a movie wins an Oscar, its popularity will increase dramatically. Analysis of changes in item popularity from the perspective of item bias transfer can improve the novelty and accuracy of the recommendation system. The popularity of a item at a particular time interval is defined as the number of times the item is interacted within a specific time interval. The time interval can be minutes, hours, days, weeks, etc., which depends on the nature of the item. If the item changes quickly, the time interval is short, and the opposite is long. For example, the news recommendation interval is in hours, and some durable goods recommendations may be in years. The experiment used the MoviesLen and LastFM datasets for experiments and evaluations. The item was film and music with a time interval of 30 days. Figure 4 shows the popularity curve of the most popular items in the MovieLens dataset. The curve life graph is not the same as the product life cycle curve. The reason is that the number of evaluations of the MovieLens dataset is increasing with time (as shown in Fig. 5). This is similar to the fact that the scale of the market is expanding. It is not appropriate to use sales to measure the position of products in the market. It should be measured by market share. Therefore, the popularity of the defined item at a particular time interval is the ratio of the number of times the item is scored within a particular time interval to the total number of evaluations within that time interval (Eq. (1)).
The most popular item popularity curve for the MovieLens dataset.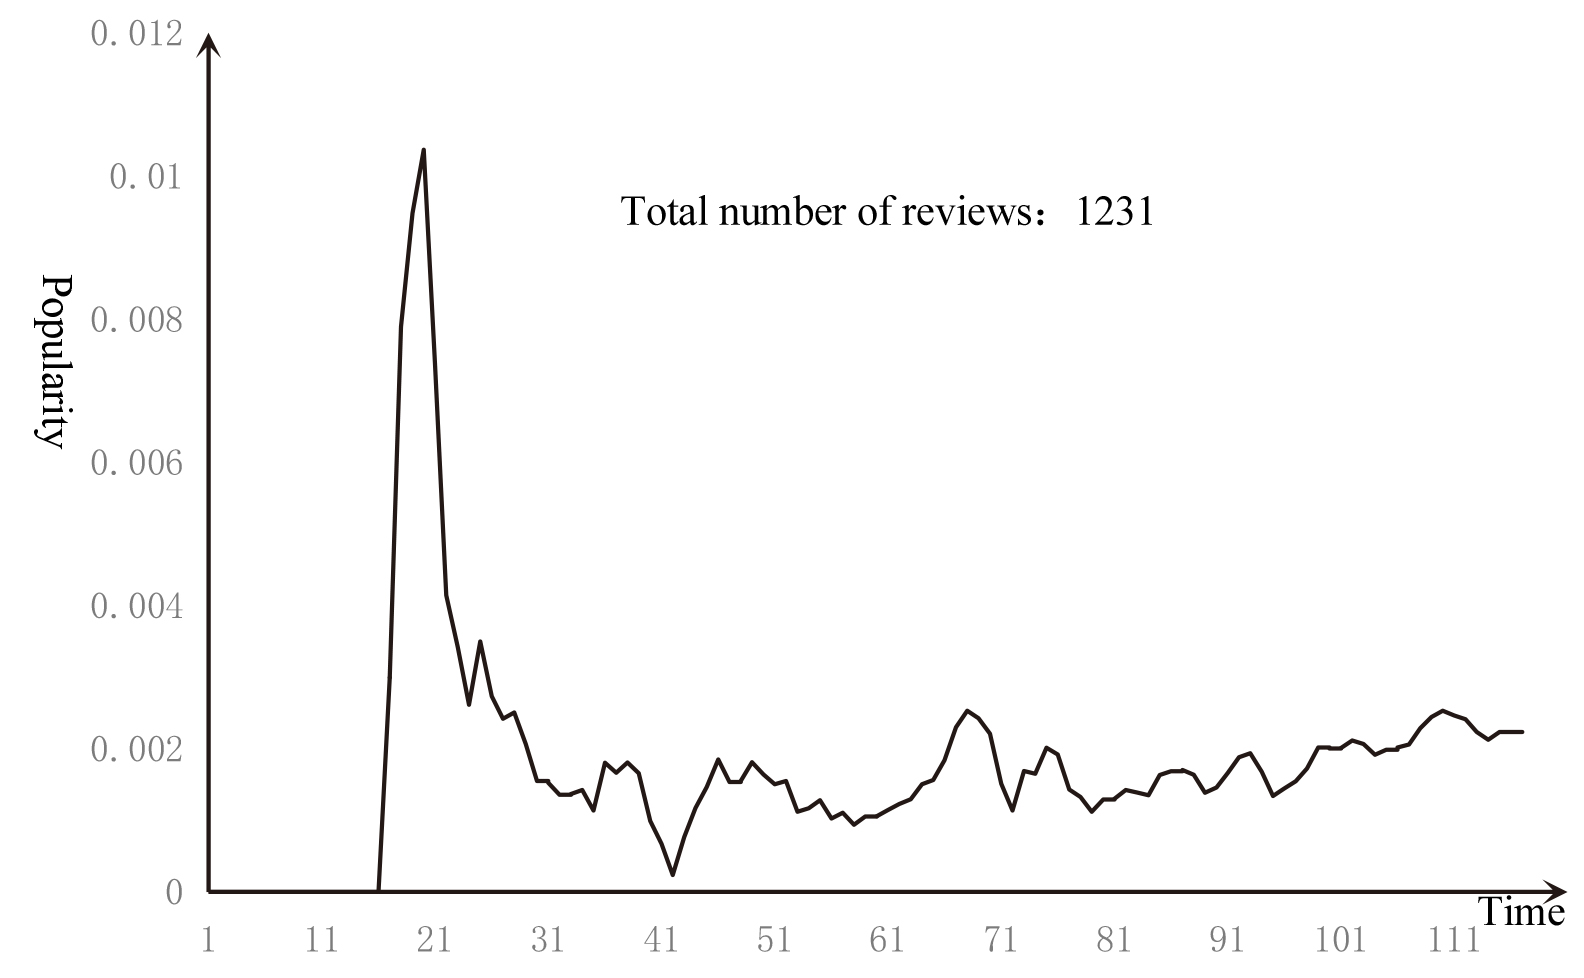
Where
Popularity curve for 4 items in the MovieLens dataset.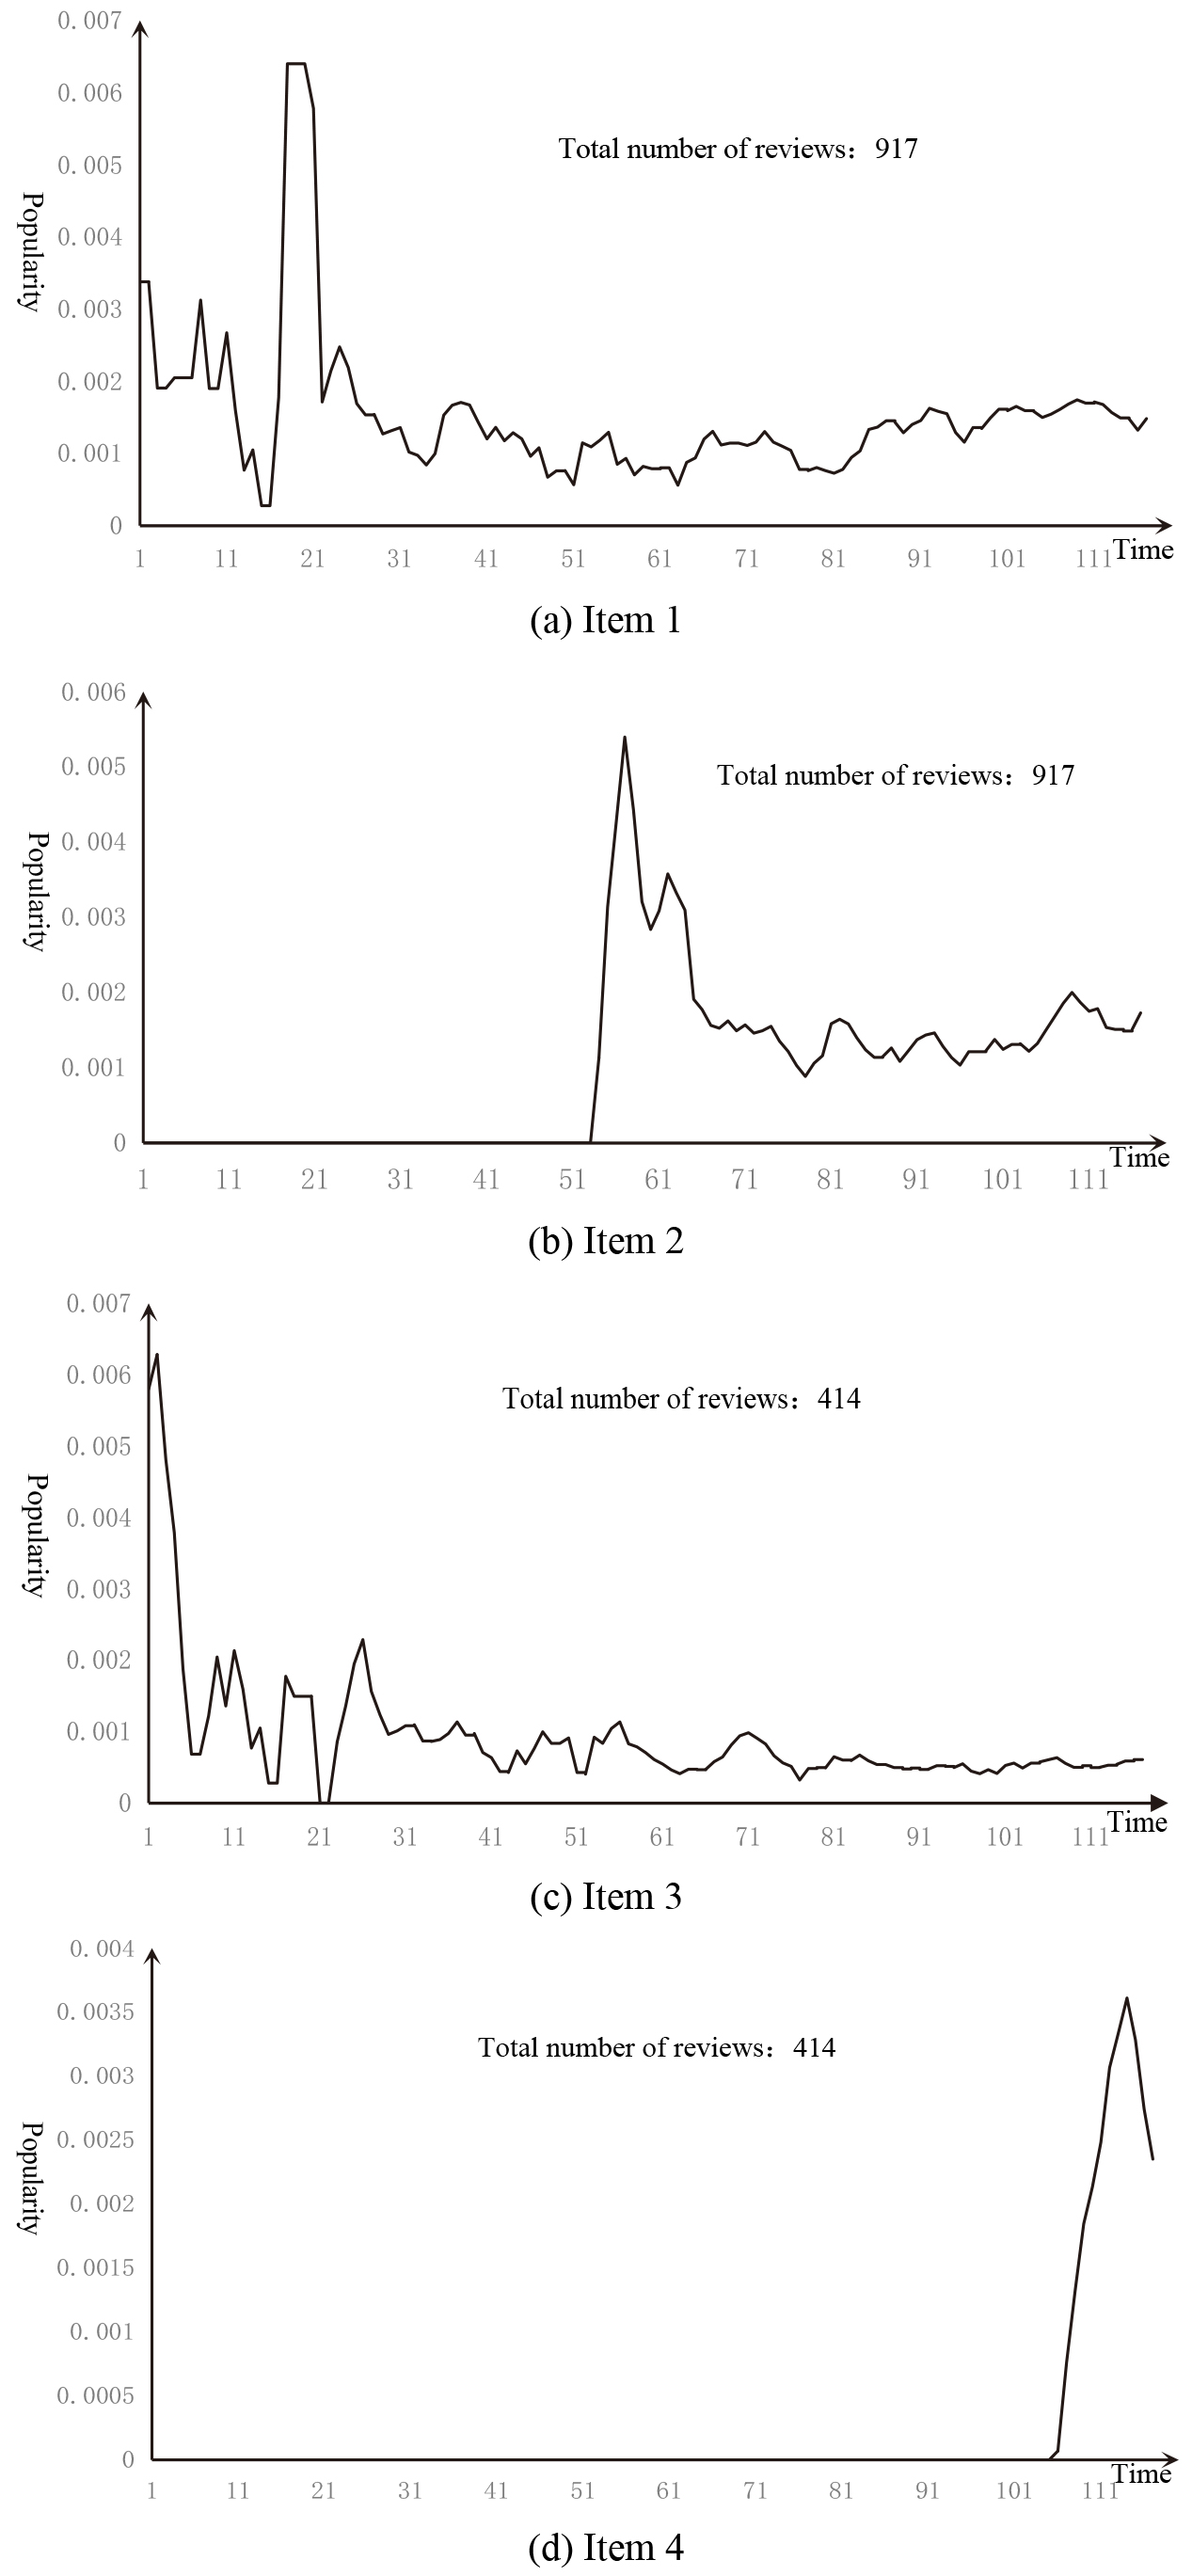
Popularity is similar to sales, so sales forecasts can be used to predict trends in item popularity. Commonly accepted methods in sales forecasting are statistical models, such as the Autoregressive Integrated Moving Average Model (ARIMA) and seasonal ARIMA models, artificial intelligence models such as Artificial Neural Networks (ANN), and some other scientific methods such as wavelet analysis. Different models have different requirements for historical data, and the basic modelling assumptions are different. For example, the ARIMA model assumes that the data is linear, while the ANN model is assumed to be non-linear, and these are closely related to the properties of the data.
In the recommendation system, there are often not enough samples to use traditional machine learning methods for reliable prediction. Regression models can be used for the prediction of short-term historical data [37], however, due to the high complexity and nonlinearity of the popularity curve, the accuracy of the regression model is not high. In fact, the popularity time series contains a lot of high-frequency noise-like information, making prediction accuracy difficult to guarantee. The core idea of the novelty recommendation algorithm based on PLC is to recommend the item that is not popular now and the future popularity. Then the development trend of the item popularity is the information that needs to be obtained, not the exact value of the popularity. However, there is a strong similarity between the item popularity curves, so the analogy can be used to predict the popularity of the item.
The analogy is based on the assumption that if the historical trends of the popularity of the two items are similar, the future development trends are similar, so the similarity of the two item popularity curves needs to be calculated. For such continuous data, distance metrics are usually more appropriate. The similarity between successive attributes is usually expressed by the difference of attribute values. The distance metric provides a good way to combine these differences into the total similarity measure [38]. The Euclidean distance is used to calculate the similarity of the item’s popularity curve.
Assuming that the first
A similar item set sim_x can be found for the target item
As can be seen from Eq. (3), in order to predict
The novelty recommendation algorithm based on PLC is to find non-popular products that become popular in the future. In the plc-based novelty recommendation algorithm, the total popularity of the item is firstly calculated to estimate the KP of the items by users, and then the popularity of the items in the future period is predicted to represent the AP of the item. Finally, the non-popular products will be recommended in the future to improve the accuracy and novelty of the recommendation system. Judging the KP of the item is generally calculated according to the total number of evaluations of the item, then the unknown of the item to the user can be calculated by using Eq. (6).
However, in Fig. 7, items 3 and 4 have the same number of evaluations, but the time distribution is different. Item 3 is already in a recession. Most users who prefer this type of items are aware of it, while Items 4 is just in maturity, so the probability that Item 4 is known should be less than Items 3. If calculated according to Eq. (6), the unknowns of the two items are equal. Therefore, the time factor can be added. It is more reasonable to use Eq. (7) to calculate the unknown of the item.
Two filtering strategies are employed in the PLC-based novelty recommendation algorithm. The first strategy predicts the most popular items in the future time period as an alternative set, and then calculates according to the novelty definition of the item, and recommends the novelty item that best meets the user’s preference, called the Predicting Popularity-based filtering Algorithm (PP algorithm). The second strategy adopts the exclusion method. Firstly, the classic algorithm is used to find the item that best matches the user’s preference as an alternative set, and then the item with high user awareness and low AP is found to be excluded, that is, the item that is in rapid decline is excluded. It is an Excluding Recession-based filtering algorithm (ER algorithm).
In the PP algorithm, it is first necessary to find N items with the highest predicted popularity within a specified time period as an alternative set. This method is mainly concerned with the attraction of the item to the user in the future time period b, in order to ensure the accuracy of the recommendation result, and then use Eq. (8) to calculate the novelty of the candidate set item for recommendation. In the ER algorithm, firstly, the largest N of
Experiment and design of evaluation metrics
Offline experimental scheme of novel recommendation.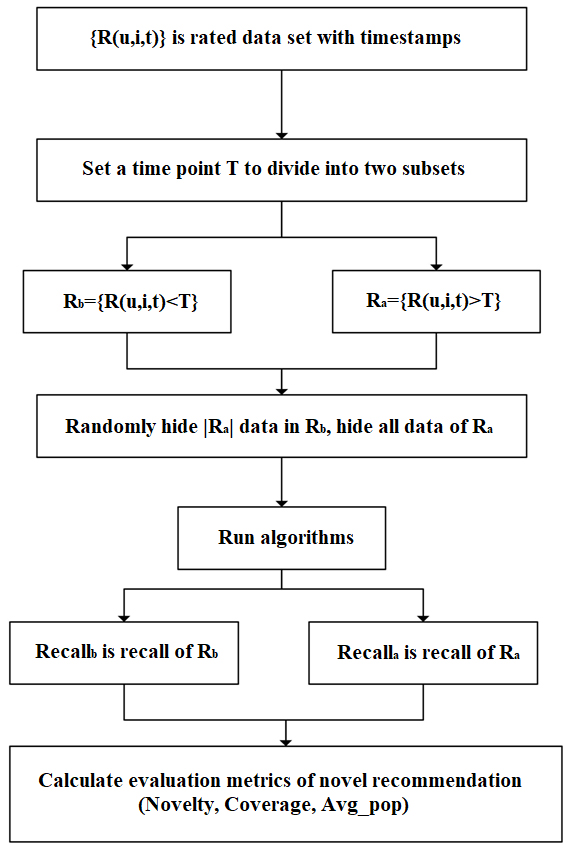
In Top-N recommendation, the traditional experimental method hides some item ratings in the existing datasets and then measures the algorithm performance in terms of recall rate and accuracy. Here, the assumption that the hidden items cater to user preferences is reasonable, whereas the hidden items are already known by the user on the basis of the training dataset. The novelty of each item is relative to specific users at a specified time. A user behaviour dataset with a timestamp can be used and divided into two subsets by setting a time point. The items with high ratings at this time point are novel for the user. Following the above idea, a detailed offline experimental scheme for novelty recommendation is designed, as shown in Fig. 8 [39]. The experimental results are comprehensively evaluated using three metrics in the recommendation list, namely novelty (Eq. (9)), average popularity (Eq. (10)), and coverage (Eq. (11)).
where
The two datasets, namely, MovieLens and LastFM, are adopted in the offline experiment. The time interval is set to 14 days. Five experimental points are uniformly selected from the datasets of the previous year, previous rating data of each experimental point is set as
Impact of similar project quantity on project popularity prediction accuracy.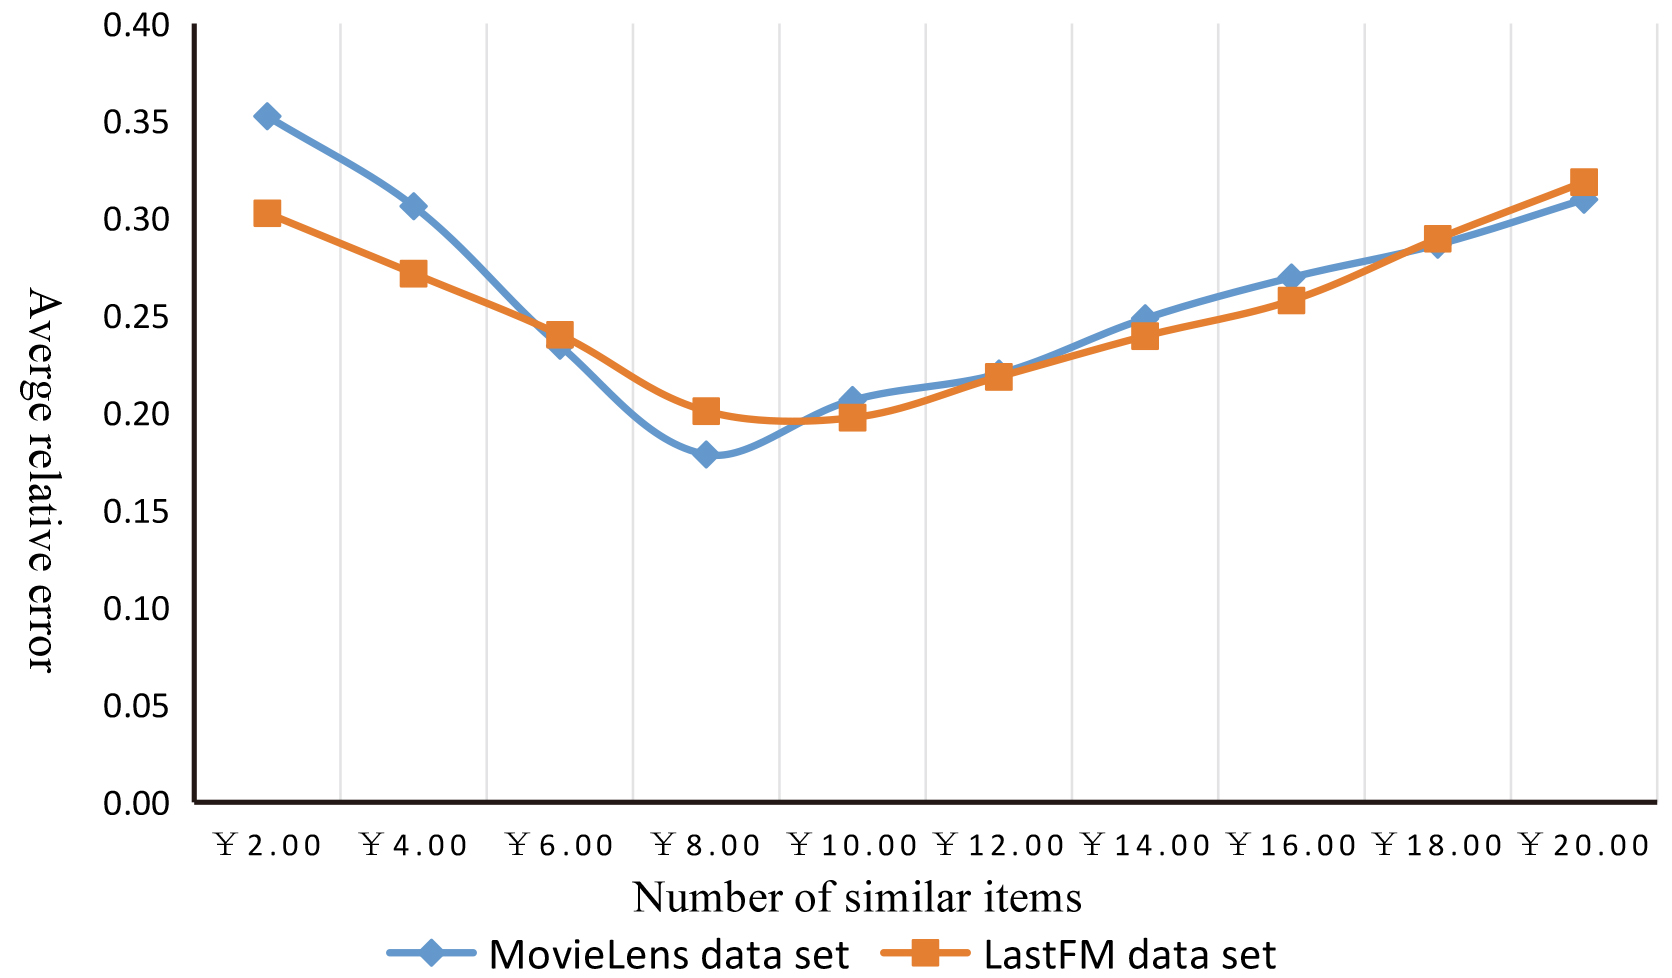
MovieLens dataset experiment results.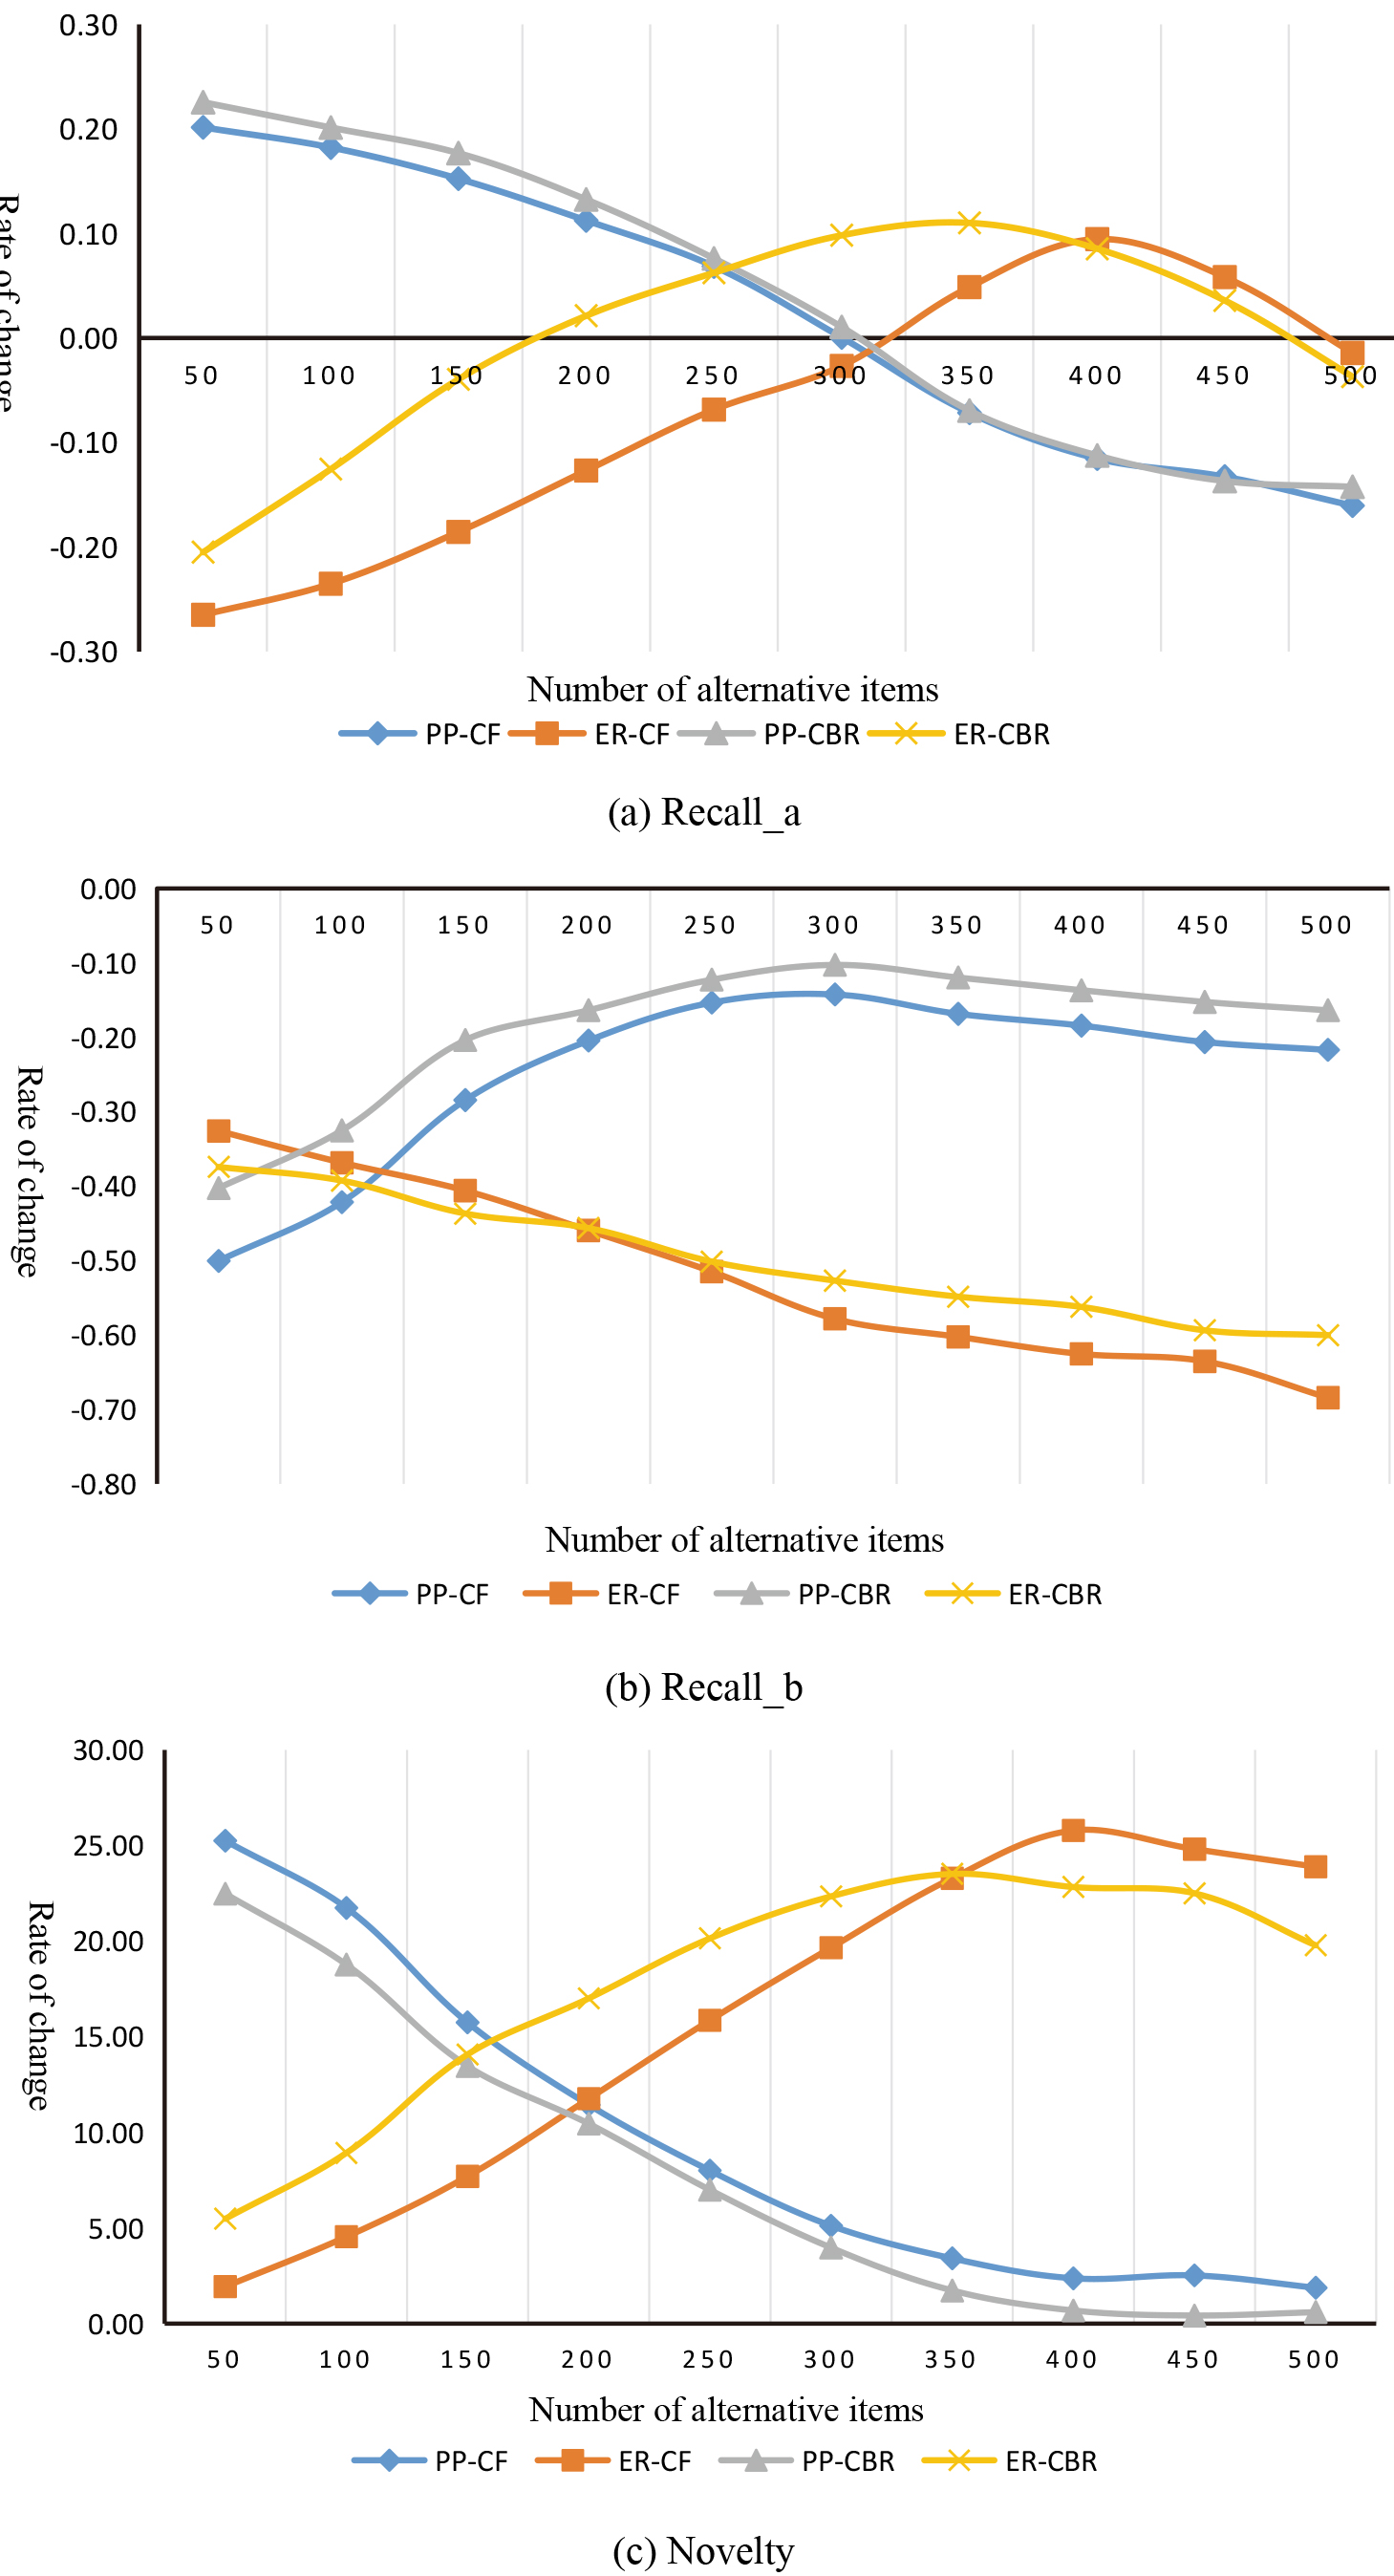
Continued.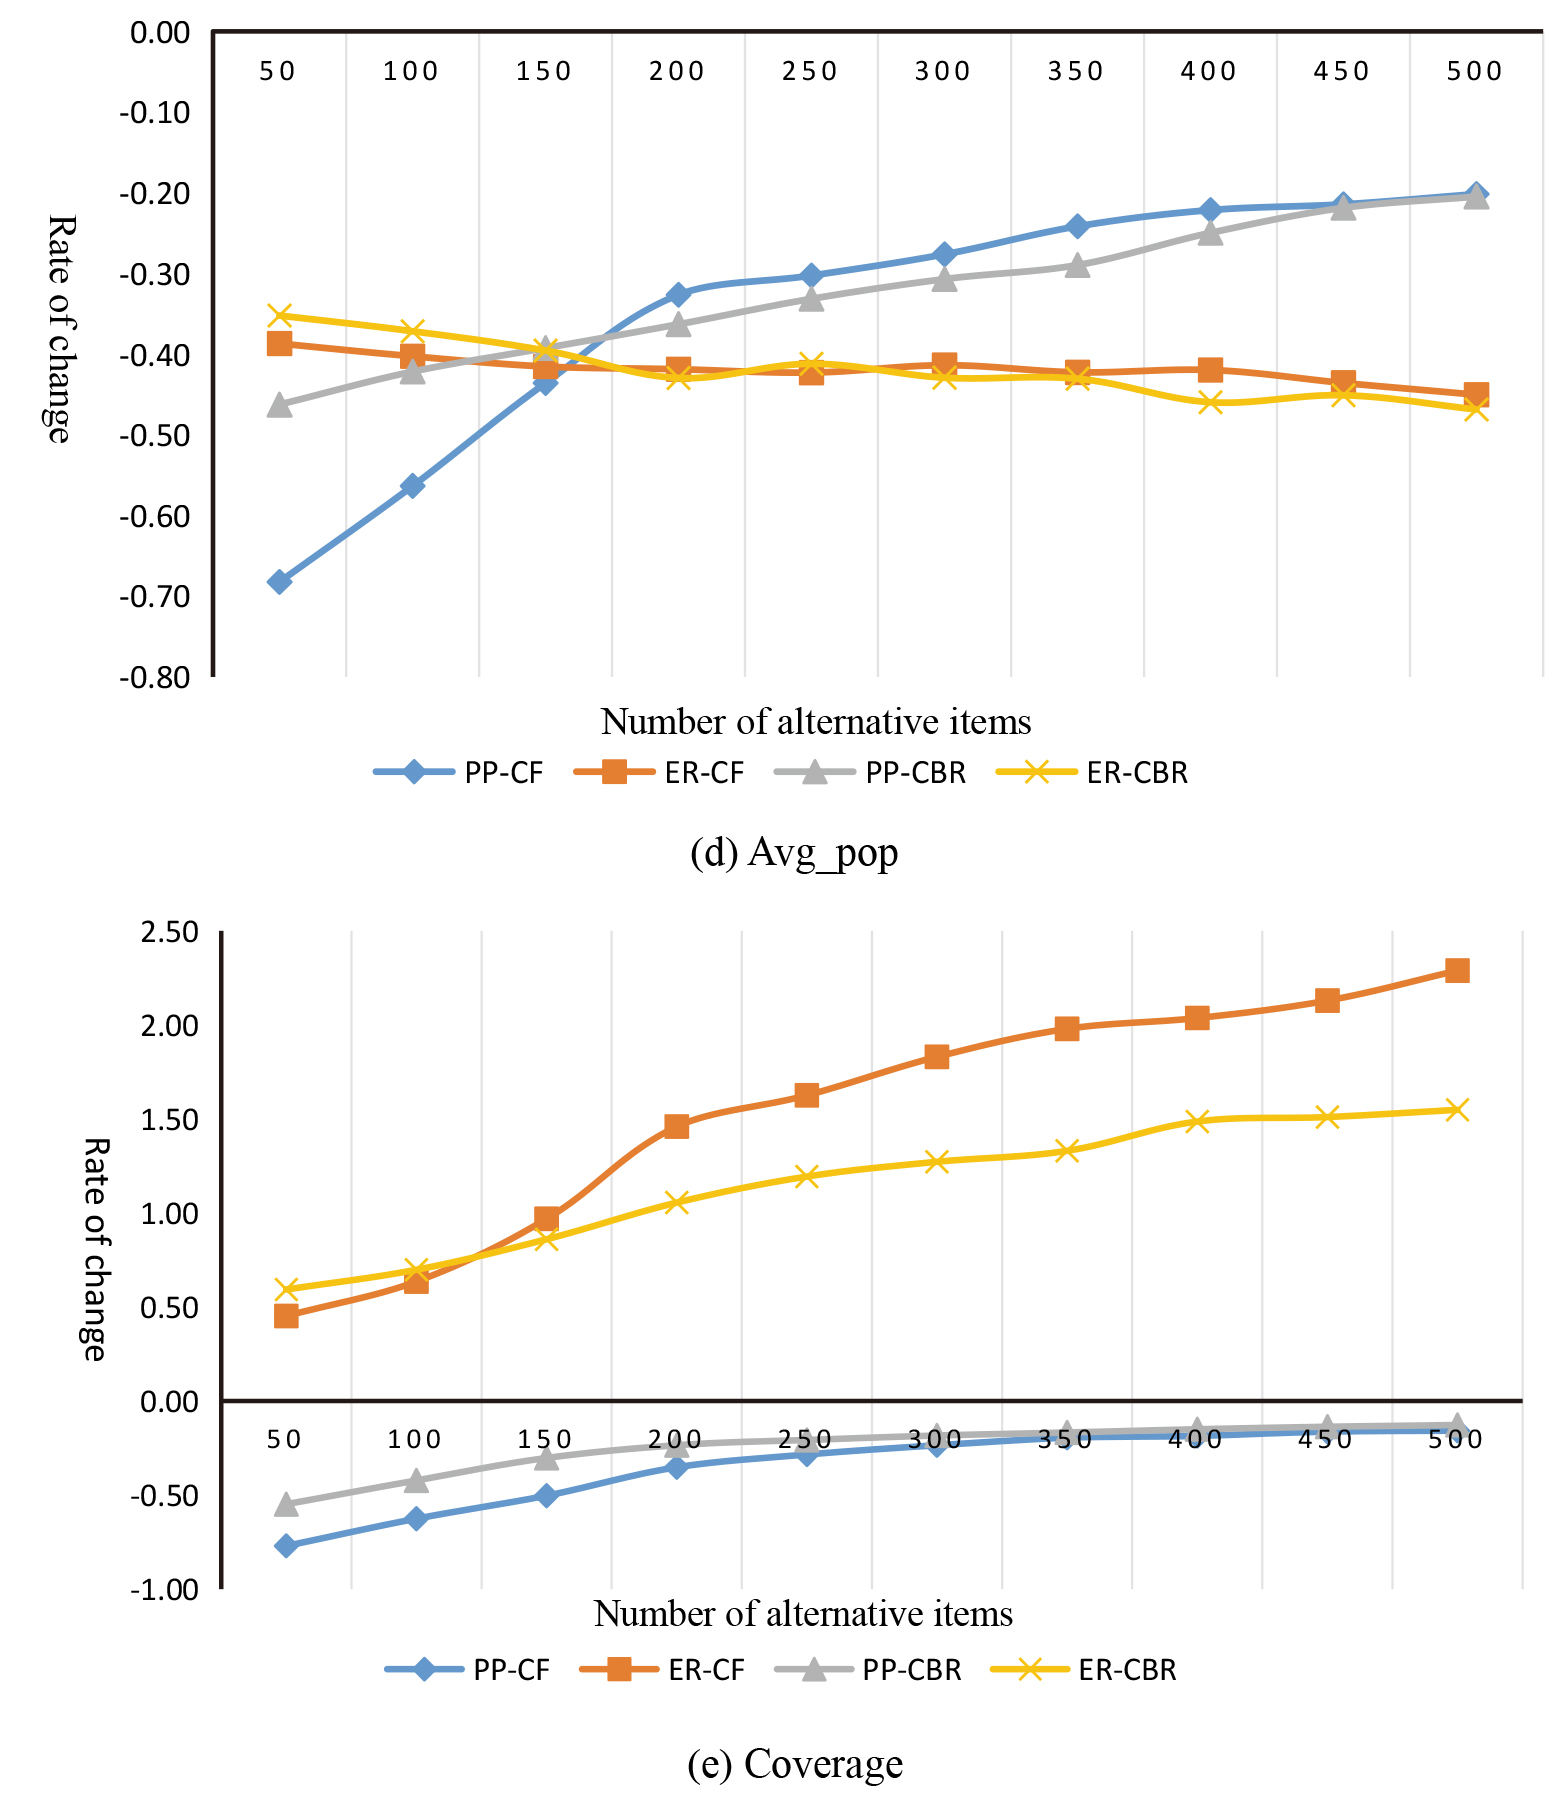
LastFM dataset experiment results.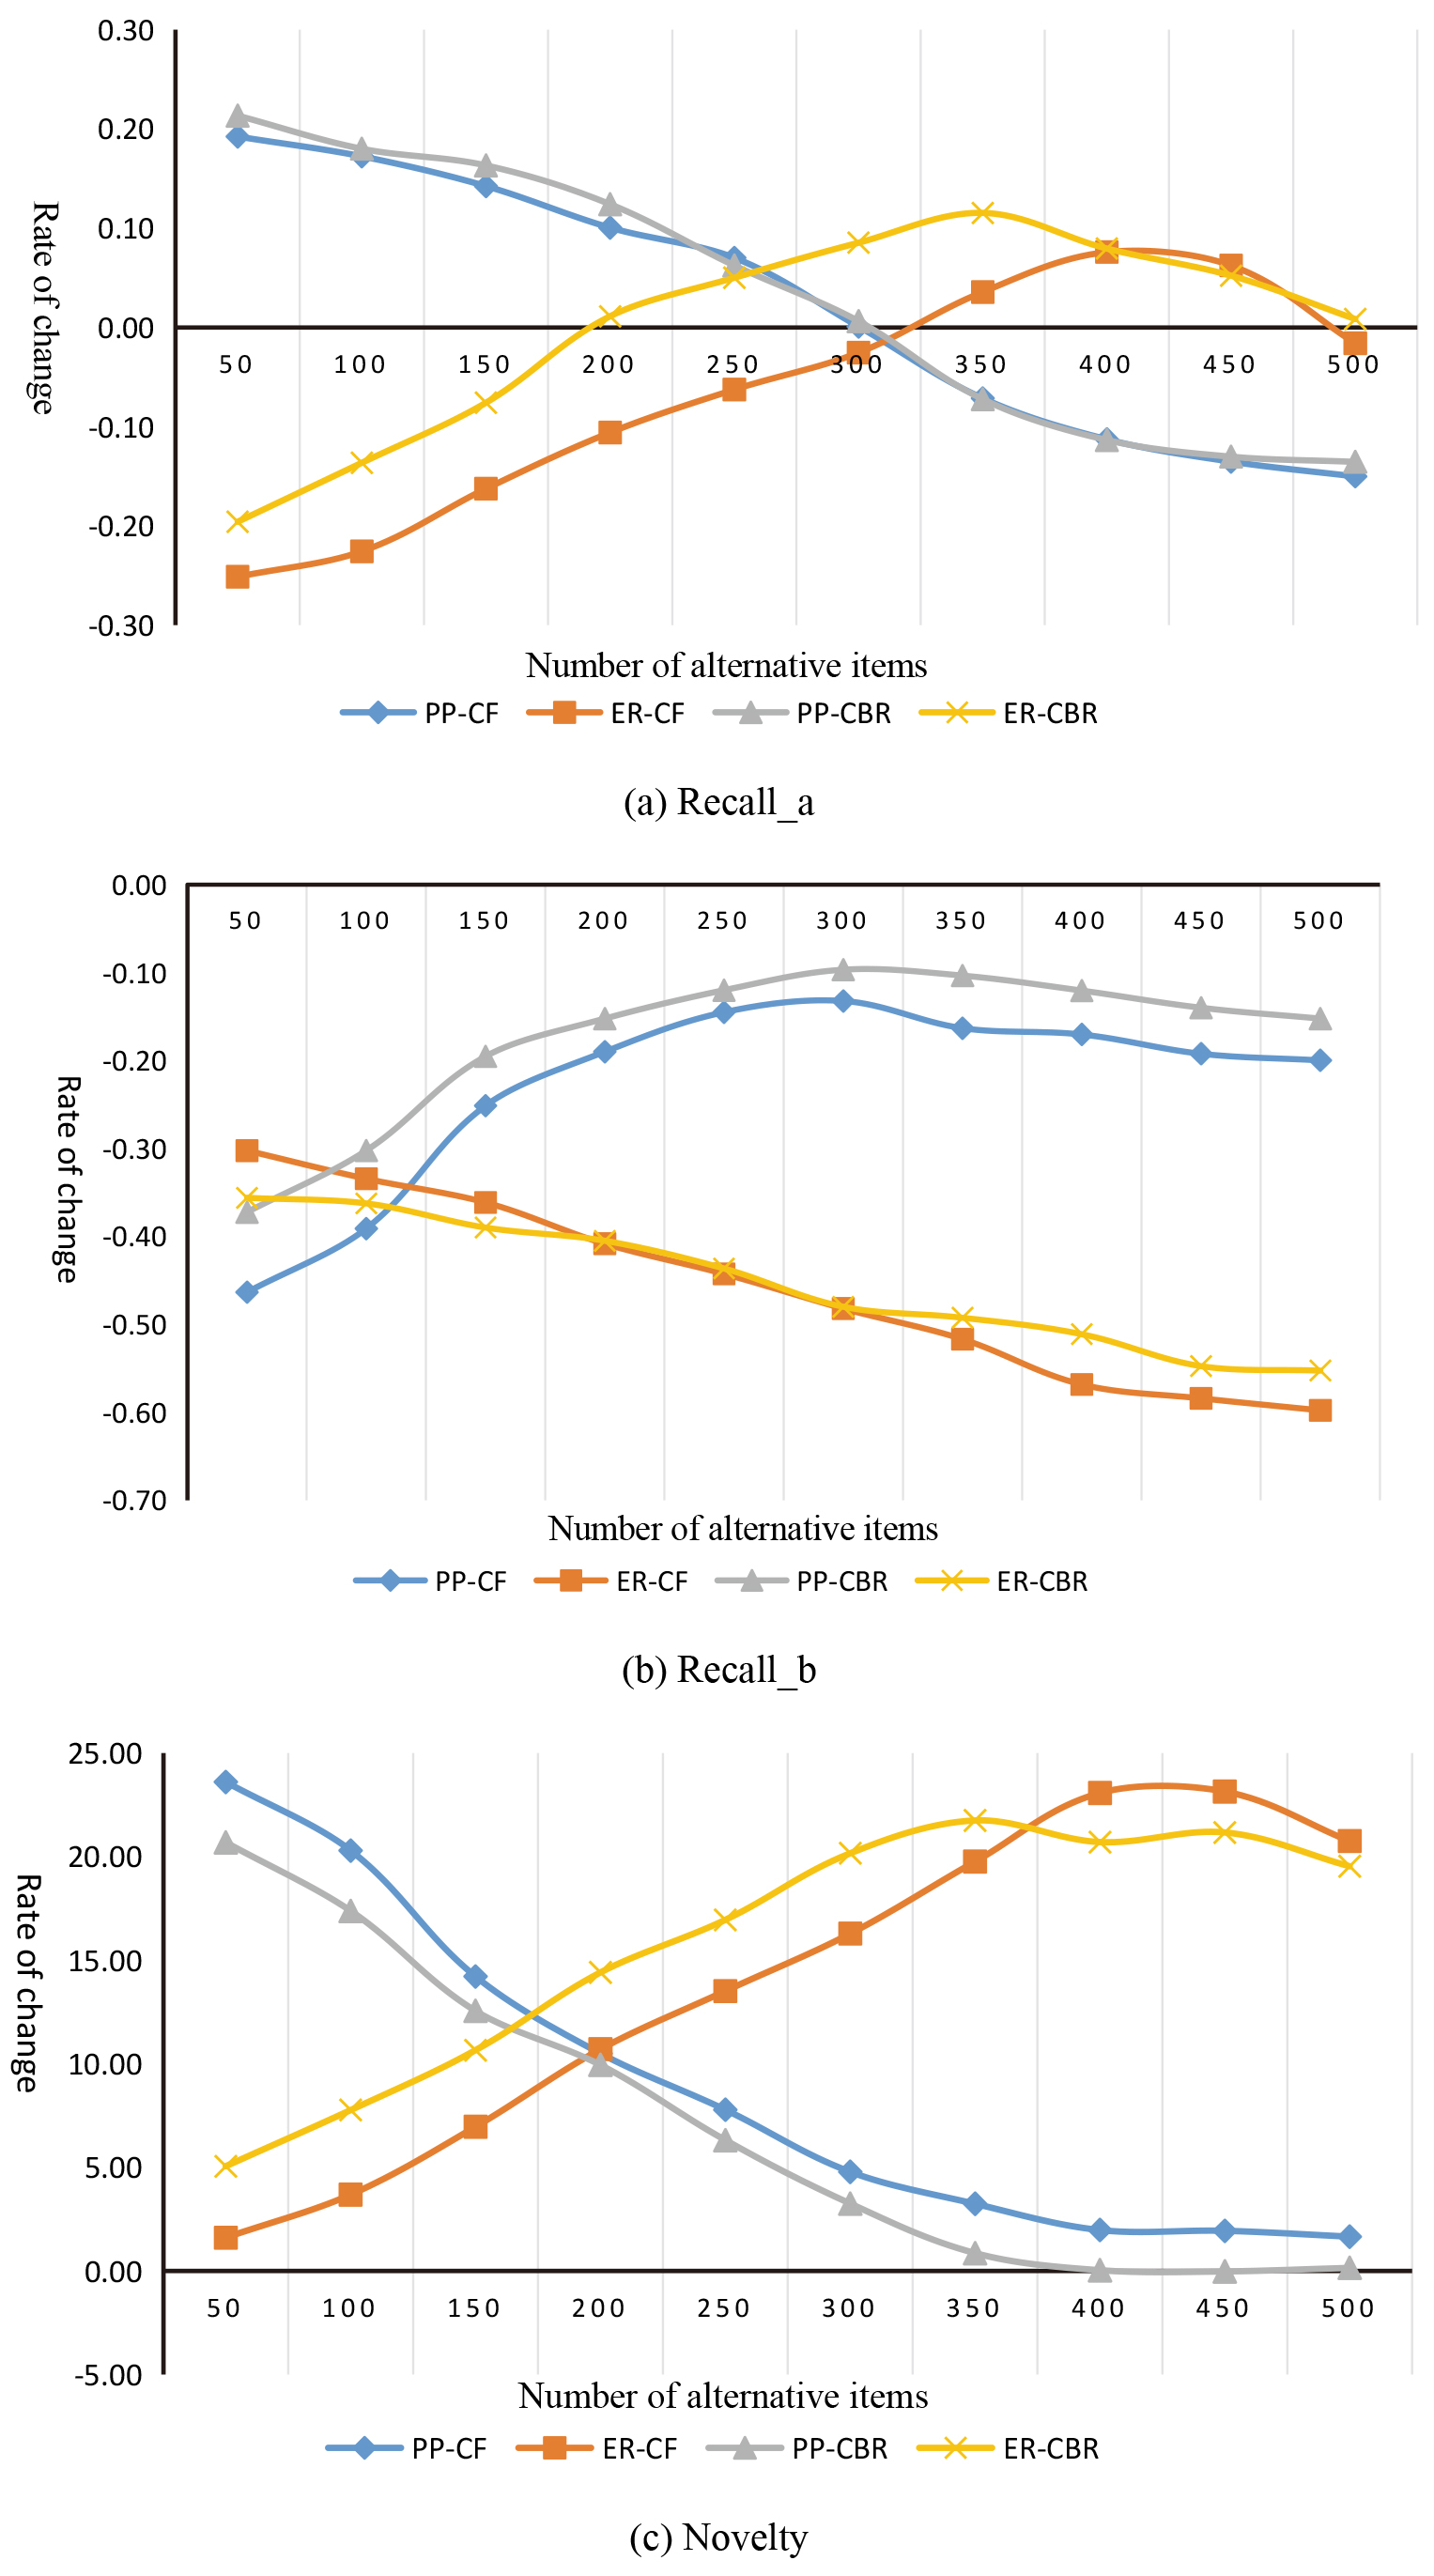
Continued.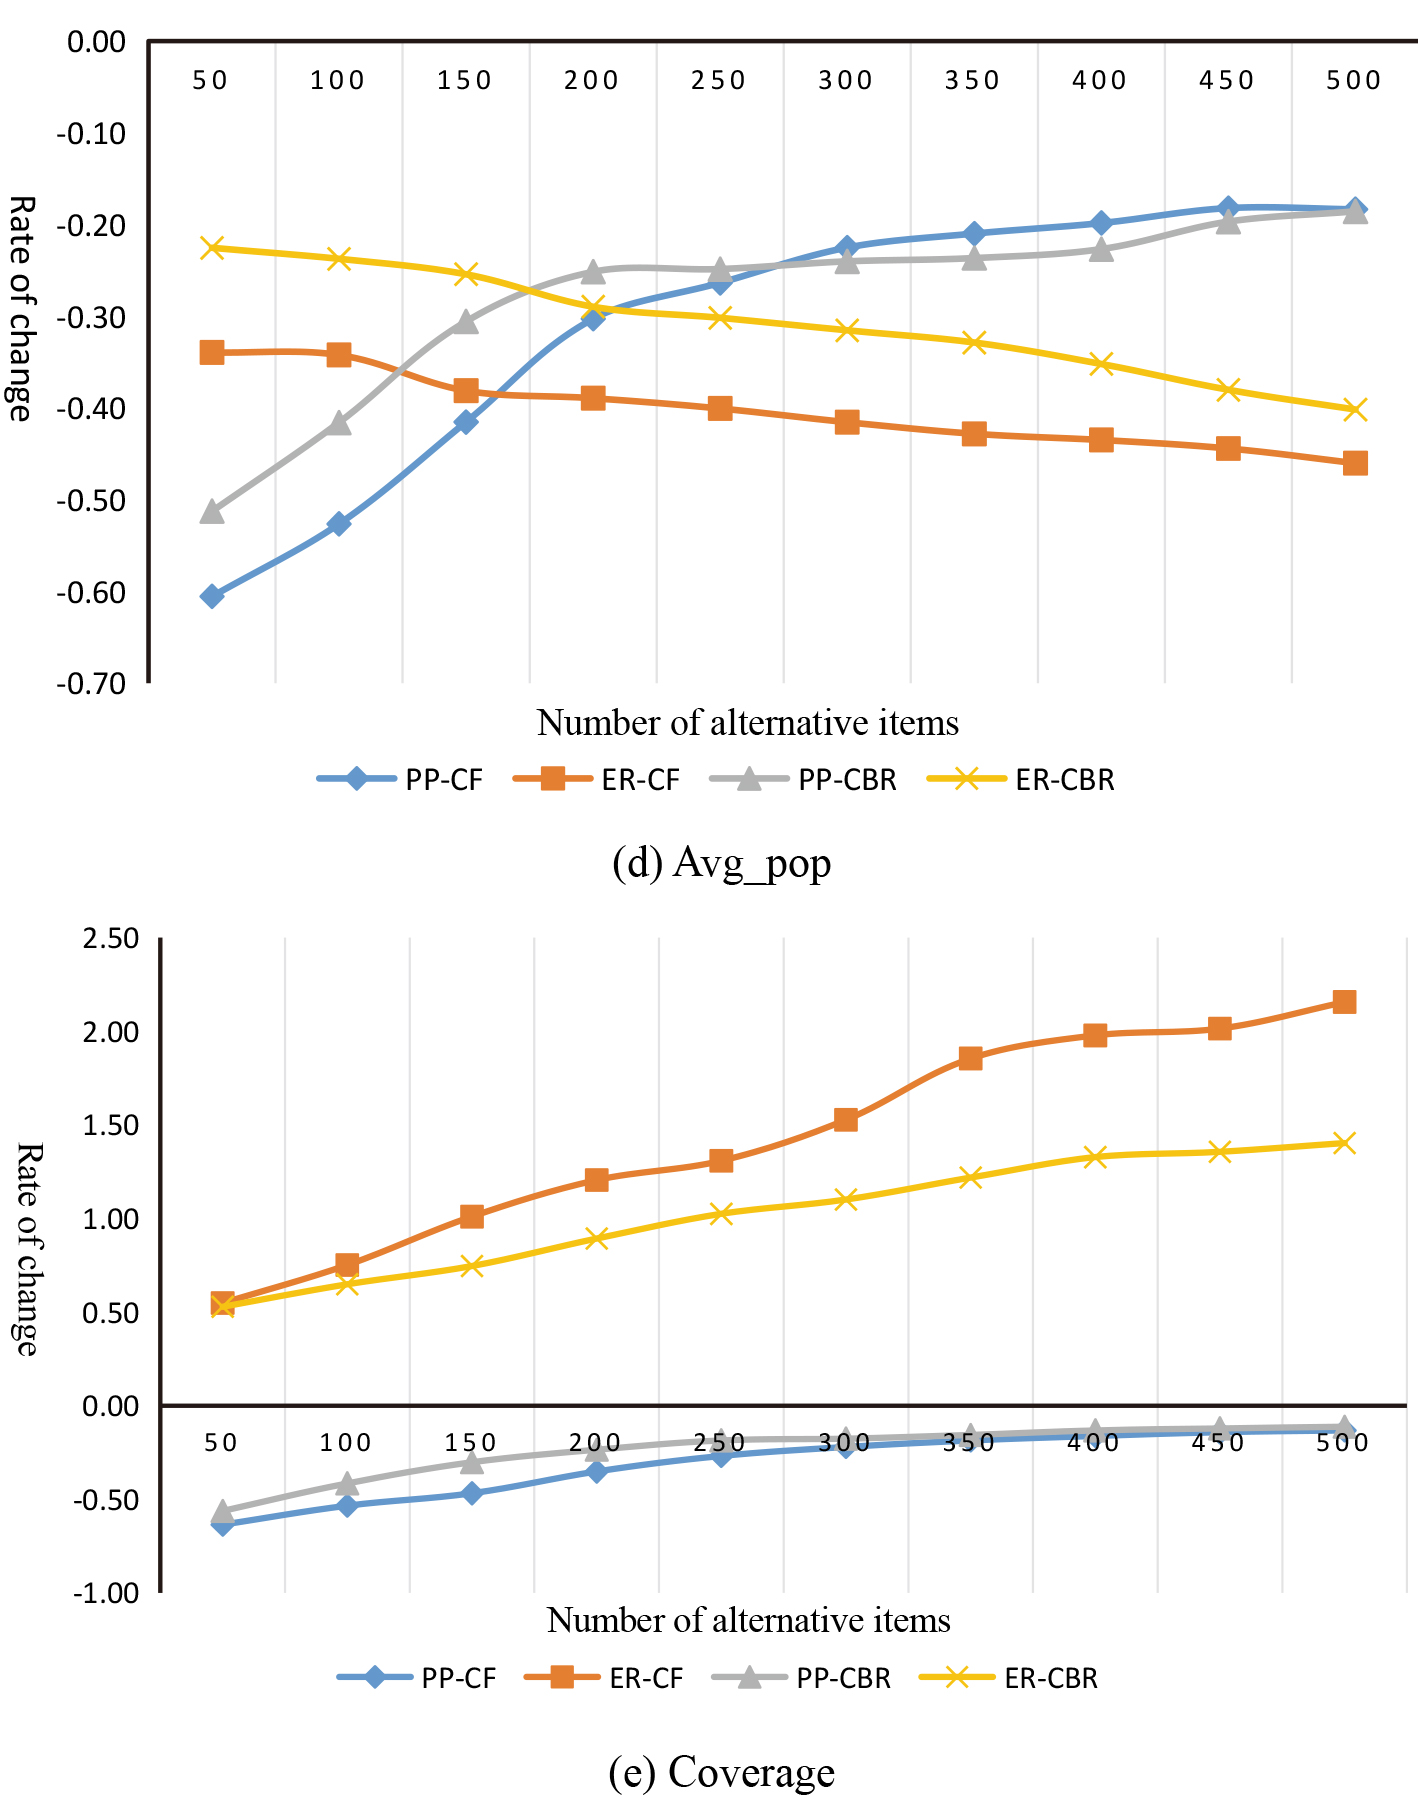
According to the idea of the algorithm, the analogy is used to predict the future popularity of the item. Assuming that the experimental point set is
Novelty and accuracy of PP and ER algorithms
What PP and ER algorithms have in common is that they both need to select a backup set first, and then make novelty recommendation according to their respective strategies. The size of the backup set, N, is the most important parameter affecting the performance of the algorithm. Five experimental points were selected for the experiment, and the evaluation metrics were selected Recall_b, Recall_a, Novelty, avg_pop and Coverage, and the average value of the five experimental evaluation indexes was calculated. Figures 10 and 11 show the effect of the N value on the various evaluation indicators of the four algorithms. The data in the figure represents the relative change values of the indicators when the traditional CF and CBR algorithms recommend 20 items.
The PP algorithm and the ER algorithm can significantly improve the novelty of the recommendation system, but the two algorithms are fundamentally different. First, from the value of N, the PP algorithm has the greatest novelty when the N value is small, while the ER algorithm is the largest when the N value is about 400. From the analysis of Recall_a and Recall_b can clearly identify the reasons. The Recall_a of the PP algorithm decreases significantly with the increase of N, the Recall_b increases significantly, and starts to decrease when the N value is greater than 300. It can be seen that when N is very small, PP algorithm can recommend new items well and exclude old ones effectively. However, with the increase of N, this ability decreases rapidly. When N value becomes larger and larger, the accuracy of PP algorithm also decreases. The Recall_a in ER algorithm increases with the increase of N and reaches a maximum when the N value is around 350, while the Recall_b decreases continuously, which leads to the Novelty index reaching a maximum when the N value is around 350. This indicates that the ability of ER algorithm to recommend new items increases with the increase of the number of backup sets, and the ability to exclude old items also increases, so as to effectively improve the novelty of the recommendation system. According to the Avg_pop, PP algorithm and ER algorithm perform exactly the opposite. With the increase of N, the average evaluation times of recommendation list of PP algorithm increase continuously, while ER algorithm decreases slowly. When N value is small, the Avg_pop of PP algorithm is better than that of ER algorithm. When N value is large, ER algorithm performs better. Both the Coverage and the N-value algorithm show a proportional relationship, but the coverage of the PP algorithm is lower than that of the traditional algorithm, and the ER algorithm can effectively improve the coverage rate.
Although both algorithms first generate alternative sets, the meaning of the alternative sets is different. The alternative set generated by the PP algorithm is the most popular item for predicting the future. When the value of N is small, these items are mainly in the growth period and mature period of the item, although later calculated, using novelty but recommended items still focused on the popular trend of the most obvious, and this kind of item at a given point in time when the number is very few, so PP coverage is better than the traditional algorithm of the algorithm. It is also because the recommendation is concentrated on future popular items, so the PP algorithm can greatly improve the novelty of the recommendation system when the N value is small. When the value of N continues to expand, the nature of the items in the candidate set will change. Many classic items are continuously added. Although these items are already in a recession, there will still be some backward users and new users to choose. Therefore, the popularity is not low in the future, which leads to the rising Recall_b, which reduces the novelty of the recommendation system and also worsens the Avg_pop.
The alternative set generated by the ER algorithm is to predict the items that the user likes. When N value is small, the items in the alternative set are basically of high overall popularity, so when Eq. (8) is used for screening, the most popular items are removed, resulting in the decline of Recall_a and Recall_b compared with the traditional algorithm, and the improvement of novelty index is not obvious. With the increase of N, more long tail items are added. Using Eq. (8) can effectively exclude those items that are already in a recession and have a high total popularity, so that the recommendation system is concentrated on items in the introduction period, growth period, and maturity period. Preference sorting in the middle leads to a significant increase in novelty. The diversity of the nature of the alternative centralized items also led to the ER algorithm being able to effectively reduce Avg_pop and improve the ability of the recommendation system to mine long tail items.
In the experiment, the number of alternative set is not considered when N is less than 50. In PP algorithm, alternative set are the items of future popularity, while in ER algorithm, backup sets are the items that users like. Although they choose from different starting points, they are essentially to ensure the accuracy of the recommendation system. If the number of alternative set is too small, then the second step of the recommended algorithm will lose its due role, reducing the space for the algorithm to personalize recommendations. The optimization of the N value depends on factors such as the size of the item space, the number of recommended list items, and the distribution of item prediction popularity.
It can be seen from the experimental results that the method of predicting the popularity of the item can indeed improve the novelty of the recommendation system while ensuring a certain accuracy. In particular, the performance of the PP algorithm is particularly obvious. When the value of the candidate set N is small, the accuracy and novelty can be improved, but the coverage is seriously sacrificed, and the ability of the recommended system to mine long tail items is reduced. The ER algorithm improves the novelty while ensuring the accuracy when the N value is around 350, and the average popularity and coverage index are also greatly improved compared with the traditional algorithm. In summary, the ER algorithm works better in improving the novelty of the recommendation system.
Conclusions
The novelty of the recommendation list is related to the user’s satisfaction with the recommendation system. How to solve the novelty and accuracy is one of the hottest topics in the current recommendation system field. For target users, one of the important factors of novelty of a item is its unpredictability. Simply using the item to be measured by the number of interactions is too rough, and will reduce the accuracy of the recommendation system, mainly because the traditional definition of popularity represents “the wisdom of the masses”, which is closely related to the accuracy of the recommendation system. The novelty recommendation algorithm based on PLC mainly measures the possibility of the user adopting the item by predicting the popularity trend of the item in the future time period, and uses the popularity with time factor to measure the unpredictability of the item to the user, thereby improving the accuracy and novelty of the recommendation system. The PP algorithm and ER algorithm are designed according to the nature of the alternative set. The conclusions are summarized as follows:
The PP algorithm can improve the novelty and accuracy of the recommendation system more effectively than the ER algorithm, but the coverage rate is greatly reduced. Overall, the ER algorithm performs better. By comparing the characteristics of ER algorithm and PP algorithm, it provides a good idea for future research. The PP algorithm mainly focuses on items in the growth and maturity stages, while the ER algorithm mainly excludes outdated popular items, but neither algorithm considers the different attitudes and ways of accepting new products. The novelty of the recommendation list of the ER algorithm is remarkably higher than that of traditional algorithms, the novelty is high when the quantity of alternative sets reaches around 350, where the average popularity of the recommendation list declines by 40%, and the coverage is elevated by 150%, thereby improving the ability of the proposed system to extract all kinds of items.
The time change of popularity is considered in the recommendation algorithm based on PLC, but the difference of users’ attitude towards accepting new products is not considered. The innovation diffusion theory divides users into innovators, early adopters, early public, late public and laggards based on the relative time users adopt new products. Therefore, our future study is that the innovation diffusion theory and the product life cycle theory are combined to recommend items at different life cycle stages according to the user classification of the innovation diffusion theory.
Footnotes
Acknowledgments
This work was supported by Doctoral Research Projects of Guizhou Normal University (program number: GZNUD[2017]36).