
Abstract
In order to solve the problems of the traditional methods in detecting color image edge chromatic aberration, such as the poor accuracy of detection and the poor detection effect, a color image edge chromatic aberration detection method based on artificial intelligence technology is proposed. The approximate principal component analysis method is used to segment the color image and smooth the image denoising; The linear gray-scale transformation is applied to the color image to enlarge the smaller gray-scale space to the larger gray-scale space according to the linear relationship and obtain the edge information of the color image; The artificial intelligence technology is used to locate the edge sub-pixel of the image to complete the edge color difference detection of the color image. The experimental results show that the detection accuracy of the proposed method is about 98%, and the detection effect is good, which is feasible.
Keywords

Introduction
Existing edge detection mainly transforms the image to be processed into grayscale image, and the image edge is regarded as the collection of points in the neighborhood where the grayscale value changes. Edge feature of color image is an important feature of image. The edge of an image is usually the place where the gray level or color of the image changes dramatically [1, 2]. These changes are often caused by the shape and structure of the object, the external ambient light, and the reflection of light on the surface of the object. The edge of the image can directly reflect the contour and topological information of the object. Image edge chromatic aberration detection technology is widely used in industrial detection, image segmentation, motion detection, face recognition, target tracking and other fields. The result of image edge detection directly affects the effect of target detection and recognition. Therefore, it is of great significance to detect the edge color aberration and ensure the integrity of image information. For this reason, researchers in this field have done a lot of research on edge chromatic aberration detection [3]. In reference [4], a subpixel image edge detection algorithm based on Franklin moment is proposed. By building subpixel edge model and using the convolution of all levels of Franklin moment, the detail features of image edge points are obtained. According to the rotation invariance principle of Franklin moment, the relationship between all levels of Franklin moment after the image edge is rotated to the vertical direction is analyzed, and the key parameters of subpixel edge are determined; According to the improved edge judgment conditions, the actual sub-pixel edge points in the image are determined. This method can effectively detect the edge of the image, and the detection speed is faster. However, the method ignores the noise interference in the detection process, and the detection accuracy is poor. In reference [5], an image edge detection algorithm based on interval valued intuitionistic fuzzy sets (IVIFS) is proposed. In this method, the given gray image is transformed into a fuzzy image; The upper and lower extremum of interval valued fuzzy set (IVFS) is constructed by using t norm and t-triangle residual modulus, and the fuzzy image is divided into interval valued fuzzy image; The IVIFS image is constructed by using interval function of membership and non membership, and the intensity relationship between edge pixel and adjacent pixel. The intuitionistic fuzzy edge information is obtained, and the fuzzy edge is obtained by using the de fuzzy mechanism. The image edge is generated by the fuzzy index optimization of the linear equation. This method has good effect on the edge detail detection of the image and strong anti noise ability. However, the operation process of this method is complex and the detection time is long. In reference [6], an improved edge detection method of Gauss Laplace operator is proposed. This method combines with Gaussian filter, smooths the image, suppresses the noise, and detects the edge based on Laplace gradient edge detector. Ten images are selected from the Imagenet data set for experiment, and the proposed Gaussian gradient edge detector is compared with the traditional edge detector. The reliability of this method is verified. But the quality of edge detection needs to be further improved.
Based on the shortcomings of the above methods, this paper designs an edge color difference detection method of color image based on artificial intelligence technology. Artificial intelligence technology is a new technology science which is used to research and develop the theory, method, technology and application system of simulating, extending and expanding human intelligence. Artificial intelligence refers to the technology of presenting human intelligence through ordinary computer programs [7, 8]. Edge detection technology is a basic subject in image processing and computer vision. It is one of the most important links in the underlying visual processing, and also the basis of image segmentation based on boundary. In a digital image, the area where the gray level of an image changes dramatically is called the edge. It can also be described as a collection of pixels whose gray level of surrounding pixels has a roof change or a step change. Therefore, it is of great significance to apply artificial intelligence technology to color image edge color difference detection. Therefore, it is of great significance to apply artificial intelligence technology to color image edge color difference detection.
In order to solve the problems of poor detection accuracy and poor detection effect, a color image edge chromatic aberration detection method based on artificial intelligence technology was proposed. The technical route of this paper is as follows:
In order to improve the detection accuracy and detection effect of color image edge chromatic aberration detection method, it is necessary to segment the color image, smooth the image and de-noising the color image, and carry out linear gray scale transformation on the color image, and improve the detection accuracy and detection effect of color image edge chromatic aberration detection method. Based on the smoothing and denoising of art photographic images, the smaller gray space is enlarged to the larger gray space according to the linear relationship to obtain the edge information of the color image; The artificial intelligence technology is used to locate the sub-pixels of the edge of the image, and the color aberration detection of the edge of the color image is completed. Experimental verification. Taking the smoothing and denoising performance of the fusion algorithm as the experimental comparison index, the proposed method was compared with the algorithm in literature [4, 5, 6].
Through the above scheme, the smooth and noiseless fusion of color image edge chromatic aberration detection method is realized, and the detection accuracy and detection effect of color image edge chromatic aberration detection method are improved.
Color image segmentation
Image segmentation is the basis of color image edge detection, and also one of the basic problems and problems in digital image processing [9]. It is a hot issue in the field of computer graphics. According to the gray level, color or geometric properties of the image, image segmentation distinguishes different regions with special meaning in the image. These regions do not intersect each other, and each region meets specific consistency [10]. The divided area shall meet the following conditions at the same time:
The uniformity and connectivity of the segmented image region. Among them, uniformity refers to a certain similarity criterion that all pixels in the region meet the characteristics of gray, texture, color, etc. connectivity refers to the path connecting any two points in the region. The significance of some selected difference between adjacent segmentation areas. The boundary of segmentation area should be regular to ensure the accuracy of spatial positioning.
In order to detect the edge color difference of color image, this paper uses approximate principal component analysis to segment the image. The color histogram of a gray image refers to the probability density function of image brightness value, which is also the traditional color histogram [11]. It reflects the frequency of pixels at each quantization level within a certain allowed dynamic range. The calculation of traditional color histogram is fast and simple, and will not change with the rotation and translation of the image. But for color image, its color histogram is defined as the joint probability density function of three color channels in the image. It is different from gray histogram, so it is difficult to describe it directly with graph.
Three channels (R, G and b) shall be quantized for the calculation of 3D histogram, and the selection of quantizing series shall comprehensively consider the balance of performance and calculation amount [12]. Generally speaking, each color channel of color image in natural scenery needs 10–20 quantization levels. In this paper, 10 quantization levels are taken for each color channel, and the color after quantization is re marked, so one image is 103 color marks. Corresponding to each color marker, the number of pixels quantized as the color marker in the image is counted, and the 3D histogram obtained is a 3D matrix of 10
First, mark each color in the 3D histogram, compare the number of corresponding pixels in its 26 neighborhood, and get the local maximum point set in its 26 neighborhood, namely:
In the Eq. (1),
Then, the extremum points with small frequency value are eliminated. If the number of pixels in the original image that are approximate to the color value of the point is less than a certain threshold, then they are eliminated, and a new point set
After the above principal component analysis, the texture features of the image are segmented, and there is a certain form of pixel gray level distribution in the texture region. The corresponding relationship between histogram and texture primitives can be established by studying the gray level distribution of pixels in the image [13]. Image entropy is a statistical measure of the randomness of image gray, which is based on the statistical attributes of brightness histogram, and can represent the texture information of image.
In the Eq. (2),
Entropy is the information measure of an image, and texture information is the image information. If the image has no texture, the entropy is close to 0. If the image is full of fine texture, the entropy is larger. The entropy of the rough region is higher than that of the smooth region, because the pixel value of the rough region is more random than that of the smooth region [14].
For each pixel in the image, the entropy value corresponding to 9
In the Eq. (3),
Based on the above gray level analysis, the feature space [16] is established. In order to overcome the influence of different value ranges of each feature, each feature is normalized. Namely:
In the Eq. (4),
Based on the above feature space, the color image is segmented. The 3D histogram of image is established in RGB space, and the main color component of image is obtained by using the unsupervised peak search algorithm. The main color component is the initial clustering center, and the number of main color components is the number of categories, realizing K the initial parameters of mean clustering algorithm are automatically obtained [17], and all pixels of the image are taken as the sample set to be clustered, and each pixel corresponds to a four-dimensional feature vector. The flow of color image segmentation algorithm based on feature space clustering is shown in Fig. 1.
Color image segmentation process.
By synthesizing the image color and texture features, it is allowed to classify the regions with similar texture features into the same category. Compared with the segmentation in color space, the result of clustering segmentation of color image is improved greatly. After adding texture features, it can improve the image segmentation effect, make it more visual coherence, shield the local mutation area, so as to better reflect the general features of the image.
After the above image segmentation is completed, the image edge is processed [18]. The small edge template (small scale) is very sensitive to noise, but it has a high positioning accuracy, while the large edge template (large scale) has a strong ability to remove noise, but the positioning accuracy is low. In order to make the edge detection algorithm have both high positioning accuracy and high anti noise ability, this paper introduces the concept of multi-scale. The advantages of wavelet transform are obvious time-frequency localization, strong multi-scale analysis ability and zoom ability on different scales, and strong detection ability for abrupt signal. The local maximum point of wavelet transform reflects the abrupt point of signal, that is, the edge position of image. The selection of wavelet function is very important. The appropriate detail component of wavelet function decomposition can accurately depict the mutation point of image gray level and detect the accurate edge position. Before the detection of image smoothing, considering the proximity of color image edge operator [19], the image edge is smoothed by bilateral filtering.
Firstly, the illuminance component of image edge is calculated by convolution operation of image. The mathematical expression is as follows:
In the Eq. (5),
For gray-scale image [20], the human eye mainly uses the brightness difference between pixels to analyze the information characteristics of the image. For color image, the human eye uses the brightness, contrast and saturation between pixels to perceive the characteristics of the image. As the color image is studied in this study, in order to improve the smoothing effect of color image, RGB mode information of image is introduced, color bilateral filtering is constructed, and comprehensive illumination of image is obtained. Its function expression is as follows:
In the Eq. (6),
If we want to completely eliminate the illumination component of the image, it will lead to the unnatural phenomenon of the image and affect the information transmission of the edge of the color image. Therefore, the contrast adjustment function is introduced. By adjusting the weight coefficient of the illumination component, the reflection component of the image is adjusted, so as to improve the local contrast of the image. Under the condition that the image is not distorted, the color image of the image is flattened Sliding treatment. Combined with the brightness accumulation feature of the image, the image contrast adjustment function is constructed:
In the Eq. (7),
When RGB mode is used for constraint, the reflection components of the image are:
In the Eq. (8),
The illuminance component
After the above image processing, the color image needs to be transformed into linear gray scale [21]. The linear gray-scale transformation method expands or compresses the whole range or a certain segment of the gray-scale of the image to the dynamic range of the input of the recording device according to a certain linear relationship, so as to fully display the details of the image. Its transformation equation is:
In the Eq. (9),
Through the above calculation, the smaller gray space is expanded to the larger gray space according to the linear relationship. Therefore, the image gray level at the low end of the image can be enhanced very well. At the same time, the expansion of the gray value at the low end of the image will inevitably lead to the decrease of the contrast at the high end of the image gray level. After the above processing, for image edge detection, the detection expression is:
In the Eq. (10),
According to the edge information extraction results of the color image, the image edge sub-pixel is located. Pixel is the smallest unit of image composition [22]. With the improvement of technology, people gradually find that the image information limited to pixel level can not fully meet the needs, especially in the process of detecting image edge, because of the limitation of pixel, many detected edge points are approximated by real edge points nearby. For example, there is a circular object with a size of. For various reasons, the real edge position of the final circular object is shown in Fig. 2.
Edge of circular object with diameter of 5.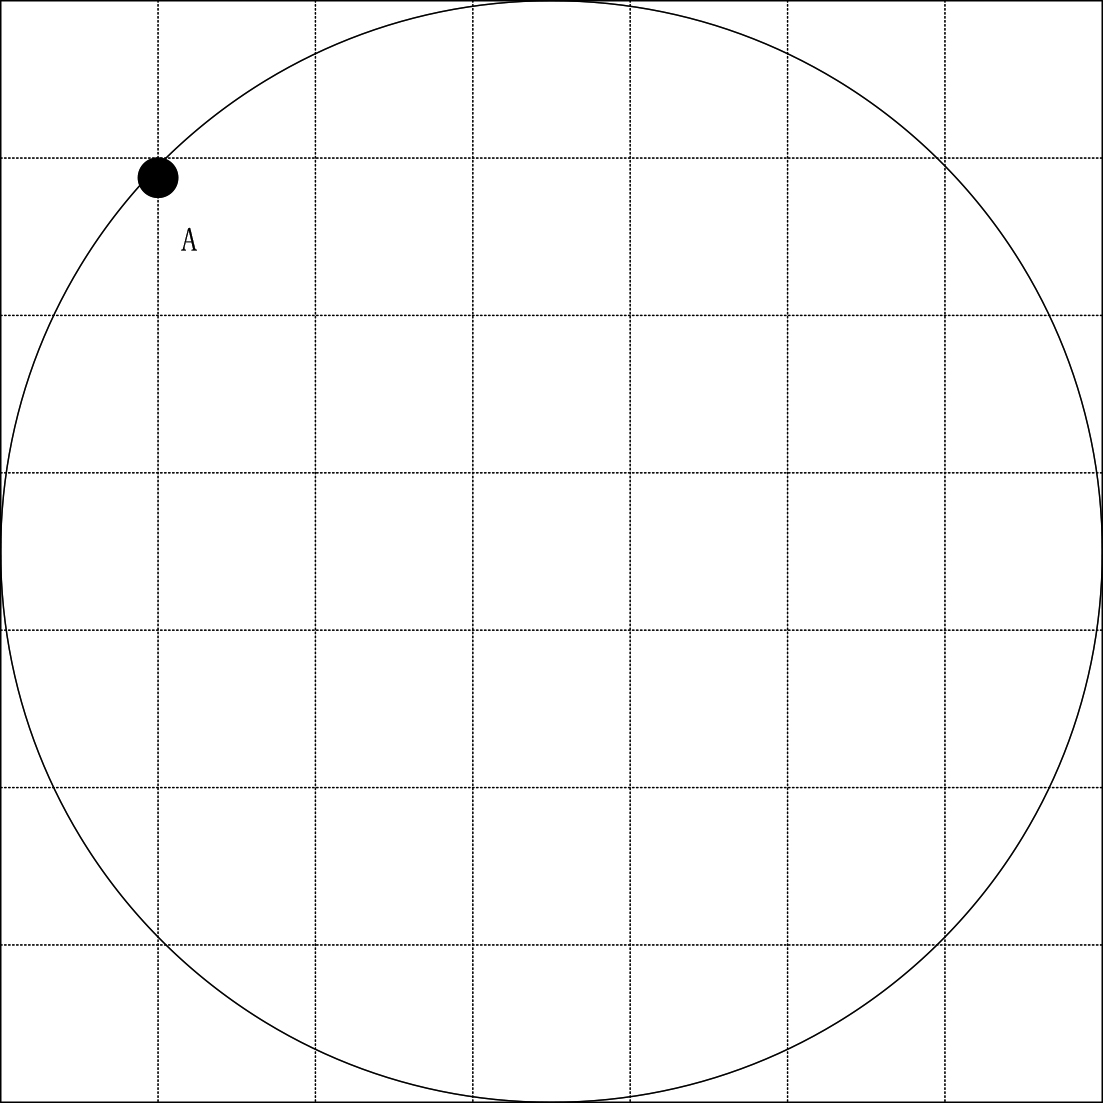
The dotted line represents the pixel cell, and the circle of the solid line represents the real edge of the circular object. However, in the process of actual edge detection, the real edge points, such as point a, do not fall into the pixel cells accurately. In order to output the edge image, these points will be approximately processed to the nearby pixel position. In order to overcome this phenomenon, subpixel algorithm is used to locate the image edge [23]. Subpixel algorithm is to add some points above the pixel points, so as to improve the positioning accuracy, and the number of pixel points will also increase. The steps of detecting image edge with sub-pixel idea are as follows: first, use the existing algorithm to detect the image pixel level edge; Then, use the sub-pixel algorithm to locate the pixel level edge.
The sub-pixel algorithm of the cubic spline in the sub-pixel algorithm is used for calculation. This algorithm is the simplest sub-pixel interpolation method. After determining the points to be inserted, the average value of the three nearby pixels is calculated as the insertion value, and then the points in the neighborhood are processed. The image edge sub-pixel positioning steps are as follows:
Step 1: Define a composite matrix with the same size as the pixel level edge image, determine the location of the point to be inserted, and divide each cell into three times, that is:
In the Eq. (11),
Step 2: In two-dimensional space, three points near the insertion point are found and interpolated with the mean value. The matrix is used to calculate the cubic spline interpolation:
In the Eq. (12),
Step 3: In the edge image of pixel level, according to the gray value of 16 neighboring pixels, the interpolation is calculated by cubic spline interpolation method, so as to carry out sub-pixel positioning. Spline interpolation is shown in Fig. 3.
Schematic diagram of spline interpolation.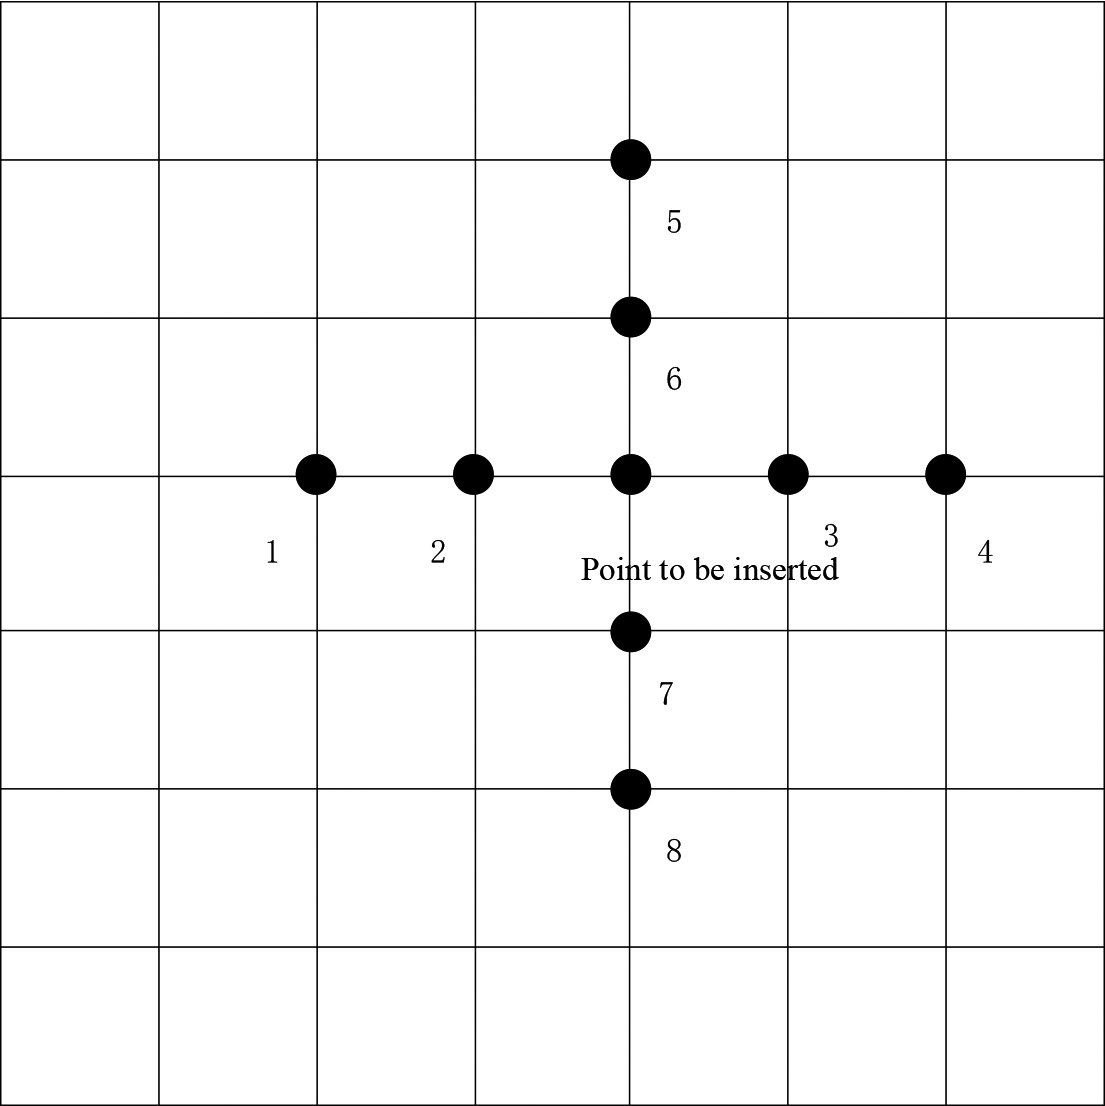
In the other direction of the image, if the other four interpolation points 5, 6, 7, 8 are assumed, another spline can be easily calculated by the above calculation method. To get this interpolation, we can get the required value from two curves.
Step 4: The image edge information similarity measurement, because the edge information in the image contains all the information recorded in the image, so for the image edge information related similarity measurement, the similarity measurement based on the improved watershed algorithm is defined as:
In the Eq. (13),
According to the above definition, the image region similarity measurement is completed. On this basis, the similar small areas generated by watershed algorithm are merged. Traditional methods often ignore spatial region information when merging. The improved watershed algorithm is used to merge similar small areas. The calculation equation is:
In the Eq. (14),
Through the above calculation, the similarity measurement of the adjacent areas of the image is completed, and the similarity small areas after the watershed algorithm are merged [26].
Step 5: Edge thinning. The neural network image recognition technology in artificial intelligence technology is used to refine the edge and get the most accurate sub-pixel edge image. The processing equation is as follows:
In the Eq. (15),
In the Eq. (16),
Through the above process, the edge color difference detection of color image based on artificial intelligence technology is completed.
Experimental environment
In order to verify the scientific validity of the proposed method, simulation experiments are carried out. This paper compares the traditional image edge extraction algorithm based on vector total variation coupling color difference and the CM based high-resolution remote sensing image edge extraction method with this design method. The design of the experimental platform is shown in Fig. 4.
Experimental parameters
Experimental parameters
F Focus – Camera focal length, m; k – Distortion coefficient, dimensionless; Sx – Width of pixel size, M/pixel; Sy – Height of pixel size, M/pixel; Cx – Abscissa of image center, pixel; Cy – Vertical coordinate of image center, pixel; Width – Image width, pixels; Height – Image height, pixels.
Experimental platform.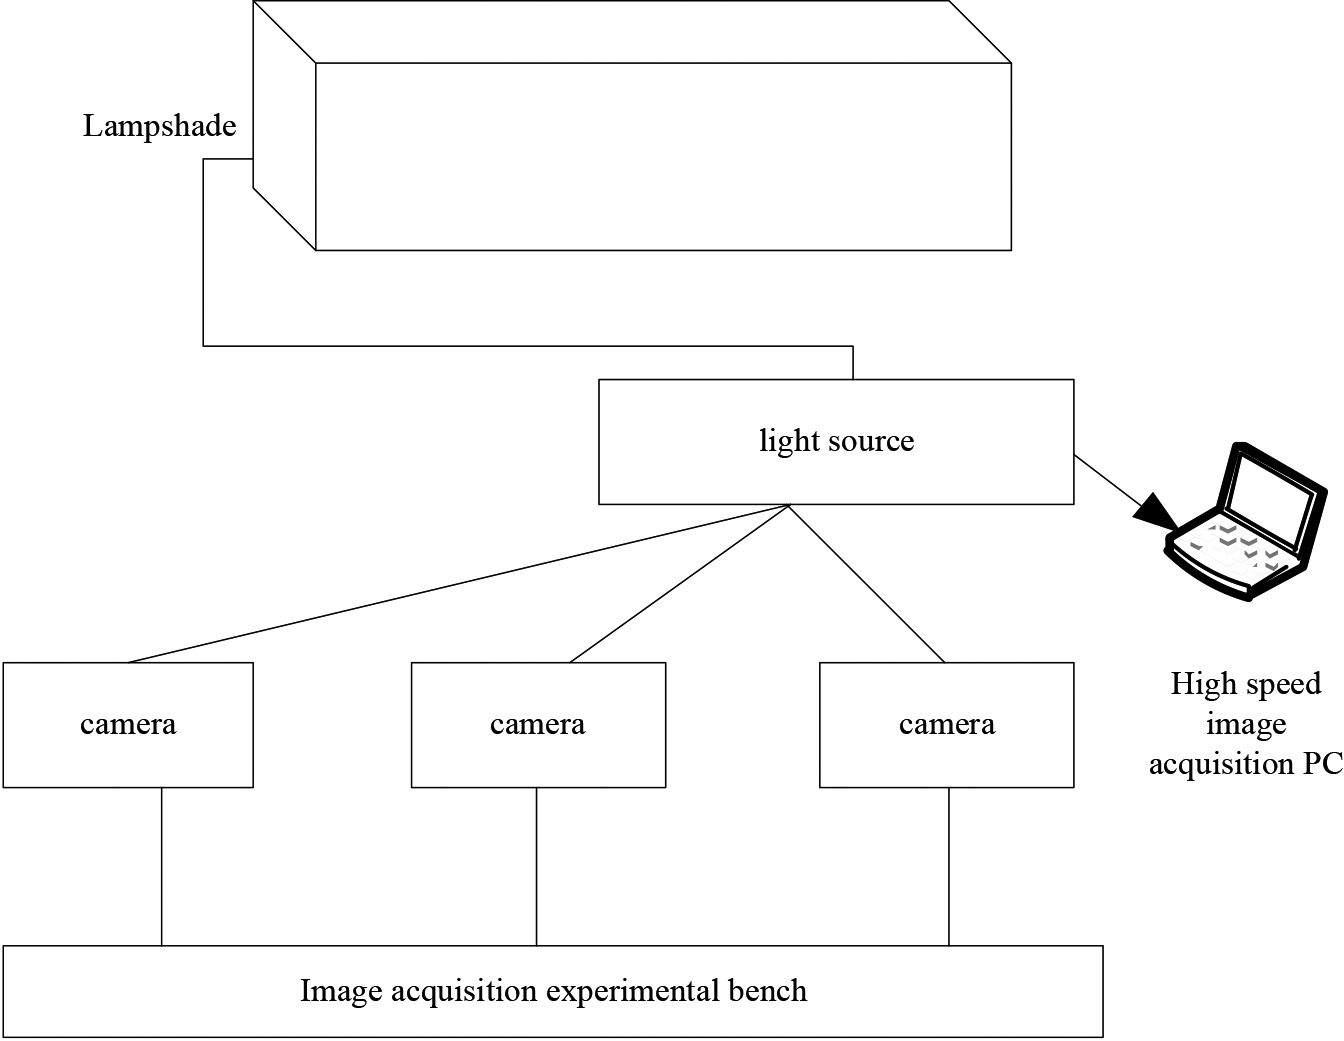
In the figure, the processor parameters of PC end host are inter (R) core (TM) i5-4590; CPU is 3.30 GHz, memory is 16 GB, customized light source is adopted, and the light source intensity is adjustable; Light source range is greater than 300 mm
The name of calibration plate is dot calibration plate, and the specification is 200
During the experiment, adjust the aperture, focus and object distance of the experimental camera to make the collected image present a better field of view and clarity. Once the camera is adjusted, the aperture, focus, object distance of the camera and the position relationship between the two cameras will not be changed in the subsequent experiments. By continuously adjusting the position and pose of the calibration plate, 24 calibration images obtained synchronously by the camera are shown in Fig. 5.
Calibration picture of experimental camera.
The experimental parameters are shown in Table 1.
Result analysis
The effect analysis of different methods to detect the edge color difference of color image
In order to verify the reliability of the proposed method, the edge extraction algorithm of vector total variation coupled with color difference, the edge extraction method of high-resolution remote sensing image based on cm and the proposed method are used to detect the edge color difference of sample image, and the detection results are shown in Fig. 6.
Comparison of edge detection results of color image 1 by different methods.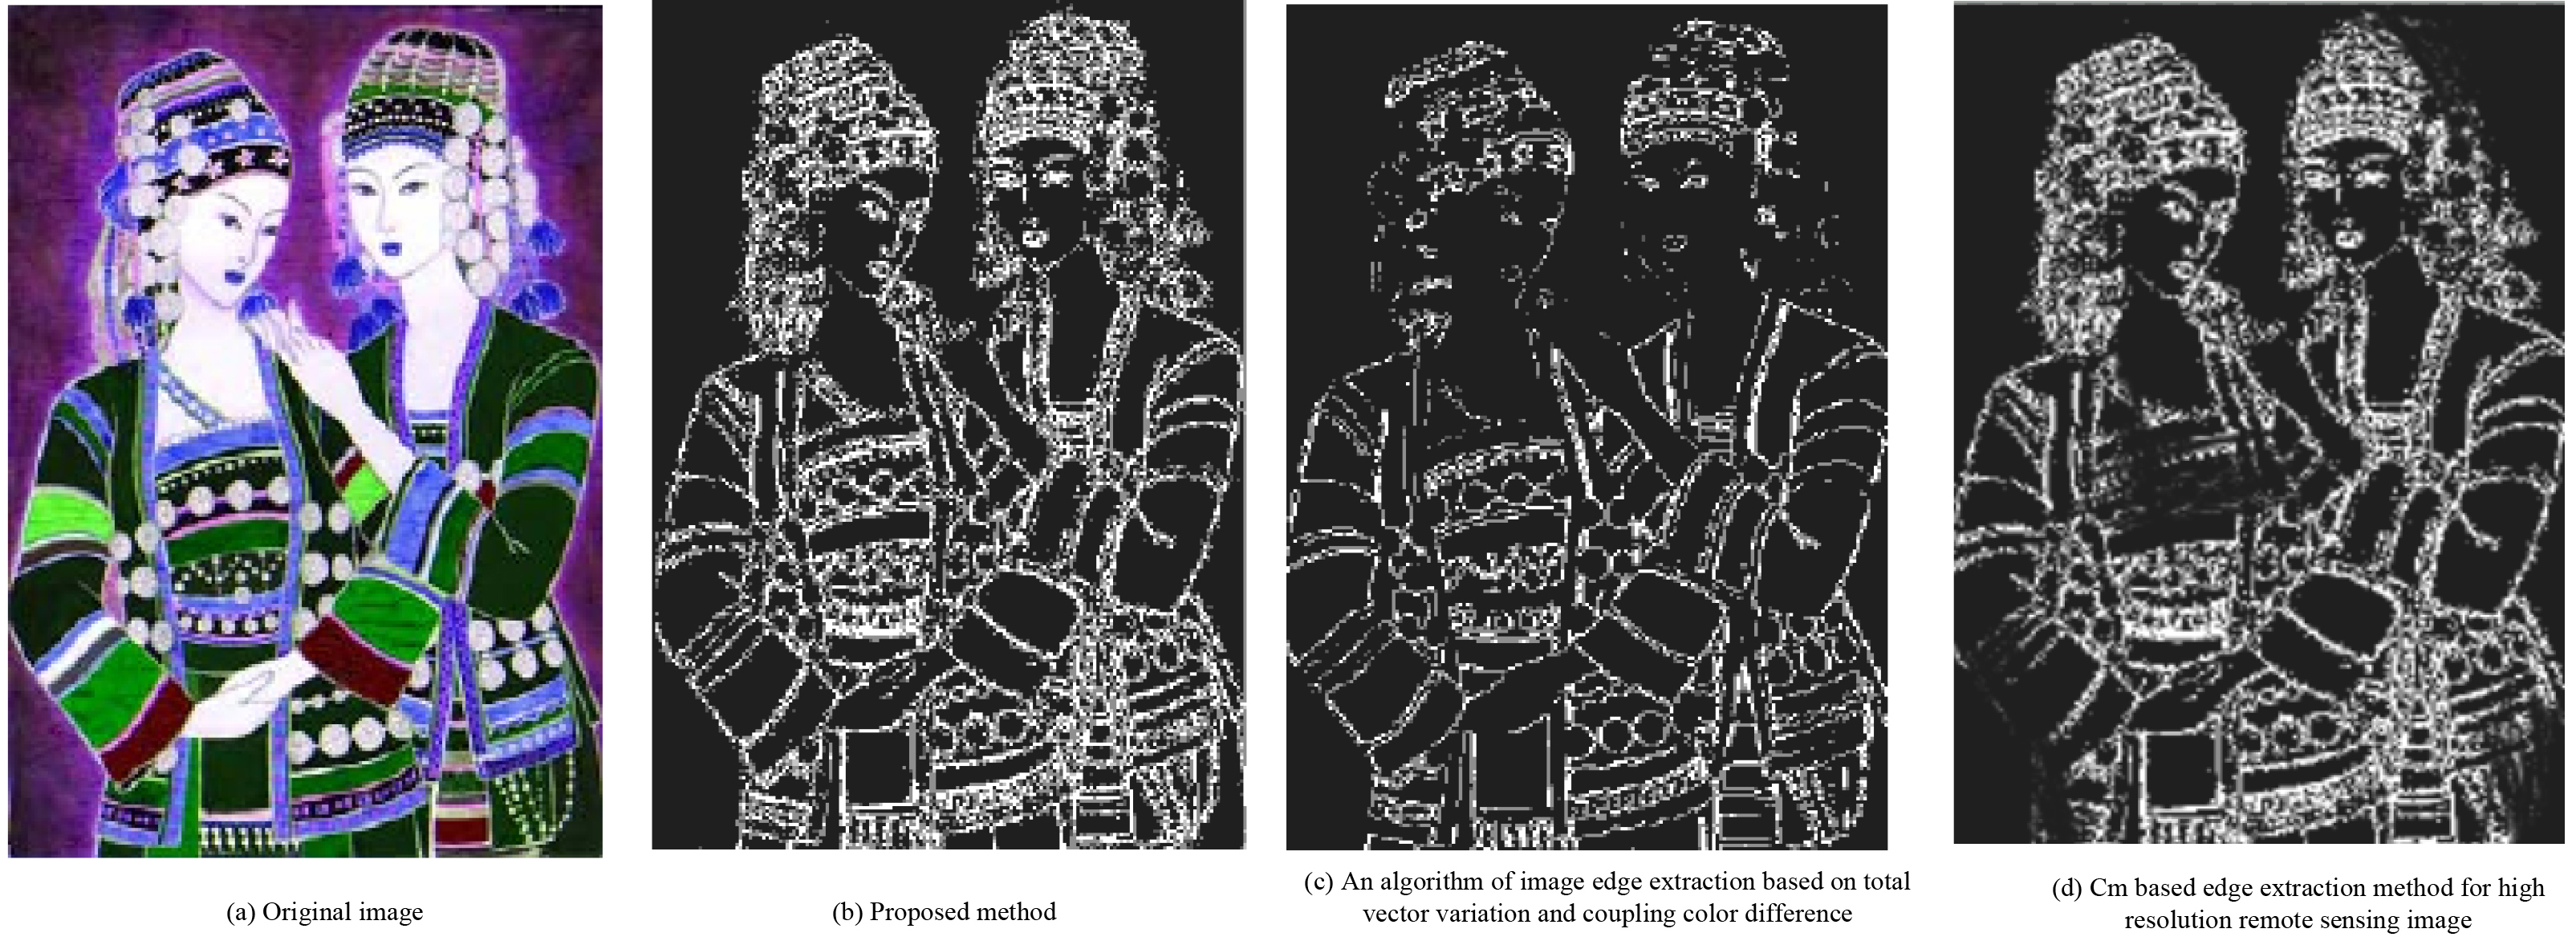
As can be seen from the analysis in Fig. 6, under the same experimental environment, there are certain differences in the detection effect of the three methods on the edge chromatic aberration of the sample images. Among them, the proposed method can directly improve the accuracy of color image edge chromatic aberration detection by using remote sensing technology and color image edge chromatic aberration detection. However, the detection result of vector total variation coupled chromatic aberration image edge extraction algorithm is not complete, which will have a certain impact on color image edge chromatic aberration detection. A high resolution remote sensing image edge extraction method based on CM. The edge information extracted by this method is also less, which proves that this method is not effective in chromatic aberration detection. This is because the method uses artificial intelligence technology to locate the edge subpixels of the image, thus improving the detection effect.
In order to verify the feasibility of the proposed method, the edge extraction algorithm of vector total variation coupled with color difference, the edge extraction method of high-resolution remote sensing image based on cm and the accuracy of the proposed method for edge color difference detection of sample image are analyzed in the experiment. The experimental results are shown in Fig. 7.
Comparison of the accuracy of different methods to detect the edge color difference of color image.
From the analysis in Fig. 7, compared with the other two methods, it can be seen that there are some differences in the accuracy of edge chromatic aberration detection of color images based on the target edge extraction method of CM high-resolution remote sensing images using this method and the coupled vector image edge extraction algorithm of total chromatic aberration change. Among them, the detection accuracy of this method is always higher than the other two methods, and the highest detection accuracy is about 98%, while the highest detection accuracy of the other two methods is about 65% and 62%, respectively, compared with this method, the detection accuracy is improved by about 33% and 36%, respectively. This is because the method can smooth the color image after segmentation, suppress the noise in the image, and improve the accuracy of edge chromatic aberration detection.
In order to verify the feasibility of the proposed method, the experiment compares the proposed method, the image edge extraction algorithm of vector total variation coupling color difference and the edge extraction method of high-resolution remote sensing image based on cm. When detecting the edge color difference of color image, the experimental results are shown in Table 2.
Time comparison of different methods for detecting edge color difference of color image (s)
Time comparison of different methods for detecting edge color difference of color image (s)

Footnotes
Acknowledgments
This study was supported by Fujian University Humanities and social sciences research base new media communication research center (Minjiang University) plans to set up an open project (FJMJ2018A02).