
Abstract
Some factors affecting the physical and mental health of vocational college students, the sense of inferiority plays a very important role in cultivating students with physical and mental health. Inverse random under sampling algorithm is improved based on integrated learning, which can improve the performance of the classifier. Stacking integrated learning and flip random sampling reduction algorithm SIRUS is proposed. Select the individual subjective factors studied in this paper is important in self-attribution and social objective factors are important social support factors, and the only demographic variables is a significant difference.
Keywords
Introduction
Inferiority is a common psychological phenomenon in human society. Before it became the research object of psychology, it first appeared in the works of Stendhal, a writer, who believed that “inferiority is an outstanding human soul disease” [1]. French psychopathologist and psychologist Janet (1859–1947) was the first person to give a scientific explanation of inferiority. He believed that inferiority was dominated by the stubborn idea that everything goes wrong [2, 3, 4, 5, 6, 7].
Experimental interventions for low self-esteem have also been relatively rare. Existing studies mainly include: Hong using standardized inferiority scale (FIS) [8, 9, 10, 11, 12] randomly surveyed 567 full-time undergraduate students, Yangzhou university, and screening out the inferiority problems of college students, a total of 88 (FIS divide, 4) [13, 14, 15, 16, 17], through the statistical analysis, reveals the characteristics of college students’ inferiority complex, and recruit were screened out, will be randomly divided into experimental group and control group, the subjects were accepted for 9 weeks psychological intervention, the experimental intervention group hypnosis guidance, and in the same condition of the control group only group guidance, results show that the long-term effect of group hypnosis guidance is superior to the general group guidance, it is very applicable to the general psychological problems of college students.
Methods
This study randomly selected 100 students from three vocational and technical colleges of Yantai vocational college, Yantai business vocational college and Yantai engineering vocational and technical college. A total of 280 questionnaires were distributed and 278 questionnaires were recovered, with the recovery rate of 99.2%. The incomplete and invalid questionnaires were eliminated, leaving 277 valid questionnaires with an effective rate of 99%. The basic information is shown in Table 1.
Basic information of subjects
Basic information of subjects
School: 1. Yantai engineering college; 2. Yantai business vocational college; 3. Yantai vocational college.
Firstly, the concept of confusion matrix is defined: suppose that in the original data set, the number of a few class samples (true class) is
Confusion matrix
The following formula can be calculated and obtained [2, 3, 18, 19, 20, 21, 22, 23, 24, 25, 26]:
Their meanings are: False true rate is called False true rate, which means the proportion of the samples of most classes that are misclassified as a few classes in all the classes. Specificity is designated as Specificity, indicating the correct proportion of specific samples in most samples. Recall, also known as true class rate, refers to the proportion of correctly judged samples in a small number of class samples. Precision is called Precision rate [27], which represents the proportion of correctly classified samples among all samples classified as a few classes. Global-mean is the geometric average of specificity and recall rate, indicating the comprehensive performance of accuracy of the two categories. Recall or Precision alone cannot accurately evaluate the performance of the classifier. For example, if there are a total of (
Confusion matrix
The social support rating scale (SSRS) [7, 11, 16, 23, 26, 27] of Xiao shuiyuan was used to test the status of social support. The scale consists of 10 items, including three dimensions of objective support (3), subjective support (4) and the utilization of social support (3). The consistency coefficient of the two-month retest total score of the scale is 0.92, and the internal consistency of each item is between 0.89 and 0.93, showing that the social support scale has a more retest reliability [9]. In this measurement, the consistent Aplpha coefficient of the total score was 0.90, and the Aplpha coefficients of objective support, subjective support and support utilization were 0.87, 0.89 and 0.83.
According to the actual situation of higher vocational students, some items in the scale are modified. In question 2, remove the word “colleague” from option 3. In the third question, “neighbor” is replaced by “roommate”; In question 4, replace “colleague” with “classmate”; The “husband and wife” in the fifth question is replaced by “lovers”, and remove the “children” column; The 6, 7 in “spouse” to “lover”, “colleague” to “classmate”, “work unit” to “teacher”; In question 10, “labor union” is replaced by “class committee”.
The overall situation of inferiority feeling of students in vocational colleges. The scores of each dimension of inferiority were processed to obtain the mean and standard deviation of each dimension. The results are expressed in Table 4.
Standard and mean deviation of each dimension of students’ inferiority
Standard and mean deviation of each dimension of students’ inferiority
From the data shown in Table 4, it can be seen that the students of vocational colleges in the various dimensions of the sense of inferiority and the overall score are in the points (2 points) below, that is, there is no obvious sense of inferiority. This is consistent with the existing research conclusions on the inferiority of college students in China, and also in line with the current situation of college students in Shandong. The scores of each dimension were ranked from high to low in the order of personality inferiority, appearance inferiority, communication skills inferiority, learning experience inferiority, developmental inferiority and family love inferiority. The higher the score, the stronger the inferiority feeling in this dimension. On the contrary, the lower the score, the weaker the inferiority feeling in this dimension.
In order to test whether there is any difference in subjects among various dimensions of inferiority of vocational college students, independent sample T test is conducted on the data, and the mean, standard deviation and T score obtained are shown in Table 5.
Independent sample
Note:
There are significant differences in the dimension of self-abased personality among vocational students of different disciplines (
In information theory, entropy refers to the uncertainty of a random variable. Let R be a discrete random variable with a finite number of values, and assume that X has the following probability distribution [7, 11, 21, 22, 23, 24, 25, 26, 27]:
So the entropy of our random variable Y is going to be like this:
The higher the entropy, the greater the uncertainty of the random variable. Let the joint probability distribution of random variables (
The calculation formula of conditional entropy
where
Information gain glo (
The algorithm for calculating information gain is as follows:
calculate empirical entropy
calculate the empirical condition entropy
calculate information gain:
According to the above calculation, it can be seen that the size of information gain is relative to the training set, and the greater the empirical entropy of the training set is, the greater the information gain will be, without any absolute significance. The information gain ratio is corrected for this problem. The information gain ratio
ID3 algorithm USES [3, 4, 5, 6, 7, 8] the index of information gain to select features on each node of the tree and constructs the tree recursively. Therefore, ID3 is used to select attributes with more values, which often results in a huge but shallow decision tree. Moreover, ID3 algorithm only generates trees, so it is easy to generate overfitting problems. To solve the above problems, algorithm changed the feature screening criteria from information gain to information gain ratio during the training stage.
Suppose that in the original training set [26],
Initialize Randomly samples s samples from Compose Using Judge whether Train the classifier on the dataset, and judge whether the performance of the classifier on the dataset is greater than max. if so, update the set to the set of current sets data subsets. Let The data subset set in set is the final data subset.
The above algorithm sets the minimum value of the number of samples s extracted from the majority of class sample sets to
For example, logistic regression will output a real value
The Siglmoid function image is shown in Fig. 1.
In order to test whether there is any difference in disciplines among various dimensions of self-attribution of higher vocational students, independent sample
Independent sample
Note:
Siglmoid function.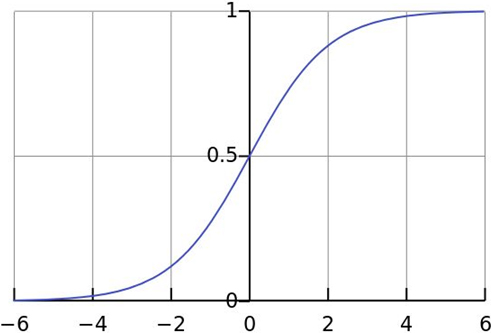
Seen from Table 6, there is a difference in the discipline of students’ ability attribution in vocational colleges (
On the whole, the inferiority level of students in vocational colleges has not reached the average of inferiority, that is, students in vocational colleges have no serious inferiority. There are significant differences in demography variables such as gender, discipline, origin and oneness of students in the sense of inferiority, attribution and social support of vocational students.
College student inferiority look inferiority dimension grade level difference is significant; There are significant differences in the dimension of personality inferiority. The total inferiority feeling of college students in gender, whether the only child and students on the ground, there is no significant difference, and each dimension in the above level there is no significant difference. The relationship between inferiority, attribution style and academic performance
There is a significant true correlation between each dimension of inferiority feeling and each dimension of attribution style. Inferiority of communication skills is significantly truly correlated with subjective support, support utilization and social support total score, while other factors are significantly falsely correlated. Except that there is no significant correlation between effort attribution and subjective support, all the other dimensions have significant false correlation.