
Abstract
China is one of the countries that have entered the stage of population aging. At present, the phenomenon of aging population has become a widespread concern of the whole society. Scientific and accurate prediction of aging population will help relevant departments to formulate specific countermeasures. This paper uses the Yearbook of China’s 1% population sampling survey in 2015 and the data published by the National Bureau of statistics. Based on the basic population prediction formula, the population prediction formula is established by using the index extrapolation method to predict the population aging development trend of provinces and cities in China from 2020 to 2050. The results show that: China’s aging degree will continue to increase, the size of the elderly population will continue to increase, 2020–2030 will be a period of rapid growth of the national population aging, after then the aging ratio will decline. The government should formulate security countermeasures for the elderly from various aspects as soon as possible and actively respond to aging the population.

Introduction
The aging of population is a global phenomenon. It not only restricts the economic development in many aspects, but also seriously affects the social stability. However, due to the differences of aging in different countries, the coping methods needs to be determined according to the national conditions. In recent years, China has gradually taken some measures to tackle the problem of aging, such as opening-up the two-child policy (ZHONGHUA RENMIN GONGHEGUO GUOWUYUAN GONGBAO), even three-child policy now (CCTV news), extending the retirement age (Global network) and so on [1, 2, 3]. However, it is very important to analyze and predict the trend of population if we want to deal with the problem more effectively.
Tong et al. [4] used the population prediction software PADIS to predict the aging trend of urban and rural population based on the adjusted data of the 2010 population census, and concluded that the migration between rural and urban areas can effectively alleviate the aging process of urban and rural population, but in the future, if we do not deal with it, cities will also face greater pension difficulties. Chen et al. [5] built an ARIMA model to predict the future age-specific and gender-specific population mortality fitting value, and concluded that the total number of elderly population in China will reach 398 million in 2030, 498 million in 2050, and 2020–2030 is a period of rapid aging development. Li [6] established GM (1, 1) model to predict that China’s aging degree will be serious in the future, and the aging ratio will continue to rise. Zhai et al. [7] believe that the size of China’s population will enter negative population growth in 2029, the age structure will continue to age, and the elderly population will continue to increase.
China’s aging population has the following characteristics: (1) The absolute number is large, and the absolute number of China’s aging population accounts for about 20% of the world, which is the country with the largest absolute number [8]. As the population base of China is relatively larger than that of other countries, coupled with the improvement of economic level, the support of various welfare policies to benefit the people, and the improvement of medical and social security measures, etc. As a result, people’s life span is prolonged, and the size of the elderly gradually increases. (2) The process of aging is fast. The standard of judging aging in China is that the proportion of people aged 65 and above in the total population of the whole country or a certain region reaches 7%, which proves that China or the region has entered the aging process. According to the survey, in less than 30 years, China has increased from 5% to 9%, far faster than the development speed of other countries [9]. (3) The regional distribution is uneven. The overall analysis of China’s population aging degree shows that because a large number of rural young people go to work in city, the aging ratio in rural areas is higher than that in cities, and economically developed regions (such as eastern and central regions) are higher than regions with slower economic development (such as western regions) [10].
However, with the gradual saturation of urban labor force, the number of rural migrant workers will decrease, and the implementation of Western Development Strategy, the gap of aging degree between regions will become smaller and smaller, and the proportion of the elderly in rural areas will also decline and the aging process in all regions will slow down to a certain extent [11].
Many models and methods for population prediction have been developed. However, there are many problems in the model and method, the gray prediction model considers a single factor that affects the population, and the accuracy of the conclusion is insufficient. It is suitable for short-term small-sample population data prediction [12]; The BP neural network model requires a large amount of sample data for training and testing and automatically summarizes the inherent laws. If the number of samples is not enough, the prediction error will be large [13]. Based on this, in order to avoid the above problems and reduce errors, this paper uses the basic formula of population prediction, then expands the basic formula, uses the fertility rate, mortality and the number of women of childbearing age of the population as the factors of the model, and uses the Yearbook of China’s 1% population sampling survey in 2015 and the data published by the National Bureau of statistics to establish a model to predict the future population size.
This paper first introduces the importance of predicting population aging, the results of previous scholars and the characteristics of population aging in China, then analyzes the reasons for the development of population aging, such as longer life expectancy and low fertility rate. Then it finds the basic law of population aging in China from national and regional data, and estimates the trend of population aging with population expansion forecast formula. Finally, some suggestions are put forward.
The causes of aging
Population prediction requires more demographic indicators. First, clarify several concepts:
Fertility rate: refer to the number of live births per 1000 women of childbearing age throughout the year. Birth rate: refer to the percentage of the number of babies born each year in the total population per thousand. Mortality rate: refer to the percentage of deaths per thousand of the total population each year. Women of childbearing age: refer to women in the childbearing age period of 15–49 years. Total dependency ratio: refer to the ratio of non working age population to working age population in the total population. The total dependency ratio is equal to the sum of the child dependency ratio and the elderly dependency ratio. Elderly dependency ratio: refer to proportion of the elderly population aged 65 and above in the population of working age. Child dependency ratio: refer to the proportion of children aged 0–14 in the population of working age.
As shown in Fig. 1, with the rapid development of China’s economy, the improvement of people’s living standards, the improvement of medical and health standards, and the perfection of social security system. The life expectancy of the population has been continuously extended, and the proportion of the elderly population has continued to increase. Qiao [14] believes that economic development, the improvement of education and the increase of health institutions can promote the improvement of per capita life expectancy. Wang and Zhu [15] believe that the improvement of per capita GDP, per capita consumption expenditure and people’s education level will help to improve per capita life expectancy. Liu and Zhao [16] used VAR model to empirically analyze that the improvement of consumption level and education level has a positive impact on life expectancy.
Life expectancy of the Chinese population. Data source: National bureau of statistics.
According to statistics from the “China Population and Employment Statistical Yearbook”, as shown in Fig. 2, after the implementation of the family planning policy in the 1990s, China’s fertility rate dropped rapidly and drastically. The fertility rate dropped from more than 50‰to 30‰. The decline in fertility rate has reduced the number of women of childbearing age, slowed down the growth rate of the total population, and gradually increased the degree of aging.
The social environment corresponding to changes in fertility rate: In the first stage, in 1991, the CPC Central Committee made The Decision on Strengthening Family Planning and Strictly Controlling Population Growth, clearly enforced the family planning policy and strictly controlled population growth. The government advocated late marriage, childbearing, fewer and eugenics, one couple only can give birth to one child [17]. Therefore, the fertility rate has maintained a downward trend and the rate of decline is fast. In the second stage, in 2002, The Population and Family Planning Law of the People’s Republic of China came into force, which stipulates that “those who meet the conditions specified in laws and regulations may require arrangements for the reproduction of children”. From 2002 to 2008, the fertility rate fluctuated slightly and maintained a downward trend as a whole [18]. In the third stage, in 2013, the third session of the 18th CPC Central Committee adopted The Decision of the CPC Central Committee on Several Major Issues of Comprehensively Deepening Reform, launched the policy that couples to have two children if one parent is a single child, that is, “selective two-child policy” [19]. The fertility rate increased slightly and fluctuated steadily. In the fourth stage, in 2016, China officially implemented the “comprehensive two child” policy, that is, a couple is allowed to have two children [1]. Therefore, the fertility rate began to show an upward trend.
Fertility rate of women of childbearing age in China from 1995 to 2019.
Whole country
Trend chart of aging rate in China from 1990 to 2020 (the proportion of the elderly over 65 years old in the total population). Data source: National bureau of statistics.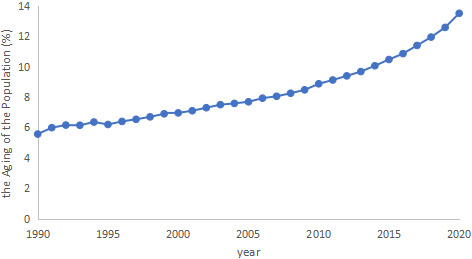
Trend chart of national dependency ratio from 1990 to 2020. Data source: National bureau of statistics.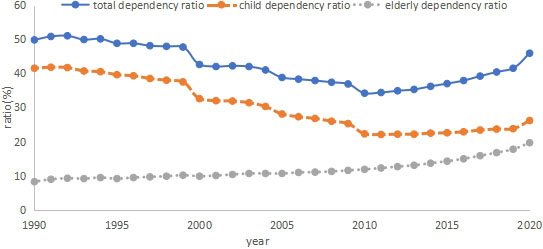
As can be seen from Figs 3 and 4, in the first stage, from 1990 to 2010, the national aging rate rose slowly, rising by 3.3% in 20 years. The total dependency ratio and the child dependency ratio have been on a downward trend, while the elderly dependency ratio has risen slowly with a small increase. The total dependency ratio and the child dependency ratio have declined rapidly. By 2010, the child dependency ratio has decreased by 19%, and the total dependency ratio has decreased by 15.6%. The total dependency ratio continues to decline and the demographic dividend continues to rise. The lower the total dependency ratio, the higher the demographic dividend, indicating that a country’s working-age population accounts for a larger proportion of the total population, creating favorable demographic conditions for national development. In the second stage, from 2011 to 2020, China’s aging population increased rapidly, with an increase of 4.4%. The total dependency ratio and the child dependency ratio have become an upward trend, and the total dependency ratio and the old-age dependency ratio have increased significantly. The total dependency ratio increased by 11.5%, the child dependency ratio increased by 4.1%, and the elderly dependency ratio increased by 7.4%. The rapid rise of the elderly dependency ratio, the aging and the continuous increase of the total dependency ratio indicate that the number of elderly people has increased sharply in recent years, and the proportion of the elderly population in the total population and the working age population is significant.
Trend of aging rate in different regions (the proportion of the elderly over 65 years old in the total population). Data source: National bureau of statistics.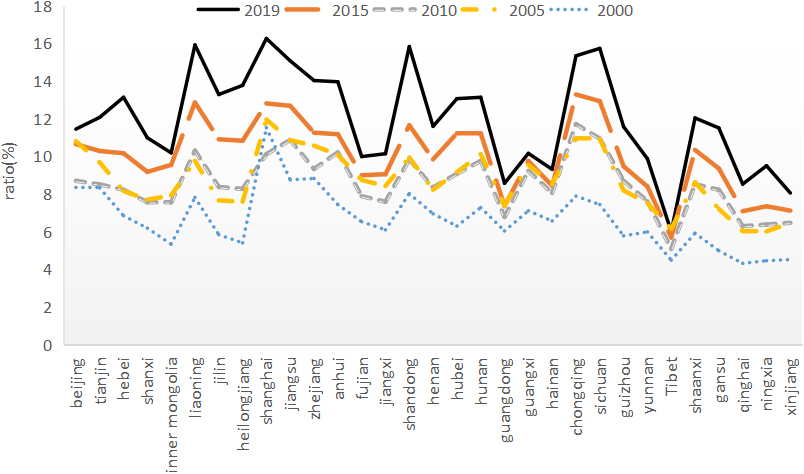
Trend of elderly dependency ratio in different regions. Data source: National bureau of statistics.
As can be seen from Figs 5 and 6, the degree of aging and the elderly dependency ratio in various regions are increasing year by year. In 2000, Beijing, Tianjin, Liaoning, Shanghai, Jiangsu, Zhejiang, Anhui, Shandong, Hunan, Chongqing and Sichuan have entered the aging society. During the period of 2005–2010, the aging and elderly dependency ratio in various regions changed little, and even decreased in some regions. From 2000 to 2019, the elderly dependency ratio of Guangdong, Hainan and Tibet has a small change, about 2%. By 2019, the aging degree of Shanghai, Liaoning, Shandong, Sichuan, Chongqing and Jiangsu were more than 15%. Among them, Shanghai’s population aging has reached 16.3%, ranking first in China.
Data selection
This paper uses the Yearbook of China’s 1% population sampling survey in 2015 as the base year data. The data used include the population of age groups, the number of women of childbearing age, the sex ratio at birth, the mortality of age groups and the fertility rate of women of childbearing age in 2015.
Modeling
Modeling idea: Suppose that in a province, the population migration between that province and other provinces is ignored, so that each province will develop population as a closed area, so the population of each province will depend on the fertility rate and mortality rate. At the same time, assuming that the future social environment will be stable in the next 35 years, and demographic indicators such as age group mortality, sex ratio at birth, and age group fertility rate of women of childbearing age remain unchanged, we can calculate the birth population data through the known age group mortality, fertility rate, sex ratio at birth and age group population.
In this paper, the population of each province is divided into an age group every 5 years old, and the population over 100 years old is the last group, a total of 21 groups. Each age group was numbered (i), 0–4 years old is the first group, 5–9 years old is the second group, …, and over 100 years old is the 21st group. Each age group separately counts the total number of people, the number of men, and the number of women. Therefore, the population size is estimated at intervals of 5 years.
The population in the base year used in this paper is the population of each province in the 2015 China 1% population sampling survey data, and the birth sex ratio (R) is the birth sex ratio of each province in the 2015 China 1% population sampling survey data. Mortality rate (d) refers to the mortality rate of age group in each province in the data of China’s 1% population sampling survey in 2015. The fertility rate (R) is the fertility rate of women of childbearing age in all provinces in the data of China’s 1% population sampling survey in 2015.
Predict the population size
Suppose the total population of
The number of births
According to the prediction formula, the calculation steps are as follows:
The first step is to count the number of women of childbearing age. The number of women of childbearing age in group
The second step is to calculate the number of births. The number of births is the number of women of childbearing age in group
The third step is to calculate the number of deaths. The death toll is the sum of the number of the
Schematic diagram of the development trend of aging rate in various regions of China (The proportion of the elderly over 65 years old in the total population). Note: In the histogram of each province in the map, yellow represents the aging rate from 1990 to 2019, and red represents the predicted aging rate from 2020 to 2050.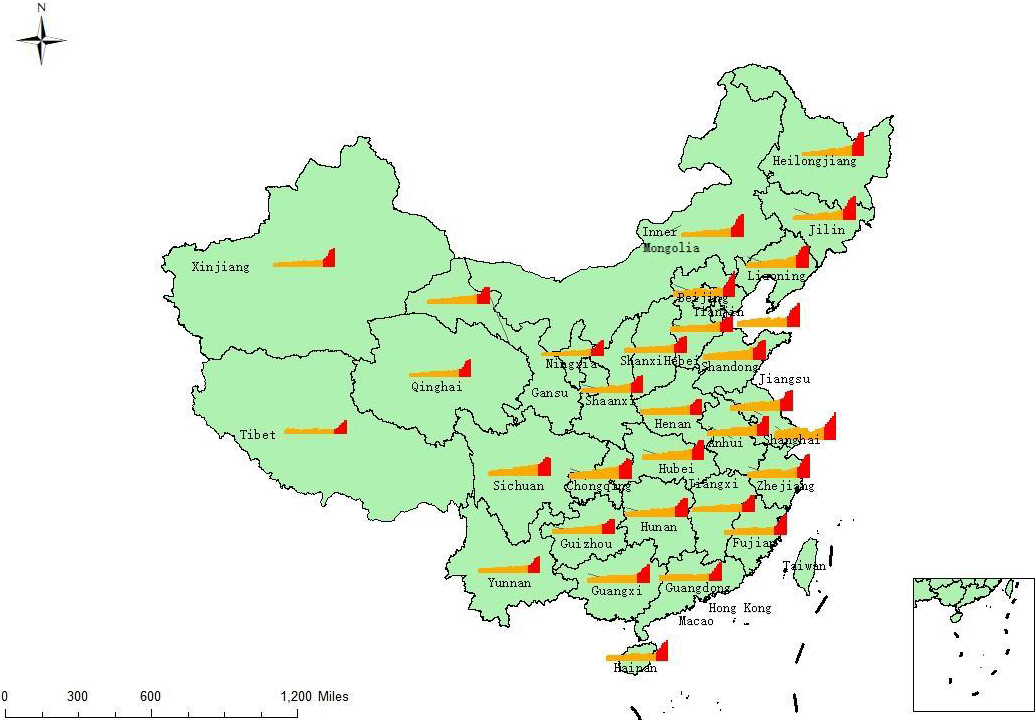
It should be noted that the mortality rate of the 21st age group (over 100 years old) still uses the 21st death rate (
Substitute Eqs (2)–(4) into Eq. (1) formula, and the formula is:
The sex ratio at birth (R) affects the number of women of childbearing age in the region after 15 years. The number of females in newborns (
After calculation, the predicted results are as follows: China’s population will reach 1.417 billion in 2020, 1.415 billion in 2030 and 1.294 billion in 2050. According to the published yearbook of the seventh China census, China’s population is about 1.412 billion in 2020, and the error between the prediction results and the official data is about 0.38%.
The forecast results show that: (1) The total population aged 65 and over in China: 190 million in 2020, 268 million in 2030 and 376 million in 2050. The proportion of the elderly aged over 85 years in the population aged 65 years and over in China: 7.40% in 2020, 7.67% in 2030 and 13.02% in 2050. (2) The proportion of the elderly over 60 years old in the total population: 18.75% in 2020, 22.64% in 2030 and 33.00% in 2050. The proportion of the elderly over 65 in the total population: 13.40% in 2020, 18.90% in 2030 and 29.06% in 2050. The use of the above two aging standards shows that China has entered aging and the aging growth rate is fast.
Forecast results of population aging rate of provinces in China in 2030 and 2050
Forecast results of population aging rate of provinces in China in 2030 and 2050
Many scholars have also predicted the population size of China. Cao [20] predicted that the proportion of the elderly aged 65 and over in the total population is 13.21% in 2020 and 18.21% in 2030 by using Leslie model. Du and Li [21] used the cohort element method to predict that the proportion of China’s elderly population aged 60 and over in the total population is: 18.1% in 2020, 26.9% in 2030 and 37.8% in 2050; The population aged 65 and over is 180 million in 2020, 251 million in 2030 and 362 million in 2050. The proportion of the population aged 65 and over in the total population is 12.9% in 2020, 17.9% in 2030 and 38.6% in 2050. It can be seen that the prediction results of this paper are not different from those of other scholars.
From a regional perspective, the aging population of Beijing, Tianjin, and Shanghai is growing rapidly. Between 2015 and 2030, it is expected to increase by about 15%, and between 2030 and 2050, it will increase by more than 18%. The proportion of the elderly over the age of 60 in the total population: 27%, 28%, and 30% respectively in 2030. In 2050, they will be 48%, 45%, and 49% respectively. In the three provinces of Liaoning, Jilin and Heilongjiang, the proportion of the elderly over 60 years old in the total population will exceed 30% in 2030 and reach 40% in 2050. The degree of aging in Guangdong Province has always been at a relatively low level in the country. In 2030, the proportion of elderly people over 60 in the total population is only 19%. The growth rate will start to accelerate in 2035, and it will be 35% in 2050.
The predicted results of population aging rate of provinces in China in 2030 and 2050 are shown in Table 1.
Judging from the prediction results, the future development of China’s population aging has the following characteristics:
The elderly population is large and growing rapidly, the age structure of the population continues aging, and the proportion of elderly people in the elderly population continues increasing. This is consistent with the conclusion obtained by Lin [22] using the data of China’s seventh census. The trend of population aging has been increasing year by year, the growth rate has accelerated from 2015 to 2030, and the growth rate has declined between 2030 and 2050. The distribution of population aging in different regions is uneven. Economically developed regions such as Beijing, Tianjin, and Shanghai have a high degree of population aging, with a rapid growth rate. Due to the developed economy, the high consumption level, the heavy burden of raising children, and the low fertility willingness coupled with the improved medical and health conditions and the prolonged life expectancy of the elderly population, the degree of aging in economically developed areas is high; The three provinces of Liaoning, Jilin, and Heilongjiang have a large outflow of working-age people out of work, making the elderly population of the three provinces account for a larger proportion of the total population; Guangdong Province is a large manufacturing province with a large number of labor-intensive enterprises and attracts a large number of migrant workers. Therefore, the degree of aging in Guangdong Province is relatively low.
According to the internationally accepted division standards, when a country or region’s population aged 65 and over accounts for more than 7%, it means entering an aging society; Accounting for 14%, it is a deeply aging society. China is in the stage of transition from an aging society to a deeply aging society. With the large scale of the elderly population, the old-age dependency ratio is increasing, and the social pension burden is further aggravated. Relevant departments should formulate corresponding policies and measures as soon as possible to deal with the development of aging population, improve the medical service system for the elderly, increase the training of elderly care workers, and provide appropriate financial subsidies to the elderly care industry; Extend the retirement age and encourage re-employment of retirees; Formulate population policies, increase the birth rate, and adjust the population structure; Build a social environment of providing for the elderly, filial piety, and respect for the elderly to respond to the increasing trend of population aging.
It should be noted that it is difficult to predict the long-term population size of a country or region. The change of population size depends on many factors of the country’s social development in the future, which are uncertain. The trend prediction of population scale in this paper is only based on the currently available samples and analyzed according to the internal law of data. It is impossible to predict some factors affecting population scale, such as policy trend, natural disasters and so on. In the future, we will timely grasp the changes of independent variable data and update and calculate the data timely and accurately. It should be noted that the three-child policy implemented in China in 2021 may effectively alleviate China’s aging and reduce China’s aging rate [2].
Footnotes
Acknowledgments
This research was supported by the National Key R and D Program Project (No. 2017YFE0104600).