
Abstract
In order to improve the effect of urban and rural regional spatial planning and resource allocation, we need to focus on the factor of urban and rural population flow. Therefore, this paper evaluates the effect of urban and rural population mobility and spatial planning under the background of big data. Based on the evaluation of the effect of urban-rural population migration, according to the evaluation principle of the effect of urban-rural population migration after the reform and opening up, the evaluation index system is constructed, the dimensionless processing of the evaluation index system is carried out, the evaluation index weight is calculated, and the evaluation index is quantified, so as to complete the effect evaluation of spatial planning. Finally, taking Tianjin as an example, the application effect of this design method is verified.
Keywords
Introduction
Urban space is the regional space occupied by a city. It belongs to geographical concept rather than administrative concept, that is, urban construction and built-up area with relatively concentrated urban population. Urban spatial development is the spatial expansion of a city under the action of internal and external forces, including the expansion of urban plane area and the extension of three-dimensional air and underground. The forces that affect the development of urban space can come from political, economic, social and other factors, among which population migration is one of the basic reasons for the change of urban spatial structure. As an important social and economic phenomenon, population flow is the embodiment of human social interaction process and the inevitable result of industrialization and urbanization. The scale and spatial pattern of population flow directly affect the spatial planning and resource allocation of urban and rural areas [1]. Many scholars have studied this. For example, Zhong [2] studied the spatial transfer and planning response of urban-rural inversion of population aging in China from the perspective of population mobility, made a judgment on the urban-rural development trend of population aging based on the comprehensive analysis of the age characteristics, mobility characteristics and trend of floating population, and put forward some conclusions that the urban-rural inversion will continue in the future; Taking Yangzhou as an example, Zhu [3] derived the social, spatial and economic attributes of population mobility around the three core issues of new urbanization, such as “people, land and finance”, and constructed a conceptual model of population urbanization based on multi-source data fusion, so as to realize the research on the population urbanization model of city and county land spatial planning based on multi-source data fusion; Chen et al. [4] summarized the comprehensive influencing factors affecting residents’ well-being and well-being, and paid attention to the research on the optimal allocation of public service facilities, disaster risk assessment and resilient urban construction, three living space optimization, community life circle planning and fine management, big data and intelligent decision-making system in the practice of land and space planning, so as to realize the analysis of the relationship between urban population and spatial planning. Based on the above research, this paper analyzes the characteristics of urban-rural population mobility, and evaluates the effect of spatial planning under the background of big data. Through the analysis of 390 million information subjects and 4.88 billion credit records, this paper obtains the new characteristics of China’s labor transfer since the reform and opening up, and constructs an evaluation model to evaluate the effect of urban and rural spatial planning. It is hoped that this research can provide some references and suggestions for urban and rural construction.
The characteristics of urban and rural population flow under the background of big data
Since the reform and opening up in 1978, China has made great achievements: The economy has achieved sustained and rapid growth, the comprehensive national strength has been further enhanced, the people’s living standard has been significantly improved, and the overall level of well-off society has been reached. At the same time, the labor force, mainly young and middle-aged people, gradually began to migrate across provinces on a large scale out of yearning for a better life. In the process of migration, it is inevitable to have economic behaviors with financial institutions, such as applying for credit cards, buying houses with loans, paying provident fund and social security. According to the interface specification of personal credit investigation system, the recorded data of the above behaviors can be collected by the credit investigation center of the people’s Bank of China according to law, resulting in an extremely large amount of big data information [2]. The information records collected by the credit investigation center timely reflect the time and place of business development of the information subject, and have incomparable advantages compared with other data sources in determining the trajectory of population migration. Therefore, based on the collected big data information, this chapter evaluates the effect of urban and rural population mobility and spatial planning.
Migration data generation principle
According to the definition of population migration, identity information, initial location, immigration location, immigration time is selected as data items. In the statistical dimension, age, gender and region are selected as research dimensions. By processing personal identity data in credit reference database, the initial location, age and gender data can be obtained according to the rules of ID number generation. According to personal credit, social security, provident fund and other business data, we can obtain the residence information of individuals when the above business occurs. By comparing the business location with the initial location, we can judge whether the individual has migration behavior. For example, natural person A, whose initial residence is Shandong, had a housing loan business in 2005, and the place of business was Shanghai. According to this, it is considered that A’s residence in 2005 was Shanghai, and there was a migration from Shandong to Shanghai. The principle is shown in Fig. 1.
Data description
This study not only uses personal credit, personal social security, personal provident fund data for personal credit analysis, but also uses corporate credit code, corporate executives, corporate credit card data for corporate credit analysis. These data sources basically reflect the purchase location, work location or company location of natural person. This kind of location information also involves the change of permanent residential address, which is in line with the definition of population migration. The data source of this paper is shown in Table 1. This research involves nearly 5 billion business data, and needs to extract nearly 20 billion data fields. The data processing capacity is large, and the data preprocessing task is heavy. In terms of data sources, it involves credit, provident fund, social security, enterprise loans and other business data and different data types, showing the characteristics of diversity. According to the data collection regulations of the credit information center, at present, the database of the credit information center needs to receive nearly 100 million pieces of data from relevant institutions every day, with fast data update speed and large data increment. In terms of data quality, most of the data are collected from financial institutions and government agencies, with reliable data sources and relatively high data quality and accuracy. To sum up, the data used in this study presents the big data “4V” characteristic of large amount of data, many types of data sources, fast data update speed and high data accuracy.
Population migration data sources and data
Population migration data sources and data
Migration data generation principle.
From the collected credit big data, data items including natural person ID, gender, age, initial location, business location and business occurrence time are obtained. In order to more comprehensively reflect the migration process of each natural person, according to the principle of migration data generation, the migration path data of natural person is specially drawn. It includes the following data fields: natural person Id, gender, age, initial location and year (1978–2014). Among them, natural person ID is used to judge the data labels of natural persons. Gender, age and initial location are all judged by the rules of generating ID card numbers. It should be noted that the location of the natural person in the year is recorded in the year data section. For example, Hebei province was recorded in 1978, Beijing was recorded in 1979, and it was recorded until 2014 [5]. Through this processing method, the data of natural person’s location from 1978 to 2014 can be obtained, and the migration path can be drawn, which can completely reflect the whole migration process and trajectory of each natural person, and provide data support for the discovery of multiple migration and migration behavior of natural person.
Characteristics of urban and rural population flow
This study involves the credit data of 390 million natural persons in the credit information system, and 120 million people have been detected to have migration behavior, with a total of 190 million times of migration. From the perspective of the number of population migration over the years, the number of monitored annual migration has increased year by year since 2005, increased significantly in 2008, decreased in 2009, and then rebounded rapidly and increased year by year [6]. The ratio of male to female is about 6:4, the age structure is mainly young adults, and the “post-80s” become the main migration force. Among the migrants, 70 million are men and 50 million are women. The proportion of “post-80s” was the largest, accounting for 44.1%. The proportion of “post-60s”, “post-70s” and “post-90s” was 14.1%, 28.5% and 7.8% respectively. From the perspective of population migration, most provinces are in the state of net population outflow, and the provinces with net population inflow are mainly concentrated in the economically developed areas such as “Beijing, Shanghai and Guangzhou”. By the end of 2014, the provinces with the largest net population outflow were Henan, Hunan, Sichuan, Hubei and Anhui, as shown in Fig. 2.
The survey of population loss in different provinces.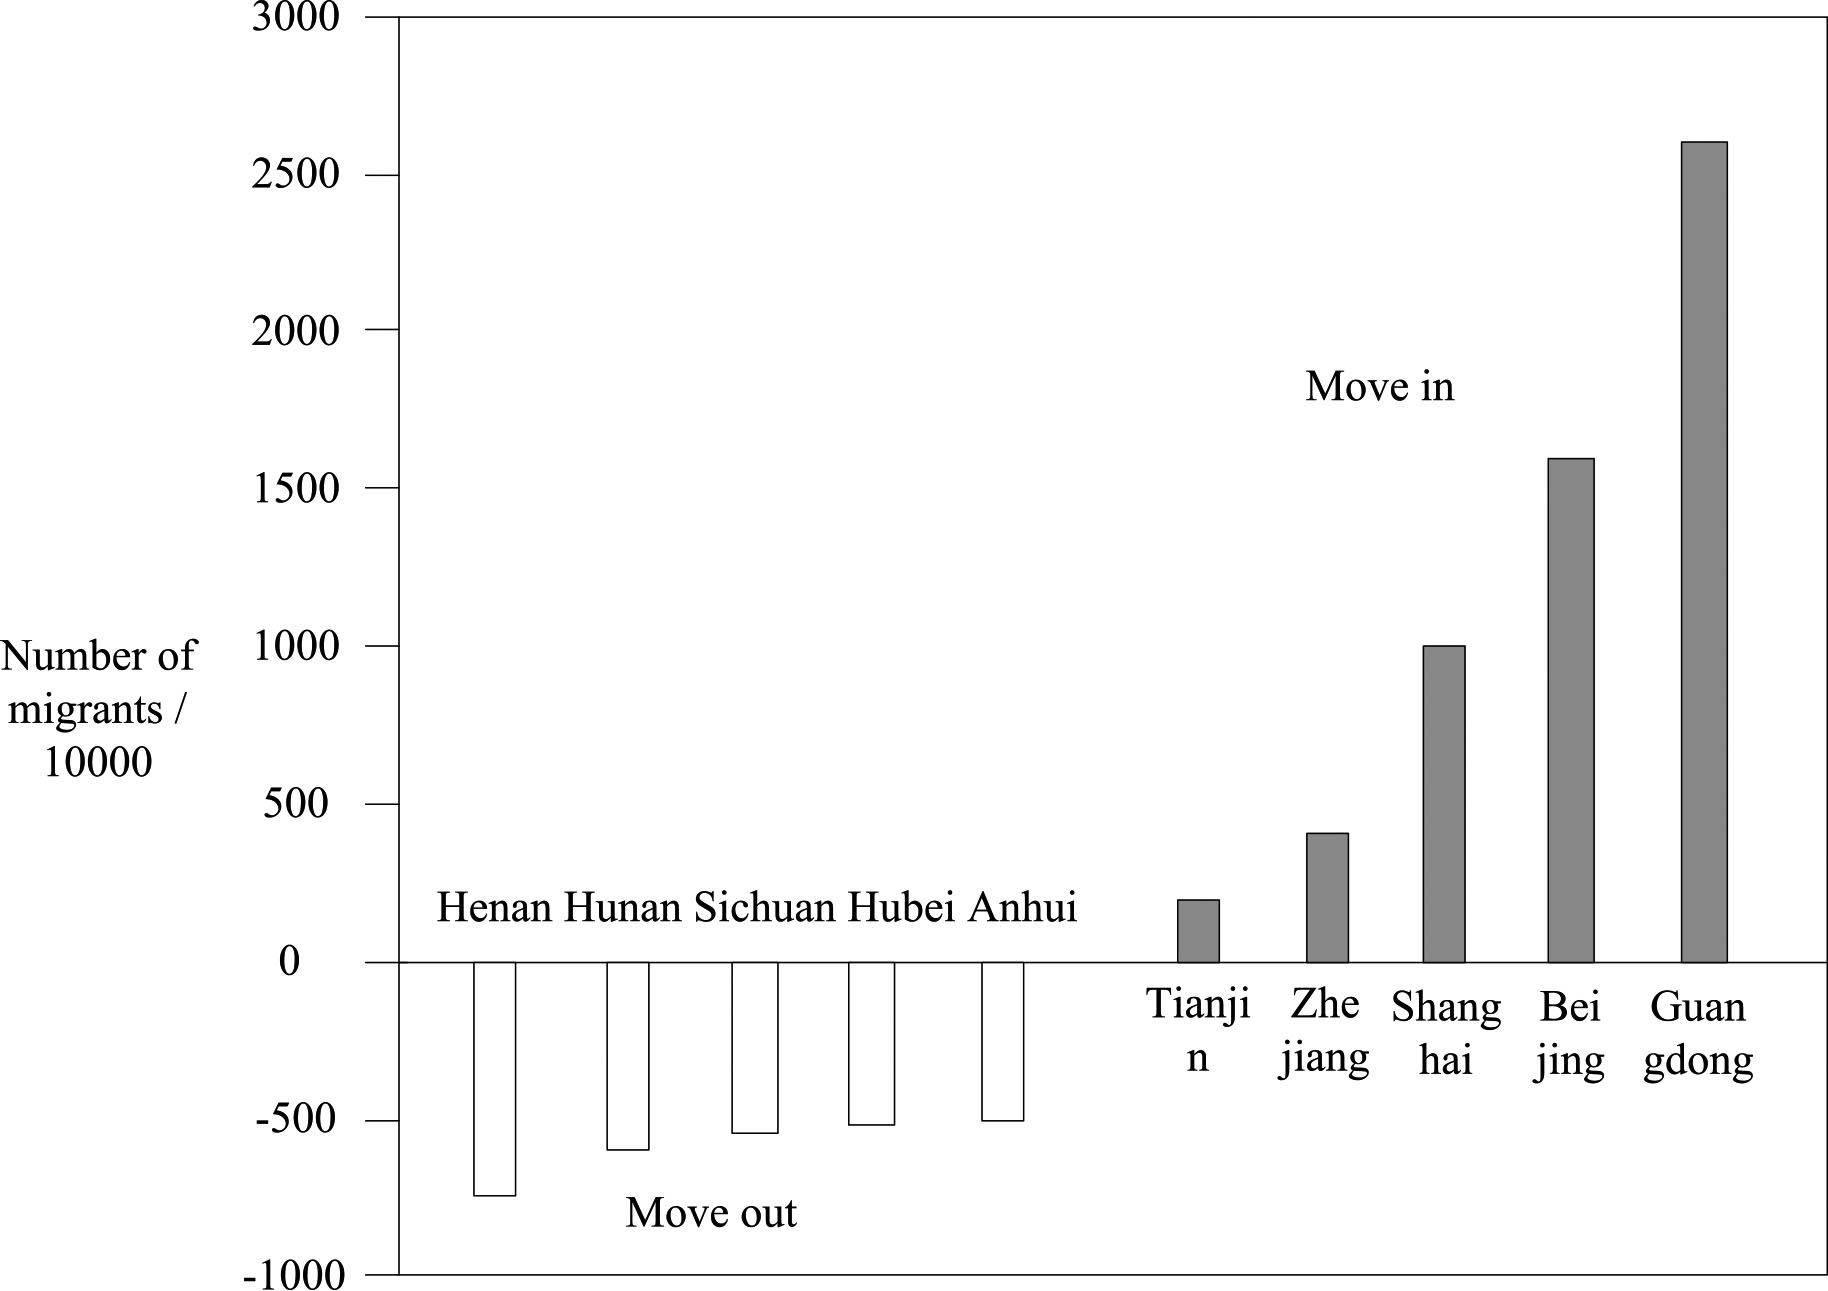
Before the concept of Urban and Rural Planning Law was formally put forward in the urban and rural planning law, there have been many attempts in many cities in China. The initial evaluation appeared in the form of “planning review”, represented by Review and Countermeasures of Shenzhen Urban Master Plan in 2002. Subsequently, some provinces and cities organized the implementation evaluation research of master plan, and the results included Basic Research on the Implementation Evaluation Guidelines of Zhejiang Urban Master Plan [7].
Promulgation and implementation of Urban and Rural Planning Law, the planning evaluation has become a part of the urban and rural planning system in China. After that, Shanghai completed Shanghai Master Plan Implementation Evaluation in 2009, which attempts to carry out a comprehensive mid-term evaluation on the implementation of Shanghai’s current urban master plan from seven aspects. Before revising the urban master plan, all localities have also carried out the evaluation work on the implementation of existing plans according to law. In order to implement Urban and Rural Planning Law and guide all localities to “do a good job in the evaluation of the implementation of urban master plan”, the Ministry of housing and urban rural development issued a notice on “printing and distributing Measures for the Evaluation of the Implementation of Urban Master Plan (provisional)” on April 16, 2009. This “method” has made a number of provisions on the organization, content and operation procedures of the implementation evaluation of the master plan; In the “method”, it is also proposed that “all localities may, in accordance with the requirements of CCC and this method, formulate evaluation methods or implementation rules that are in line with the local reality” [8]. Obviously, at this time point, the industry is still lack of mature experience in planning evaluation, and the national authorities “dare not” rashly introduce relevant administrative regulations and technical standards. It is found that there are not only differences in working framework, but also differences in understanding, organization and method of evaluation.
Based on the above research background, starting from the public policy attribute of master plan, this paper tries to build a dynamic implementation evaluation system of master plan, which covers the whole process of “preparation, approval, implementation, evaluation, supervision and modification”. First of all, literature analysis method is adopted to summarize the research results of urban planning implementation evaluation at home and abroad. After in-depth reading and thinking of the literature, the urban master planning implementation evaluation system is established, and the value orientation and content of urban master planning implementation evaluation are clarified, that is, the urban master planning implementation evaluation should adhere to the principles of objectivity, impartiality, seeking truth from facts and planning intention orientation. Secondly, the paper focuses on the evaluation method of the implementation of urban master plan, and constructs a set of evaluation system, including 2 evaluation categories, 4 evaluation levels and 12 evaluation levels In this paper, the weight of each index is allocated by analytic hierarchy process (AHP) and expert consultation method, and the implementation deviation calculation method, implementation percentage method and hierarchical evaluation method are determined as the quantitative methods of evaluation index. Thirdly, taking Tianjin urban area as the object of empirical study, the paper uses the above-mentioned urban master planning model Based on the evaluation index system, the implementation score of Tianjin urban master plan is obtained. According to the grading evaluation principle of urban master plan implementation, Tianjin urban master plan situation is obtained [9].
Construction of evaluation index system
The evaluation index system of urban and rural master plan implementation includes four dimensions: evaluation classification, evaluation level, evaluation elements and evaluation index. The evaluation is divided into two categories, namely, the evaluation of the implementation results of the urban and rural master plan and the evaluation of the implementation process of the urban and rural master plan. The evaluation is divided into four levels, namely, the implementation of urban and rural overall planning objectives, the implementation of spatial organization and layout, the implementation of planning policies and the implementation of special policies [10]. The evaluation includes 12 evaluation elements, namely urban and rural scale index, economic index, social and humanistic index, ecological environment index, spatial form, implementation of functional land, implementation of major projects, preparation of subordinate planning, planning decision-making mechanism, local planning laws and regulations, spatial guidance policy and non spatial guidance policy. A total of 55 evaluation indicators are selected, as shown in Table 2.
Evaluation index system
Evaluation index system
The dimensionless treatment of comprehensive evaluation indexes generally adopts extreme value method, standard deviation method, efficacy coefficient method, etc. In this paper, the extremum method is selected for dimensionless processing [11]. Because the indexes selected in this paper are all positive indexes, a unified formula is used for data processing:
In Eq. (1),
The weight of the index system constructed in this paper is determined by the combination of qualitative and quantitative methods. The quantitative method is mainly analytic hierarchy process (AHP); The qualitative method is expert consultation. The specific steps to determine the weight are as follows: Firstly, the weight of each index is calculated by using the analytic hierarchy process; Secondly, the calculation results are modified by the expert consultation method [13].
Analytical Hierarchy Process was proposed by Professor T.L. Saaty of University of Pittsburgh. It transforms the overall judgment of the weight of each index into the judgment matrix of pairwise comparison of these indexes, and finally tests the consistency of the results. This method is a combination of subjective judgment and mathematical calculation to determine the weight, which has a certain scientific nature [14]. The specific process of calculating index weight by AHP is as follows:
Scale reference table
Scale reference table
Judgment matrix
In Table 4, bij indicates the relative importance of the horizontal index Di over the vertical index Dj. The larger the ratio is, the more important Di is than Dj.
Calculating the product
Calculating the geometric mean of each row
Normalizing the vector
In Eq. (4),
The consistency index CI was calculated:
In Eq. (5),
Finally, the random consistency index RI is calculated.
There are three methods to quantify the evaluation index, which are index deviation calculation method, implementation completion percentage method and hierarchical evaluation method.
The calculation method of index deviation takes the deviation value between the planning goal and the implementation result as the scoring standard of each index. In order to make the scoring results more objective, this study established the index deviation standard for urban planning objectives and the implementation of functional land [17]. The implementation completion percentage method is mainly used in major project implementation indicators and lower planning indicators. The hierarchical evaluation method mainly aims at the indicators that are difficult to quantify, including the establishment of planning decision-making mechanism, the promulgation of local planning regulations and the formulation of special policies [18].
Implement the final score calculation The final score of the implementation evaluation is the sum of the product of the weight of each index and the score:
In Eq. (7), Judgment of evaluation results The evaluation results of urban master plan implementation are divided into five grades: excellent, good, average, poor and very poor. The final score of implementation evaluation corresponding to each level is shown in Table 5 [20].
Total score evaluation table
Calculation results of index weight
Overview of planning area
At present, the master plan of Tianjin, version 06, namely Master Plan of Tianjin (2005–2020) is the general plan being implemented in Tianjin. The plan was compiled in June 2004, submitted to the State Council in December 2005, and officially approved by the State Council in July 2006. According to the planning content, the urban nature of Tianjin is “Tianjin is the economic center of the Bohai Rim region, and it should be gradually built into an international port city, northern economic center and ecological city”; In terms of population scale, the permanent resident population of Tianjin will reach 13.5 million in 2020, the urban population will reach 12.1 million, and the urban construction land will be controlled within 1450 square kilometers In the aspect of urban structure, it is necessary to construct the spatial layout of “one axis, two belts and three districts”; In the aspect of urban system, it is necessary to form a four level urban system of “main and sub centers of the city – New City – central town – General built town”; In the aspect of central urban layout, it is necessary to continue to deepen and improve the layout structure of “one shoulder carries two ends” determined in the 86 edition of the general plan, with the central urban area and the core area of Binhai New Area as the planning objects. The main center and the sub center should build a group layout structure around the main and sub centers, and use the natural ecological conditions such as rivers and wetlands between the urban area and the group to form a network green space system and open space.
Index weight calculation
The calculation results of evaluation index weight are shown in Table 6.
Quantitative results of indicators
The quantitative results of evaluation indexes are shown in Table 7.
Quantitative results of indicators
Quantitative results of indicators
According to Tables 6 and 7, the final score of implementation evaluation is 53.44 according to Section 3.5. Because the score is between 60% and 45%, according to the principle of grading evaluation, the implementation of Tianjin urban and rural master plan is poor. Because the content of physical space planning still occupies a dominant position in the current urban master plan, and the content of social economy is only a small part of the urban and rural master plan, this study allocates more points to the urban and rural spatial organization and layout. However, the implementation score of this evaluation level is only 5.80, accounting for only 14.50% of the full score of urban and rural spatial organization and layout. It is precisely because the actual urban and rural development and construction goes against the intention of the original urban and rural master plan that leads to the evaluation conclusion of poor implementation of the urban and rural master plan. Compared with the content of spatial level, the social and economic development goals of the original urban-rural master plan have been better achieved. Generally speaking, the urban and rural master plan has no obvious control and guidance effect on the urban and rural development of Tianjin.
Conclusion
With the acceleration of urbanization, population migration activities become more and more frequent, urban and rural space needs to be re planned and arranged to meet the needs. Therefore, this paper studies the effect evaluation of urban and rural population flow and spatial planning under the background of big data. This study is divided into two parts, first analyzes the characteristics of urban and rural population flow, and then uses the analytic hierarchy process to evaluate the effect of spatial planning. Finally, through example verification, it can be found that it is precisely because the actual situation of urban and rural development and construction violates the original intention of the original urban and rural master plan that leads to the evaluation conclusion of poor implementation effect of urban and rural master plan. Compared with the content of spatial level, the socio-economic development goal of the original urban and rural master plan has been better realized. Therefore, on the whole, the urban and rural master plan has no obvious control and guidance effect on the urban and rural development of Tianjin. Moreover, it can be seen that through the analysis of big data, this paper can successfully evaluate the effect of urban and rural population mobility and spatial planning, which is effective and can provide a certain reference for urban and rural planning. However, in order to improve the effectiveness of the evaluation, more data need to be analyzed in the future.