
Abstract
In order to effectively guarantee the effect of credit risk prediction of science and technology finance and improve the ability of risk prediction, a credit risk prediction algorithm of science and technology finance based on cloud computing is proposed. The logistic regression model is used to predict, and the financial indicators of science and technology credit are selected as the model covariates. According to the characteristics and strong correlation of many financial indicators of science and technology credit, this paper constructs the final index system of online supply chain technology credit risk evaluation based on SMEs. Then the principal component analysis method is used to select the principal component. Combined with the penalty method, the data space dimension of financial indicators is further reduced, and the unrelated principal components are obtained. On this basis, a logistic regression model is established to predict the credit risk by taking the selected main components as covariates. The experimental results show that the algorithm has a good fit to the credit risk of 16 science and technology credit enterprises, and the risk prediction ability is significantly improved, which can effectively guarantee the effect of science and technology credit risk prediction.
Introduction
Credit risk is the main risk faced by the modern economic system. With the development of the financial market, new financial instruments continue to emerge, and the scale of financial derivatives transactions continues to expand. These credit derivatives rapidly expanded the scope and scale of credit risk [1]. How to improve the credit risk prediction capability of technology finance is already a hot issue, and data is a key factor for effective and accurate risk measurement. Especially with the development of information technology and the Internet, financial risk management is increasingly dependent on massive amounts of data [2]. Big data refers to massive and complex data sets that cannot be extracted, stored, searched, shared, analyzed, and processed by existing software tools, and credit risk is analyzed using a large amount of non-financial data modeling and analysis [3, 4]. Assess the credit risk of science and technology finance in related fields, through the consistent quantification of the credit risk indicators of technology-based small and micro enterprises and the construction of a fuzzy measurement matrix, the weight of each measurement indicator of credit risk is obtained, and the comprehensive impact matrix analysis of credit risk, initial value defuzzification.
In order to solve the above problems, the technology credit risk prediction algorithm based on cloud computing has been researched and optimized. Use logistic regression model combined with punishment method and principal component analysis method to predict the country’s science and technology credit risk. Before constructing the index system, we need to understand the basic principles of construction, and conduct secondary screening based on the principles of comprehensiveness, scientificity and operability. To build the final indicator system of online supply chain technology credit risk evaluation based on small and medium-sized enterprises, through 7 Chinese science and technology credit building models, introducing ordinary linear models, and on this basis, extending to punishment methods and logistic regression models to construct punishment logic models. Preprocess the data to ensure that the dimensions of the indicators are uniform. The factor analysis is carried out to eliminate the collinearity between the indicators, so as to effectively ensure the effect of science and technology credit risk prediction, improve the prediction accuracy, and realize the research of cloud computing-based science and technology financial credit risk prediction algorithm.
Credit risk prediction algorithm of science and technology finance
Collection of credit risk characteristic index of science and technology finance
Credit risk is the oldest kind of risk in the financial market, which refers to the possibility of losses caused by the default of borrowers or market counterparties. There are various views on the definition of credit risk in the field of finance. The traditional credit risk mainly comes from the loan business [5]. However, due to the poor liquidity of loans and the lack of an active secondary market, the value of loan assets is mainly measured by historical cost rather than market price. Credit risk includes two aspects: On the one hand, it refers to the possibility that the debtor is unwilling or unable to perform the contract on time when the contract is due in financial transactions, that is the risk of breach of contract; On the other hand, it refers to the risk that the debtor’s credit condition becomes worse, that is the risk of credit spread, this paper focuses on the default risk [6]. The measurement of credit risk from the initial qualitative point of view of the measurement method developed to quantitative analysis of the measurement model, through the enterprise’s relevant data to quantitative analysis of its credit risk, the conclusion is more objective and reasonable. China’s science and technology credit data generally does not meet the normal distribution, there are many data indicators, and there is multicollinearity among the indicators [7]. In view of these characteristics, this paper uses logistic regression model combined with penalty method and principal component analysis method to predict China’s science and technology credit risk [8]. For the measurement of credit risk, expert system is used at first. The financing mode of accounts receivable is to pledge the accounts receivable that are not yet due to the financial institution, so as to obtain financial support from the financial institution, the collection mode of technology credit risk is as Fig. 1.
The basic methods of risk control include risk avoidance, risk transfer, risk retention, risk compensation, loss control, risk shielding, etc. The credit rating of small and medium-sized enterprises is generally low, but after using the self compensating technology in the credit mode, the impact of the low credit level of small and medium-sized enterprises on the credit security is effectively isolated and blocked, thus the credit risk can be greatly reduced. In addition, according to the content of credit risk management, we should choose core enterprises and logistics enterprises with good credit standing and perfect online platform construction to help ourselves reduce the cost of credit risk control as much as possible [9]. From the perspective of financing enterprises, confirmed warehouse financing mode helps them complete leveraged procurement and batch sales of suppliers, realizing convenient financing; From the perspective of financing enterprises, confirmed warehouse financing not only excavates potential customers, but also can take acceptance bill as joint liability guarantee and real right guarantee of suppliers, greatly reducing the credit risk of business [10]. Nowadays, the financial market is becoming more and more diversified, which obviously can not meet the needs of risk management. Monetary supervision institutions have developed a rating system method, which is mainly used to assess the adequacy of loan loss reserve. According to the rating system method, loans are divided into two grades: low-quality grade and high-quality grade [11]. There are five categories: special attention, substandard, suspicious, loss and qualified. The two grades include four and one categories of loans respectively. The loan loss reserve requirements for each category are as Table 1.
Loan loss reserve requirements for each category
Loan loss reserve requirements for each category
Collection mode of science and technology credit risk.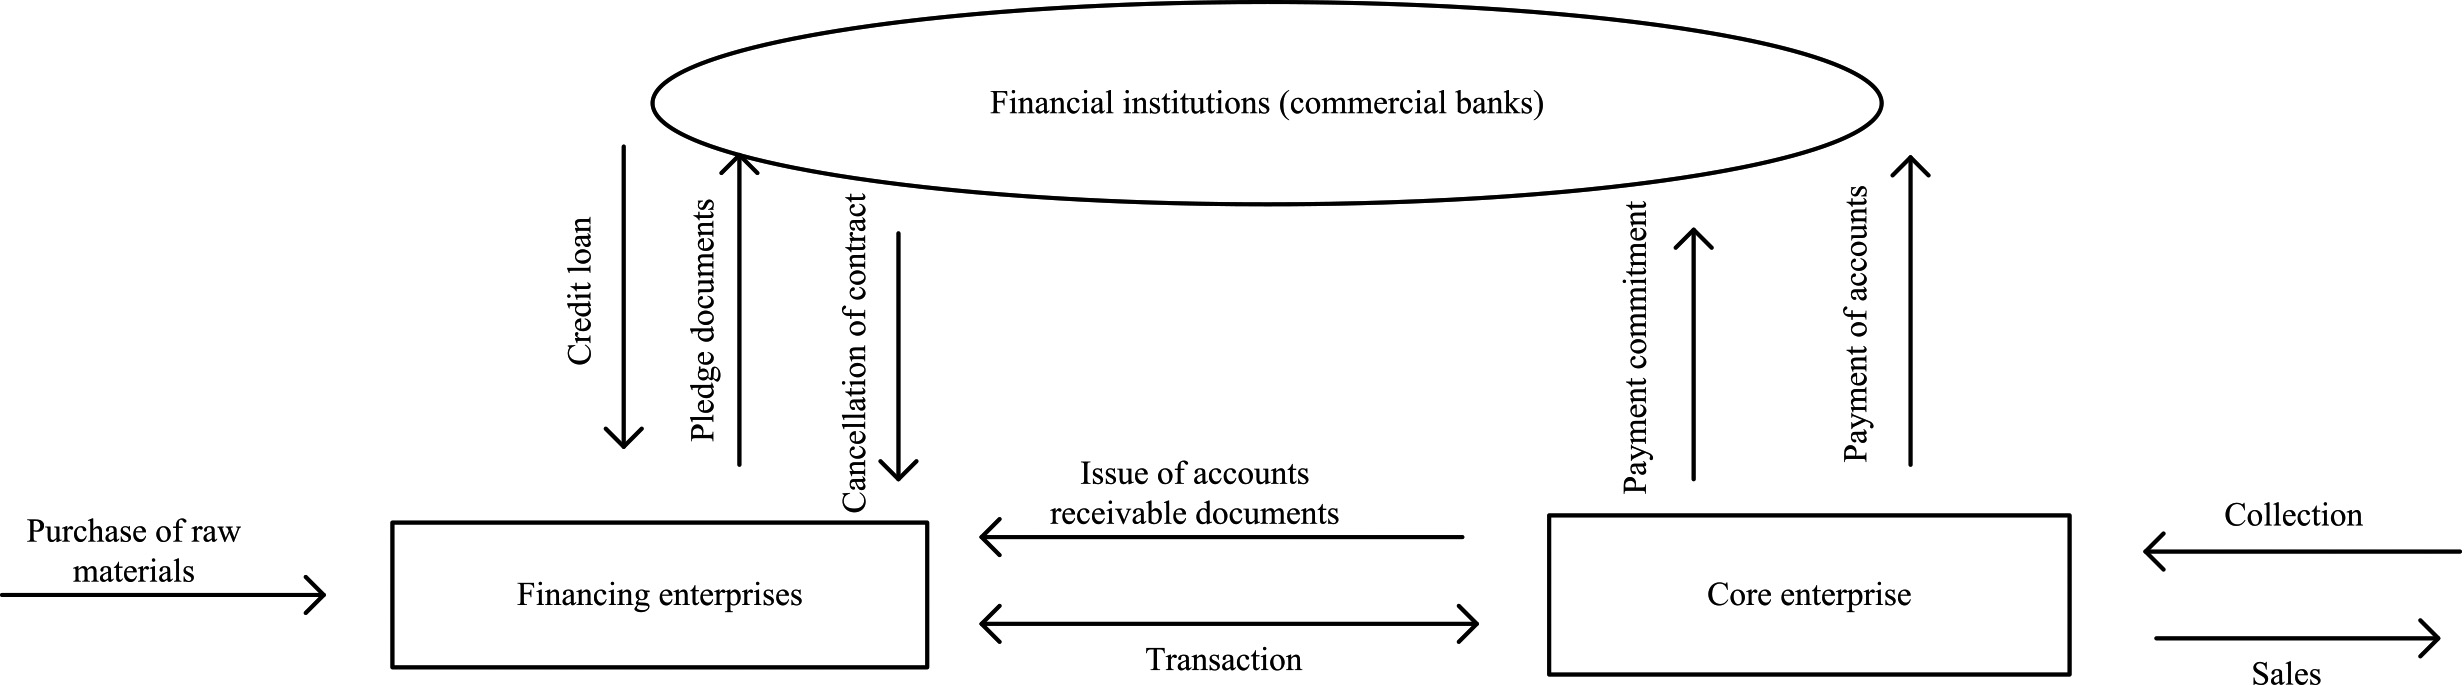
Table 1 shows that the low-quality levels are divided into special attention, not up to standard, suspicious, and loss. The loan loss reserve requirements are 0%, 20%, 50%, and 100% respectively. The high-quality level is qualified. The loan loss reserve requirement is 0%. The rating system method directly makes a simple qualitative analysis of the financial and operating data of enterprises, which has limitations. Although the corresponding analysis of financial indicators, but there is no clear index risk of different weights, there is no establishment of different weights of multivariate index evaluation system [12]. From the index variables selected by the credit risk measurement model. In modern sense, credit risk includes the risk of assets loss caused by the direct default of the counterparties and the change of the possibility of default of the counterparties. Because the credit portfolio will not only suffer losses due to the direct default of the counterparties (including loan borrowers, bond issuers, etc.), but also lead to changes in the market value of the portfolio assets when the counterparties do not default but the credit status changes (such as credit rating reduction, profitability decline, etc.), which may give the creditors (portfolio assets holding). The small probability event of enterprise default and the asymmetry of loan income and loss lead to the deviation of probability distribution of credit risk [13]. The fluctuation of market price is centered on its expectation and mainly concentrates on the two sides of the market. Generally speaking, the return distribution of market risk is relatively symmetrical, which can be roughly described by the normal distribution curve [14]. In contrast, the distribution of credit risk is asymmetric, but biased. One end of the income distribution curve inclines downward to the left, and a fat tail appears on the left, the probability distribution of credit risk is as Fig. 2.
Probability distribution of credit risk.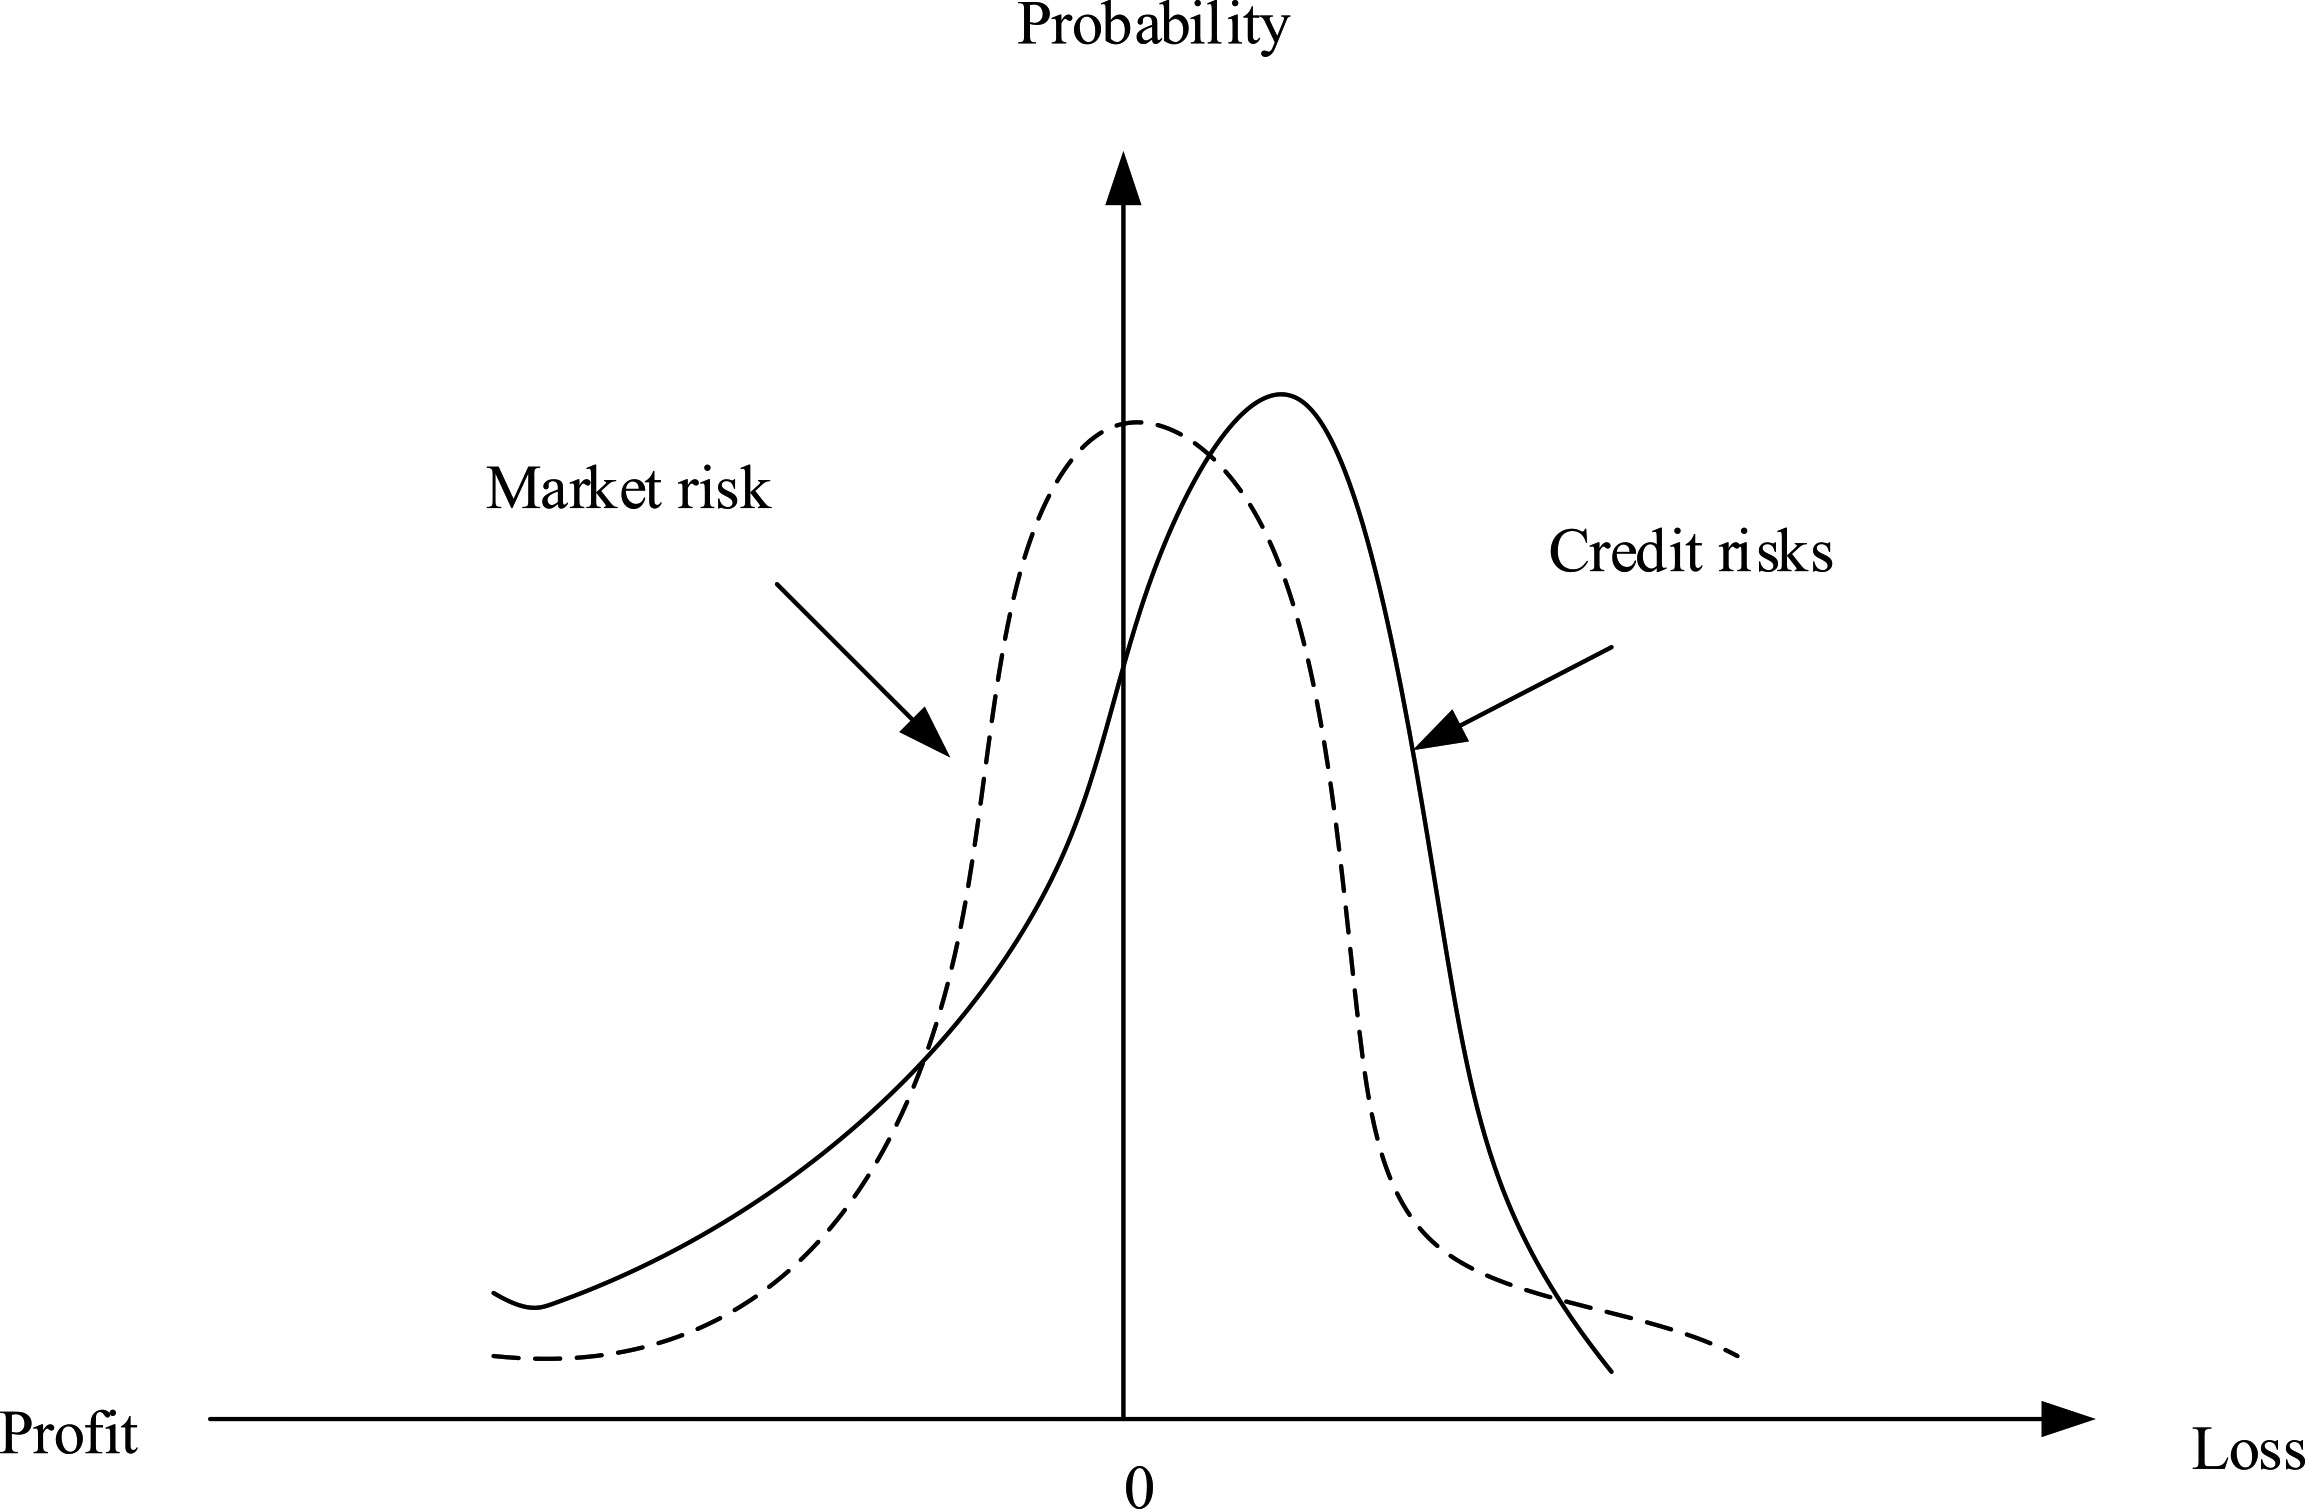
As for the credit risk of science and technology, this paper studies the risk of default, and takes the “financial distress” of science and technology credit as the sign of “default”. Based on the existing literature, whether a company is in financial distress is generally judged by “special treatment company/normal company” and measured by financial data [15]. Credit risk prediction index system is the basis for enterprises to evaluate credit risk. Before constructing the index system, we need to understand the basic principles of construction, as follows:
The content of the index system should comprehensively reflect all the factors that affect the credit status of the forecast object, not only consider the existing performance, but also predict the future development trend, not only study the forecast object itself, but also consider the surrounding environment and its impact.
When constructing the index system, it is necessary to ensure the comparability of the selected indexes in a wide range, and turn the overall situation of the enterprise which is not comparable and quantifiable into the index data which can be calculated and compared [16].
At present, the construction of index system mostly uses quantitative financial index data, but there are still some that can not be obtained through statistics, such as the quality of leaders, market competitiveness and so on, which can only be judged qualitatively.
The selection of indicators should be objective or real, and the data must be as accurate as possible, and easy to understand and standardize, so as to ensure the effectiveness of the whole forecast.
It is necessary to comprehensively consider the degree of information reflection and the cost of sample data collection, and understand the evaluation indicators of scientific and technological credit risk prediction to ensure easy access to data and economic feasibility.
With the deepening of the research on credit risk, the definition of credit risk has changed accordingly. Credit risk refers to the risk of loss caused by the debtor’s default or the change of the debtor’s credit rating or performance ability [17]. For business, this risk mainly comes from the possibility of the borrower’s default or credit deterioration, which makes the creditor suffer losses. Generally speaking, credit risk is credit risk, which can be regarded as a kind of default risk, that is the possibility that the debtor is unable to repay or unwilling to perform the debt service agreement, resulting in the loss of creditors. Another view is that credit risk can be divided into broad sense and narrow sense [18]. The narrow sense of credit risk is consistent with the traditional point of view, while the broad sense of credit risk refers to all the risks caused by the default of customers, including the deterioration of asset quality caused by the borrower’s failure to repay the principal and interest on time in the asset business, the formation of crowding by the depositors in the liability business, the aggravation of payment difficulties, and the default of the counterparties in the off balance sheet business debt [19]. The third point of view is that credit risk refers to the possibility of loss caused by the default of the borrower or the market counterparties, including the possibility of loss caused by the change of the market value of the debt caused by the change of the borrower’s credit rating and performance ability. In the context of supply chain finance, business began to gradually weaken the assessment of financial indicators of small and medium-sized financing enterprises, but pay more attention to the overall supply chain, core enterprises and logistics service providers. According to the above scoring results and expert opinions, the index selection after the second screening is in line with the principles of comprehensiveness, scientificity and operability [20]. The final index system of technology credit risk evaluation of online supply chain based on small and medium-sized enterprises is constructed, which is composed of 4 first level indicators, 17 second level indicators and 24 third level indicators. The evaluation index system of science and technology credit risk is as Table 2.
Evaluation index system of science and technology credit risk
Evaluation index system of science and technology credit risk
Different financial indicators in scientific and technological credit financial data reflect the financial situation of enterprises from different aspects. Most domestic research on credit risk prediction use few financial indicators, which are based on previous scholars’ research and select the same financial indicators. Too few financial indicators can not reflect the financial situation of the company comprehensively [21]. In addition, considering the availability of data Combining with the previous research of domestic and foreign scholars, this paper selects as many financial indicators as possible to build the model from seven aspects of China’s science and Technology Credit: per share index, capital structure, cash flow, solvency, operating ability, profitability and risk prevention ability. Among them, solvency refers to the ability of an enterprise to repay its debt when it matures. Solvency is the basic premise to ensure the survival and sustainable development of an enterprise, and is an important analysis index of enterprise credit. Solvency reflects the financial status and operation ability of an enterprise. The stronger the solvency, the better the financial status and operation ability of an enterprise. There are many financial indicators used to explain the solvency of an enterprise. Generally, the indicators used to reflect the solvency are: current ratio, express ratio, cash ratio, property right ratio, interest protection ratio, net asset liability ratio, etc. The following six indicators are selected to measure the solvency. The indicators of solvency of science and technology enterprises are as Table 3.
Indicators of solvency of science and technology enterprises
From Table 3, it can be seen that solvency can be divided into current ratio, express ratio, cash ratio, equity ratio, interest cover, net asset liability ratio. They are represented as current ratio assets/current liabilities, (current assets, inventory)/current liabilities, (monetary capital
Profitability index of science and technology enterprises
Operational capability refers to the operational capability of an enterprise. Operation ability includes the ability to manage the capital of an enterprise. The strength of operation ability depends on the speed of capital circulation. The faster the capital circulation speed of small and medium-sized enterprises is, the higher the efficiency of asset utilization is, the more profits the enterprises will get in a certain period of time, and the stronger their operation ability will be. Generally, the indicators reflecting the operating capacity include: inventory turnover rate, accounts receivable turnover rate, total assets turnover rate, current assets turnover rate, accounts payable turnover rate, etc. The following six indicators are selected to reflect the operating capacity. The index of operation ability of science and technology enterprises is as Table 5.
Index of operation ability of science and technology enterprises
Risk defense capability is the growth capability of small and medium-sized enterprises in the development process. Compared with large enterprises, small and medium-sized enterprises have smaller asset scale and lower anti risk ability. Risk defense ability is the core index of credit risk of small and medium-sized enterprises. This index is related to the future of the enterprise, and can reflect the future development speed and future value of the enterprise. Therefore, the analysis of risk prevention ability should be added to the index system. Generally, the indicators reflecting the enterprise’s risk defense capability include: growth rate of operating revenue, growth rate of operating profit, growth rate of net assets, growth rate of total assets, growth rate of net profit, etc. The following six indicators are selected to measure the risk defense capability. The index of risk defense capability of science and technology enterprises is as Table 6.
Index of risk defense capability of science and technology enterprises
The ability to obtain cash mainly refers to the ability to obtain cash from current operating activities. Having enough cash flow is the base for SMEs to repay their debts, because cash flow is the direct source of debt repayment. The ability to obtain cash is also a powerful guarantee for the future development of small and medium-sized enterprises and an important factor in the analysis of enterprise credit. Therefore, the analysis of the ability to obtain cash should be added to the index system. The indicators usually used to reflect an enterprise’s ability to obtain cash include: the proportion of net cash flow from operating activities, net cash content of operating income, net cash content of net profit, etc. The following two indicators are to be used to reflect the enterprise’s ability to obtain cash. The indicators of the ability of science and technology enterprises to obtain cash are as Table 7.
Index of the ability of science and technology enterprises to obtain cash
To sum up, the financial indicators in the credit risk prediction index system are shown as Table 8.
Financial indicators in the credit risk prediction index system
Compared with the discriminant analysis method, the regression analysis method has relatively loose requirements on the data distribution of personal credit evaluation indicators, and the regression analysis method can get the probability of default in the personal credit risk assessment, while the discriminant analysis method has requirements on the data distribution of personal credit evaluation indicators. Among them, the logical regression method is suitable for the problem that the explanatory variables are qualitative indicators. The classification effect of personal credit risk assessment is better than that of discriminant analysis, and regression is one of the most widely used models in the field of personal credit risk assessment.
By improving the regression model, complete the budget of technology credit risk.
Different financial indicators in the financial data of science and technology credit reflect the financial status of enterprises from different aspects. In order to study the credit risk of enterprises comprehensively through the financial data system, 106 financial indicators are selected as variables from seven aspects of profitability, solvency, risk defense, cash flow, capital structure, operating capacity and per share indicators of building a model.
Profitability is the ability of an enterprise to obtain profits. Profit is the capital source for investors to obtain investment income and creditors to collect principal and interest. It is an important index to measure the long-term development ability of enterprises.
Solvency index refers to the ability of an enterprise to repay its long-term debt and short-term debt with its assets; dynamically speaking, it refers to the ability to repay its debt with its assets and the income created by the operation process.
The index of risk defense capability is a longitudinal analysis of the various indexes of an enterprise compared with those in previous years. Through the analysis of the index of risk defense capability, we can roughly judge the change trend of an enterprise, so as to make an accurate prediction of the future development of the enterprise.
Cash flow indicators reflect cash flow information. The financial indicators calculated according to the accrual basis principle of the current accounting system can not fully reflect the real financial and profit situation of science and technology credit, and the indicators expressed by cash flow can complement each other.
Capital structure refers to the value composition and proportional relationship of various kinds of capital in an enterprise, and it is the result of financing combination in a certain period of time.
Operation ability refers to the operation ability of an enterprise, that is the ability of an enterprise to make profits by using various assets.
The per share index refers to the relevant financial index of the enterprise, reflecting the financial situation of each share. Calculate the value and volatility of the company’s assets:
Among them:
where
To deal with the credit risk indicators of technology-based small and micro enterprises in a consistent and non-quantified manner, construct a fuzzy measurement matrix to obtain the weight of each measurement indicator of credit risk, analyze the comprehensive influence matrix of credit risk, and defuzzify the initial value. Calculate the probability of the error rate of each base learner under the distribution of its prediction error, namely:
The RUSBoost algorithm will finally output a weighted linear combination of T base learners:
Only the asset value
Regression model, penalty method and principal component analysis method are based on the ordinary linear model to do the corresponding extension, so this chapter first introduces the ordinary linear model. On this basis extends to the penalty method and logistic regression model, the combination of the two is the penalty logistic model, and finally introduces the principal component analysis method. General linear model:
The dependent variable
If the dependent variable,
Let
If the error term is logistic distribution, we can get the following results:
According to the index system, 29 financial indicators and 10 non-financial indicators are selected. According to the ST system of our country, using the data of t-1 year to predict the financial situation of enterprises in t year will obviously exaggerate the prediction ability of the model. At the same time, in order to take into account the influence of the situation of enterprises before t-1 year on the current credit risk of enterprises, the financial data of t-2, t-3 and t-4 years are used to predict the credit risk of enterprises in t year, so the final financial sample is obtained The index part is a matrix of 29
To standardize the index data, that is to convert the original value of the index into the standardized data between F, and to standardize the index can eliminate the influence of the index dimension. The standardization methods of positive indicators are as follows:
For negative indicators, the larger the value is, the worse the enterprise credit is, such as “asset liability ratio” and other indicators. The standardized values of negative indicators are as follows:
Considering the problem of sample data size, and the initial index system has too many input indexes, it will not only waste computing resources, reduce the operation efficiency, but also reduce the training effect of multicollinearity between indexes. Therefore, the financial indexes are screened twice, and then combined with the processed non-financial indexes as the model input. The process of screening and forecasting technical credit risk indicators is in Fig. 3.
As shown in Fig. 3, due to the non-uniform dimension of indicators and the lack of data, we need to preprocess the data first. Significance test of indicators: in the case of normal distribution of data, independent sample
In order to verify the practical application effect of the technology credit risk prediction algorithm, the experimental detection is carried out. The experimental data is mainly integrated, preprocessed and feature extracted on the big data financial cloud platform. Using python programming language to achieve the relevant classification algorithm. The following will introduce the whole process of the experiment and the experimental results of the improved xgboost algorithm. In this paper, 106 financial indicators of 63 science and technology credit companies in China are selected as research samples. Firstly, the financial indicators with strong correlation with other financial indicators are eliminated. Then, based on the conclusion of Chapter 5, the elasticnet method is selected to screen the financial indicators. The screened financial indicators are used as new model variables, and the principal components are extracted by principal component analysis. The components are used as covariates to construct logistic regression model, then the parameters are estimated and the model is tested. Finally, the prediction effect of the model on China’s science and technology credit risk is evaluated by confusion matrix and ROC curve. For the binary classification problem of imbalanced data sets, the confusion matrix is usually obtained. The risk index confusion matrix is as Table 9.
Risk index confusion matrix
Risk index confusion matrix
Process of screening and forecasting technology credit risk indicators.
According to the confusion matrix, the accuracy of classification can be obtained by the following formula:
The development environment mainly includes the development platform and the development framework. In the development platform, pycharm is selected to build the convolution neural network model of Python version. The deep learning framework adopted is tensorflow, which is currently the most active deep learning framework developed by Google. It uses data flow graph to calculate, where nodes represent mathematical operations and lines represent the interaction between tensors. At present, tensorflow can be deployed on one or more CPUs, GPUs, or mobile devices. The configuration of the development platform is as Table 10.
Development platform configuration
The five main components are used as covariates to construct the logistic regression model. The ROC curve of the prediction results of the model is as Fig. 4.
ROC curve of model prediction results.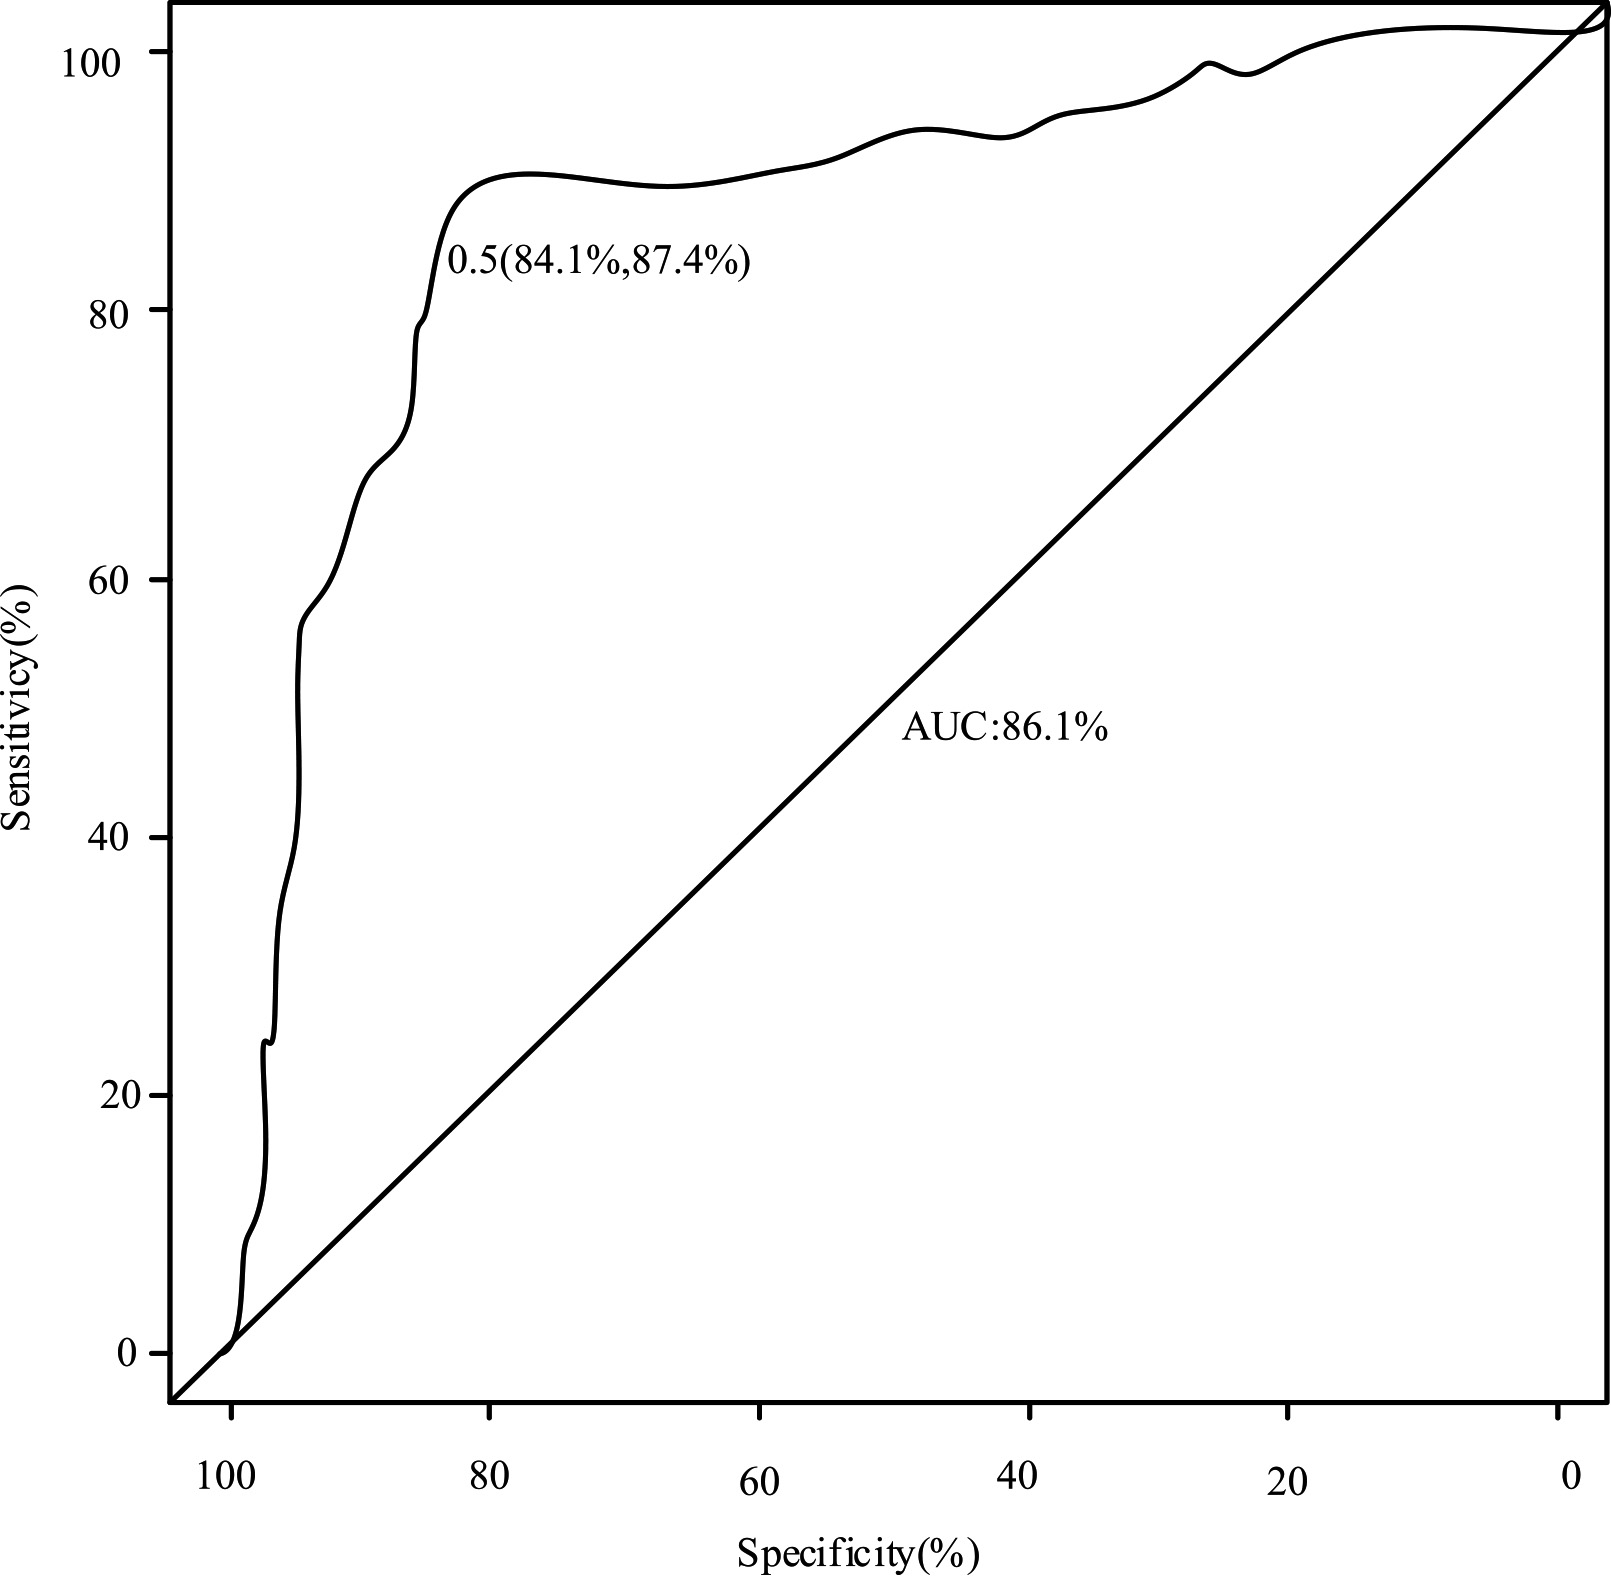
The final logistic regression model can be seen from Fig. 4. The regression model has a good fitting degree to the credit risk of 16 science and technology credit companies, and the prediction effect is better. Its AUC value reaches 86.1%, which is a good state.
In order to improve its robustness, when using xgboost algorithm for pre training, the experiment carried out 30 cycles to get the feature importance score in the dataset and sort them. Then, the individual classifiers, including xgboost, Ann and LR, and the benchmark model for comparative analysis are iterated for 36 times, and the prediction results of these experiments are averaged to reduce the impact of separate partition. Get the class distribution of training data and test data as Figs 5 and 6.
Class distribution ratio of training data.
Class distribution ratio of test data.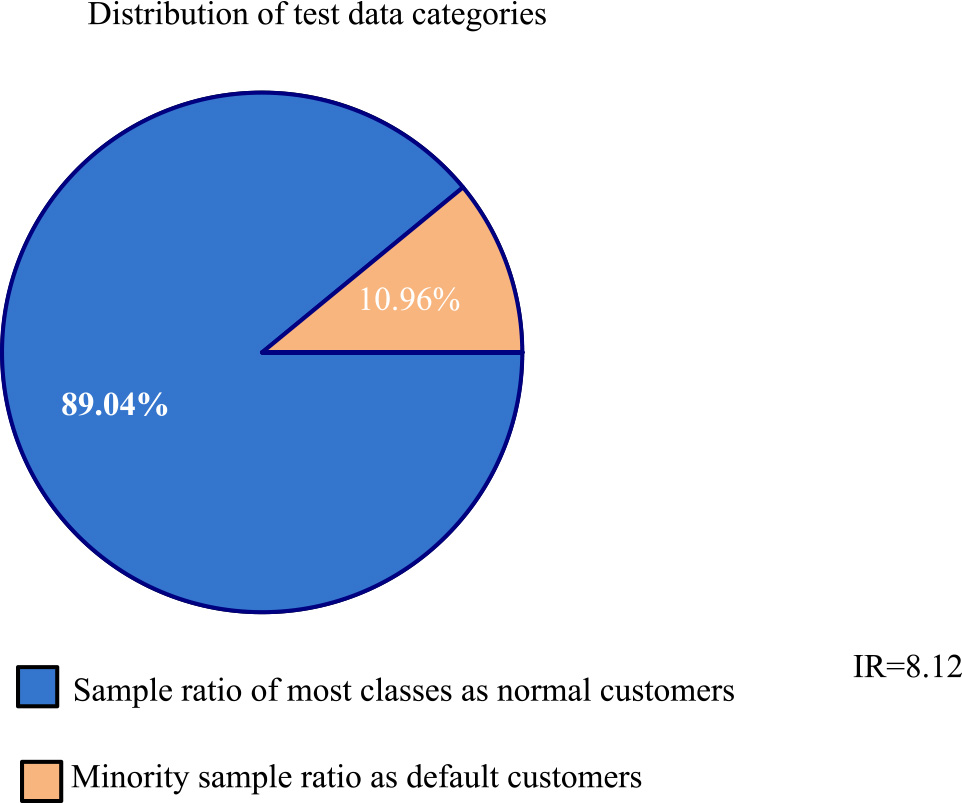
According to Figs 5 and 6, count the amount of missing values of each sample in the training set and test set. According to the order of the number of missing values from small to large, with the serial number as the abscissa and the missing values as the ordinate, draw the distribution map of the number of missing values in the training set test set as Figs 7 and 8.
Distribution of missing values in training set.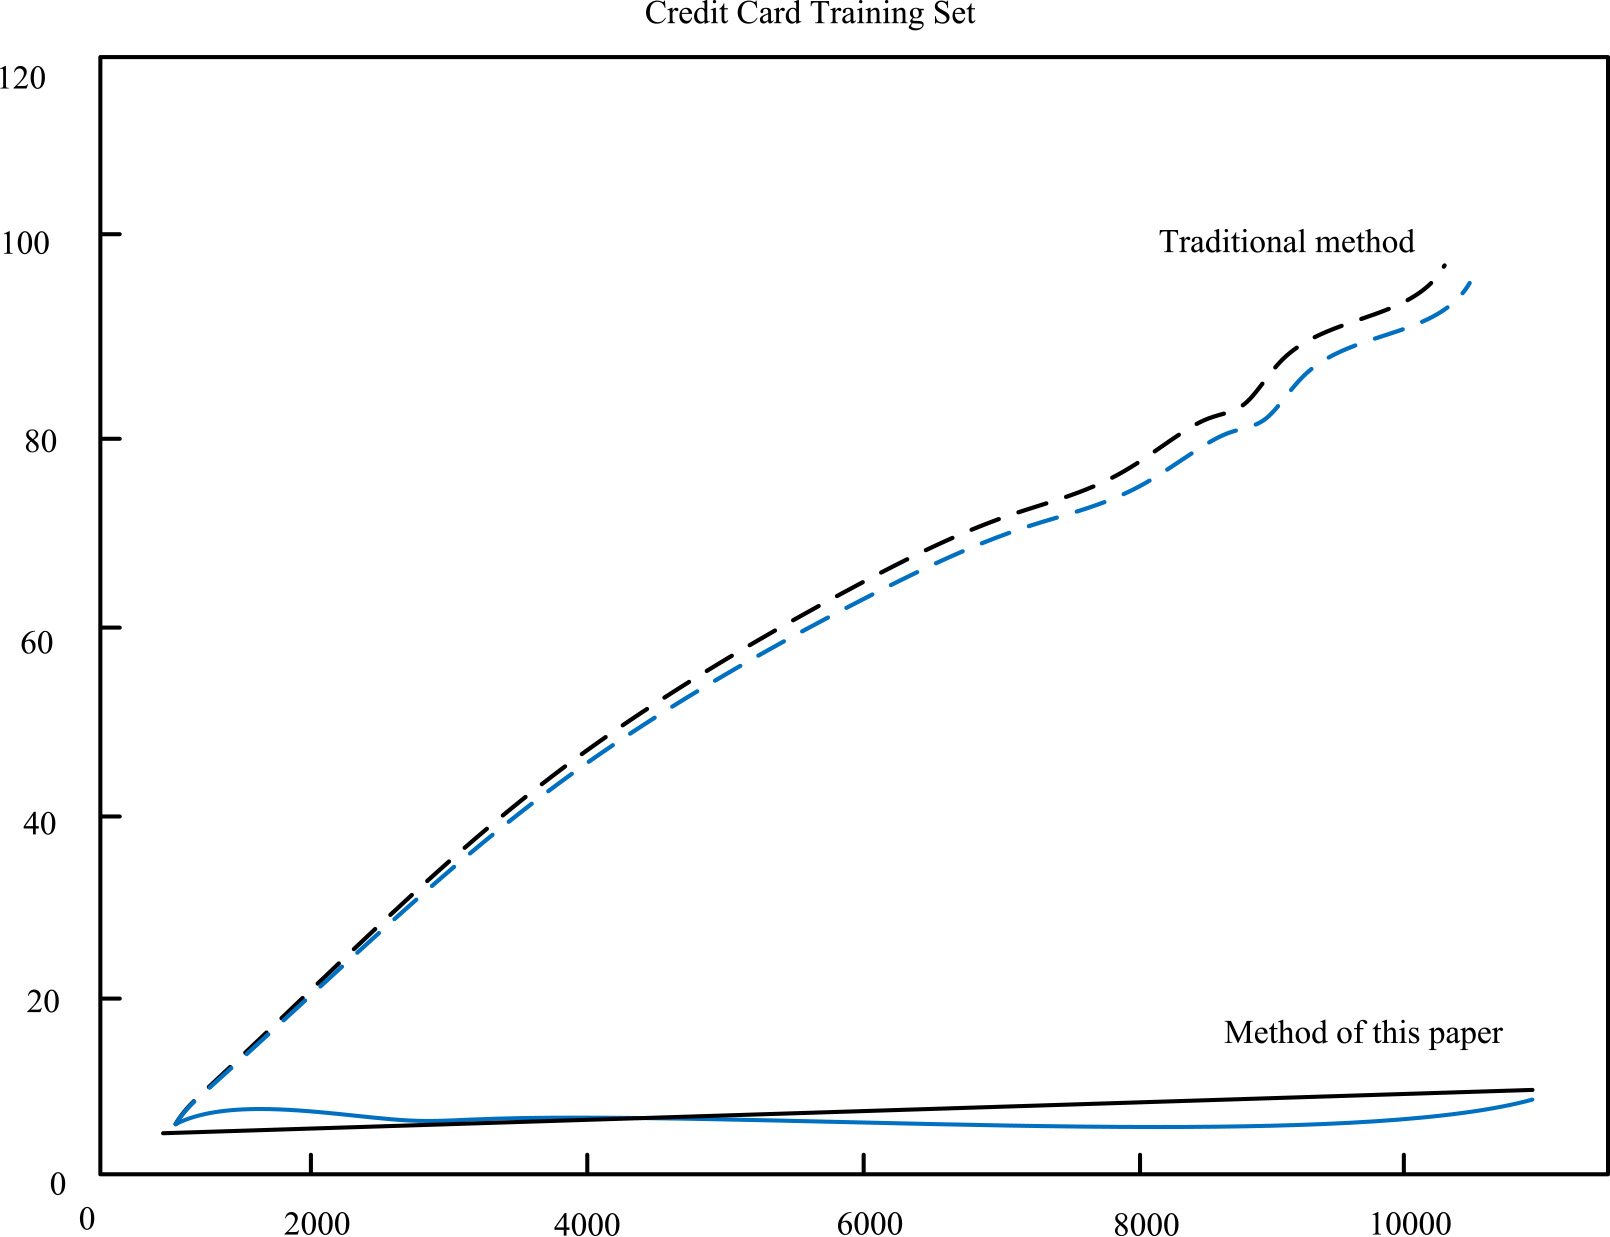
Distribution of missing values in test set.
In Figs 7 and 8, the black curve is the scatter diagram of missing values, and the blue curve is the cumulative number of negative samples (i.e. default samples) It is a strict straight line, which indicates that there is a certain correlation between the sample category and the number of missing values.
Based on the constructed credit risk prediction system and the results of simulation experiments, a number of science and technology credit companies are selected as research samples for model construction and credit risk prediction, and 100 times of cyclic training are conducted. The variables selected into the model for the first time are 106 financial index variables, which include technology credit profitability, debt paying ability, risk defense ability, cash flow, capital structure, operating ability and per share index for comprehensive calculation. Through the correlation analysis of multiple financial index variables, 8 financial index variables with strong correlation with other variables are eliminated. On this basis, the elasticnet penalty method is used to screen the model indicators. The 11 significant financial index variables are further analyzed by principal component analysis, and finally five principal components are obtained. The logistic regression model is constructed to predict the risk, and the experimental results are satisfactory. The results show that the number of data is obviously reduced, the ability of risk prediction is obviously improved, and the algorithm has better practical application effect.
Credit risk is a hot issue in financial risk management, which is closely related to national macroeconomic form and international development trend. The emergence and development of Internet credit and other emerging business models have brought a huge impact on financial technology. How to give full play to the value of scientific and technological credit data has become an urgent problem for data mining technology. Scientific and technological credit risk assessment with scientific and technological data technology as the core can build a more accurate and wider scientific and technological credit risk model, which will become a powerful supplement and development trend of traditional credit assessment system.
In order to verify the practical application effect of the technical credit risk prediction algorithm, experimental testing was carried out. The elastic net method is selected to screen financial indicators, and the selected financial indicators are used as new model variables. The confusion matrix and ROC curve are used to evaluate the prediction effect of the model on China’s science and technology credit risk. For the binary classification problem of unbalanced data sets, a confusion matrix is usually obtained. The classification accuracy is calculated according to the confusion matrix. The logistic regression model shown in Fig. 4 is constructed to predict the credit risk of technology credit companies, and the prediction effect is better. The experiment carried out 30 cycles to get the feature importance score in the dataset and sort them. Then, the individual classifiers, including xgboost, Ann and LR, and the benchmark model for comparative analysis are iterated for 36 times, and the prediction results of these experiments are averaged to reduce the impact of separate partition. Calculate the number of missing values for each sample in the training set and test set. According to the order of the number of missing values from small to large, with the serial number as the abscissa and the missing value as the ordinate, draw a distribution map of the number of missing values in the test set of the training set. It can be seen that there is a certain correlation between the sample category and the number of missing values. The amount of data is significantly reduced, and the risk prediction ability is significantly improved. The algorithm has a good practical application effect.
This paper analyzes the challenges faced by science and technology credit risk assessment, expounds the key technologies and applications of data mining in the process of data selection, preprocessing and credit risk modeling, and puts forward some ideas for the future research direction of science and technology credit risk assessment.
Footnotes
Acknowledgments
This work is supported by the open funding project of Financial Synergy Innovation of Science and Technology Center in Hebei Province and Science and Technology Finance Key Laboratory of Hebei Province in 2020 (Grant No. STFCIC202003).