This study analyzed three prediction models: ID model, GM (1,1) model and back-propagation neural network (BPNN) model. Firstly, the principles of the three models were introduced, and the prediction methods of the three models were analyzed. Then, taking enterprise A as an example, the demand for human resources was predicted, and the prediction results of the three models were compared. The results showed that the maximum and minimum errors were 240 people and 12 people respectively in the prediction results of the ID3 model and 64 people and 37 people respectively in the prediction results of the GM (1, 1) model; the errors of the BPNN model were smaller than ten people, and the minimum value of the BPNN model was three people, which was in good agreement with the actual value. The prediction of the human resource demand of enterprise A in the future five years with the BPNN model suggested that the demand for employees would growing rapidly. The results show that the BPNN model has better reliability and can be popularized and applied in practice.
Human resource is the most important part of the development of an enterprise [1]. Under the reasonable arrangement of human resources, other resources can play a maximum effect. As the competition among enterprises becomes more and more fierce, higher requirements are put forward for human resource management (HRM) [2]. HRM [3] refers to that enterprises analyze the human resources according to the requirements of development to give corresponding measures to meet the requirements of enterprise development. At present, in HRM, most decisions, such as post allocation, staff rewards and punishments, performance appraisal, etc. [4], are made by relying on personal experience, leading uneven salary distribution, talent loss, and low staff satisfaction. With the development of society and economy, the decision made based on people’s subjective judgment is not suitable for the current environment, which is not conducive to the long-term development of enterprises. The environment of enterprise development is changing, and the demand for human resources will also change. Scientific prediction results of human resource demands are conducive to the reasonable distribution of human resources. Many demand prediction models have been applied in different fields [5, 6]. This article mainly studies the decision three model, the gray model and the neural network model. Applications of the decision tree model in data prediction are as follows. Brims et al. [7] predicted malignant pleural mesothelioma (MPM) with classification and regression tree analysis, collected case data between 2005 and 2014, and found that the method had a sensitivity of 94.5%. Flores et al. [8] conducted a study on several pasture improvement methods, predicted functional group abundance through the decision tree method, and found that the decision tree model could be used to set soil fertility targets based on the determined targets of pasture functional group abundance. Khan et al. [9] used the J48 decision tree algorithm to predict the final grades of students based on their past performance data to help teachers, students and their parents to know the students’ performance in advance and take preventive measures. Applications of the gray model in data prediction are as follows. Duan et al. [10] designed a non-uniform discrete gray model (NDGM) for data prediction, achieving high stability and prediction performance. Jing et al. [11] used the gray model to predict the reliability of the board-level solder joints and found through experiments that the method could effectively predict the remaining service life of the solder joints. Applications of neural network model in data prediction are as follows. Guo et al. [12] introduced the self-memory principle into GM (1, M) model and applied it to engineering prediction. Through example analysis, it was found that this method had significant prediction performance. Applications of the neural network model in data prediction are as follows. Jahangir et al. [13] used the neural network model to predict floods in Iran and performed flood modeling taking slope and rainfall data as inputs. They found that the method was reliable in predicting floods. Nagarkar et al. [14] predicted the vehicle suspension system with a neural network model. Through simulation experiments, they found that the prediction results of the method were closely related to the actual situation. Fanning et al. [15] studied the effectiveness of the generalized adaptive neural network algorithm in predicting financial risks and found through experiments that the method had good classification effects and worked efficiently. This paper firstly introduced the ID3, GM (1, 1) model and back-propagation neural network (BPNN) model, predicted the human resource in power supply company A with the three models, and compared and analyzed the prediction results to understand the applicability of the three models in predicting human resource demands.
ID3 algorithm
The ID3 algorithm is a widely used decision tree algorithm, which selects decision attributes by calculating the size of information. For event , if the probability that it generates is , the calculation formula of its information amount is:
The average information amount is:
If there are classes of in sample set , then the probability that sample is is written as:
For attribute , the subset whose value is is denoted as , the expected entropy of is written as:
Its information gain can be written as:
The ID3 algorithm takes the attribute with the largest information gain as the root node to complete the establishment of the decision tree.
GM (1, 1) prediction model
The grey system is a method to determine unknown information through known information, making many contributions in many fields [16]. It is suitable for incomplete and random human resource data, among which the GM (1, 1) model [17] is the most common one.
It is assumed that the original data sequence is ,
The first-order accumulation is performed on , i.e., 1-AGO; then,
is obtained. A GM (1, 1) differential equation is established:
where is the grey number of development and is the grey number of endogenous control. The two parameters are solved. Suppose
and
According to the least square method,
Then, the GM (1, 1) prediction model can be written as:
After getting the GM (1, 1) model, its accuracy is tested to ensure reliability. The following two methods are used in this study.
Residual checking: for original sequence , if the actual value is and the predicted value is , then its residual is:
the relative error is:
the average relative error is:
and the accuracy is:
For the GM (1, 1) model, 10% is the best if 20%, and 90% is the best if 80%.
Posterior-variance test: the posterior-variance ratio is:
where
and
The small error probability is:
BPNN prediction model
When the human brain is working, there is a rule in the signal transmission of neurons. Artificial neural network (ANN) forms after the rule is extended to machine learning [19]. BPNN is one of the most widely used models [18]. It is assumed that the input vector of BPNN is:
the number of neurons is , the output vector is:
the number of output layers is , the input vector of the hidden layer is:
the output vector of the hidden layer is:
the number of hidden layers is , the input vector of the output layer is:
the output vector of the output layer is:
the weight value between the input layer and hidden layer is , the weight value between the hidden layer and output layer is , the threshold value of the hidden layer is , and the threshold value of the output layer is .
In the training process of BPNN, the output of different layers can be expressed as:
the input of the hidden layer is:
the output of the hidden layer is:
the input of the output layer is:
the output of the output layer is:
the error of the output layer is:
the error of the hidden layer is:
According to the above equations, the error can be corrected by modifying the weight and threshold values. The corrections can be written as:
After constant correction, the algorithm ends until the error meets the accuracy.
Comparison of prediction results of human resource demands of enterprise A
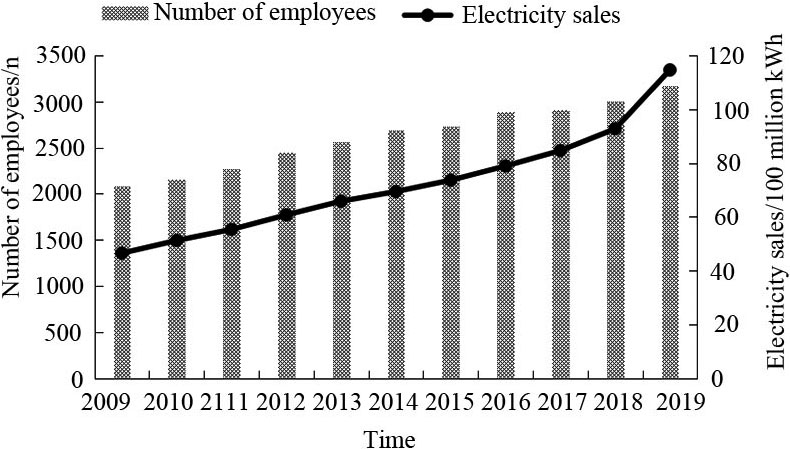
Enterprise A is a large power supply enterprise. In 2019, the number of employees in enterprise A has reached 3168, and the employees are becoming younger and younger. The average age of the employees was 35.67 years old, and the number of employees aged 20–40 was the largest. With the development of society, the demand of the new generation of the labor force for a sense of value and achievement is increasing, and the turnover rate is also increasing; therefore, HRM is facing more and more challenges, and the traditional HRM method has been not suitable for the current situation.
This study analyzed the changes in electricity sales and the number of employees of enterprise A from 2009 to 2019, as shown in Fig. 1.
It was seen from Fig. 1 that the number of employees increased with the increase of electricity sales, indicating that electricity sales and the demand for personnel increased with the expansion of the enterprise. It was seen from Fig. 1 that the number of employees in enterprise A showed an increasing trend year by year, indicating that the number of employees in enterprise A will maintain an increasing trend in the future.
Changes in the number of employees in different positions from 2009 to 2019
Production position
Technical position
Management position
2009
1708
332
38
2010
1763
351
42
2011
1832
386
50
2012
1917
476
58
2013
1987
508
72
2014
2015
541
132
2015
2047
559
125
2016
2185
579
127
2017
2133
595
179
2018
2234
599
175
2019
2371
621
176
Changes in the number of employees from 2009 to 2019.
It was seen from Table 1 that the number of employees in the production position was the largest, more than half of the total number of employees, and the number of employees in the technical position and management position was relatively small. In enterprise A, most of the employees with a junior college degree or below were production personnel, serving in front-line production positions, but these positions have lower requirements for academic qualifications; most of the employees with a bachelor’s degree, a master’s degree, or above were management and scientific research personnel, and these positions have high professional requirements for employees because of the high technicality and complexity. For the good development of the enterprise, it was necessary to increase the number of employees in technical positions and management positions to guide the construction of the enterprise better.
The prediction results of the three methods were compared.
In the ID3 model, the data between 2009 and 2013 were taken as the training set to establish the decision tree. Then, the data between 2014 and 2019 were predicted, and the prediction results are shown in Table 2.
The prediction results of the ID3 model
Production position
Technical position
Management position
2014
2023
545
124
2015
2059
567
114
2016
2127
579
138
2017
2154
562
167
2018
2258
621
159
2019
2358
615
168
In the GM (1, 1) model, the data from 2009 to 2013 were taken as the original sequence to predict the data from 2014 to 2019. According to the data of 2009–2013, the GM (1, 1) model was established, and then the accuracy was tested. After calculation, it was found that:
It was found that the GM (1, 1) model had good accuracy and could be used for prediction. The results are shown in Table 3.
The prediction results of the GM (1, 1) model
Production position
Technical position
Management position
2014
1981
537
106
2015
2009
551
112
2016
2233
564
131
2017
2142
583
142
2018
2281
608
157
2019
2408
636
181
The BPNN model needed some indicators when predicting. In this study, four indicators were selected to train the BPNN model, which were electricity sales, total assets, number of customers, number of employees, number of substations, and number of people who are supplied with power. The required historical data are shown in Table 4.
Training data of the BPNN model
Electricity sales/ 100 million kWh
Total assets /million yuan
Number of customers /ten thousand
Number of employees/n
Number of substation/n
Number of people
who are supplied with
power/ten thousand
2009
46.5
4521
78
2078
78
654
2010
51.2
5167
86
2156
82
655
2011
55.3
6251
94
2268
86
656
2012
60.7
7415
102
2451
92
659
2013
65.8
8214
115
2567
105
671
2014
69.4
9210
125
2688
109
673
2015
73.6
9681
136
2731
121
678
2016
78.9
9936
149
2891
125
681
2017
84.6
10021
158
2907
128
685
2018
92.7
11548
169
3008
131
687
2019
114.6
12987
172
3168
137
689
The transfer functions of the hidden layer and output layer in BPNN were S-type tangent function tansig () and linear function purelin (); the learning algorithm used the trainbr method. According to the input and output data, the number of input nodes of the model was 6, and the number of output nodes was 1. The number of nodes in the hidden layer was set as 3 according ot the empirical formula. The final structure of the model was 6-3-1. The learning rate was 0.01. The momentum coefficient was (0, 1). The maximum number of iterations was 500. The number of employees in enterprise A from 2014 to 2019 was predicted using the trained BPNN model, as shown in Table 5.
Prediction results of the BPNN model
Production position
Technical position
Management position
2014
2019
545
114
2015
2045
561
121
2016
2181
574
145
2017
2150
596
161
2018
2235
608
164
2019
2369
620
178
The prediction errors of the models/n
ID3
The GM (1, 1) model
The BPNN model
2014
12
64
10
2015
72
59
4
2016
129
37
9
2017
98
40
3
2018
240
38
6
Comparison of the predicted and actual number of employees.
The prediction results of the three models were compared, as shown in Fig. 2.
It was found from Fig. 2 that the prediction results of the ID3 model and the GM (1, 1) model had a larger error compared with the actual number of employees, while the results of the BPNN model were in good agreement with the actual number of employees, which indicated that the predicted number of employees was closer to the actual number. The errors of the two models were calculated, and the results are shown in Table 6.
It was found from Table 6 that the maximum and minimum errors of the ID3 model were 240 and 12, respectively; the maximum and minimum errors of the prediction results of the GM (1, 1) model were 64 and 37, respectively. The errors of the prediction results of the BPNN model were all smaller than 10, and the minimum error was only 3. It showed that the BPNN model could make an accurate prediction on the human resource demand of enterprise A.
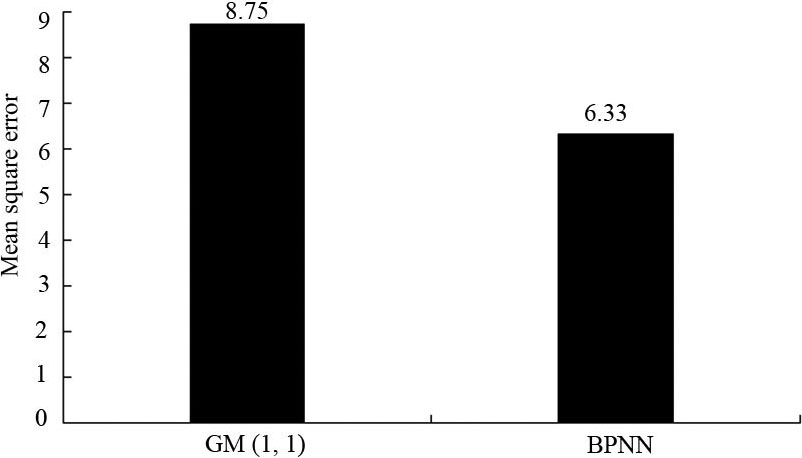
The mean square error of the two models were calculated, and the results are shown in Fig. 3.
It was seen from Fig. 3 that the mean square error of the ID3 model was 10.12, the mean square error of the GM (1, 1) model was 8.75, and the mean square error of the BPNN model was 6.33, i.e., the mean square error of the BPNN model was 37.45% smaller than the ID3 model and 27.66% smaller than the GM (1, 1) model, verifying the accuracy of the BPNN model in predicting human resource demands.
The number of employees of enterprise A in the next five years was predicted by the BPNN model, as shown in Table 7.
The prediction of human resource demand of enterprise A from 2020 to 2024
Human resource demand/n
2020
3232
2021
3368
2022
3521
2023
3689
2024
3816
Comparison of mean square error.
It was seen from Table 7 that the demand for human resources of enterprise A in the next five years showed an increasing trend, indicating that the enterprise was in vigorous development and had a strong demand for human resources. The prediction results of the BPNN model could be used as a guidance and basis for HRM of enterprise A to provide reliable support for the personnel recruitment and management of enterprise A in the future.
Discussion
Data prediction is an important content in data analysis, and it is also a key issue that researchers pay attention to. Data mining and machine learning methods have been widely used in data prediction. This article mainly focuses on the gray model and neural network model.
It was found from the experimental results that the ID3 model performed poorly in predicting human resource demands. It was seen from Fig. 2 and Table 6 that the prediction result of the ID3 model had a maximum error of 240 people with the actual result when the model predicted the staff demand in 2018, and the minimum error was 12 people, indicating that the algorithm not only had large error but also had unstable performance. The prediction result of the GM (1, 1) model also had a large difference with the actual number of people, above 30 people, and the maximum error was 64 people; the prediction results of the BPNN model were in good agreement with the actual number of people, the error was small, below ten people, and the maximum error was ten people, indicating that the prediction results of the BPNN model were better. It was also found from the comparison of the mean square error that the mean square error of the prediction result of the BPNN model was 27.45% smaller than the ID3 model and 27.66% smaller than the GM (1, 1) model, which verified the effectiveness of the BPNN model. Finally, the prediction results of the BPNN model for the human resource demand of enterprise A in the next five years suggested that the demand for human resources of enterprise A grew steadily, indicating that the BPNN model could effectively predict the human resource demand of enterprises to support subsequent recruitment and management works.
It is seen from the experimental results that the BPNN model showed the best performance, the highest accuracy, the most accurate prediction results, and the smallest prediction error in predicting human resource demands. For enterprises that need prediction of human resource demands, methods with higher accuracy are more beneficial to realize better management. Therefore, the BPNN model can be further promoted and applied in practice.
Conclusion
Taking enterprise A as an example, this study established ID3, GM (1, 1) and BPNN models and compared the performance of the three models. The results showed that the performance of ID3 and GM (1, 1) models was not as good as the BPNN model in predicting human resource demands and their errors were large. The prediction results of 2014–2019 showed that the coincidence degree between the prediction results of multiple regression and GM (1, 1) models and the actual number of employees was not high, but the prediction result of the BPNN model was closer to the actual number. Therefore, compared with the other two models, the BPNN model has higher availability in human resource demand prediction, which can be promoted and applied in practice. Although this study obtained some achievements, there were some shortcomings. In future works, applications of more models in predicting human resource demand will be studied and compared, and the three models proposed in this study will be further optimized and improved to realize better prediction of human resource demands.
References
1.
PrabawatiIMeirinawatiMOktariyandaTA. Competency-based training model for human resource management and development in public sector. Journal of Physics: Conference Series.2018; 953(1): 012157.
2.
ShahibiMSSaidinAAdilTIzharTAT. Evaluating user satisfaction on human resource management information system (HRMIS): A Case of Kuala Lumpur City Hall, Malaysia. International Journal of Academic Research in Business & Social Sciences.2016; 6(10): 95-116.
3.
NieDLamsaAMPucetaiteR. Effects of responsible human resource management practices on female employees’ turnover intentions. Business Ethics A European Review.2017; 27(1): 29-41.
4.
TianAWCorderyJGambleJ. Staying and performing: How human resource management practices increase job embeddedness and performance. Personnel Review.2016; 45(5): 947-968.
5.
AlbeyENorouziAKempfKGUzsoyR. Demand modeling with forecast evolution: An application to production planning. IEEE Transactions on Semiconductor Manufacturing.2015; 28(3): 374-384.
6.
GhalehkhondabiIArdjmandEWeckmanGRYoungWA. An overview of energy demand forecasting methods published in 2005–2015. Energy Systems.2016; 8(2): 1-37.
7.
BrimsFJMeniawyTMDuffusIde FonsekaDSegalACreaneyJMaskellNLakeRAde KlerkNNowakAK. A novel clinical prediction model for prognosis in malignant pleural mesothelioma using decision tree analysis. Journal of Thoracic Oncology Official Publication of the International Association for the Study of Lung Cancer.2016; 11(4): 573-582.
8.
FloresPGLópezIFKempPDDörnerJZhangB. Prediction by decision tree modelling of the relative magnitude of functional group abundance in a pasture ecosystem in the south of Chile. Agriculture Ecosystems & Environment.2017; 239: 38-50.
9.
KhanBKhiyalMKhattakMD. Final grade prediction of secondary school student using decision tree. International Journal of Computer Applications.2015; 115(17): 32-36.
10.
DuanHShaoKXiaoXYangJ. Research on the stability of NDGM model with the fractional order accumulation and its optimization. Mathematical Problems in Engineering.2017; (1): 1-10.
11.
JingBChenYShengZHuJSunM. Research on life prediction of board-level solder joints based on fusion of multi-feature parameters and gray model. Chinese Journal of Scientific Instrument.2018; 39(8): 72-79.
12.
GuoXLiuSWuLGaoYYangY. A multi-variable grey model with a self-memory component and its application on engineering prediction. Engineering Applications of Artificial Intelligence.2015; 42(6): 82-93.
13.
JahangirMHReinehSAbolghasemiM. Spatial predication of flood zonation mapping in Kan River Basin, Iran, using artificial neural network algorithm. Weather and Climate Extremes.2019; 25: 100215.
14.
NagarkarMPEl-GoharyMABhaleraoYJPatilGJVPatilRNZ. Artificial neural network predication and validation of optimum suspension parameters of a passive suspension system. SN Applied Sciences.2019; 1(6): 569.
15.
FanningKMCoggerKO. A Comparative Analysis of Artificial Neural Networks Using Financial Distress Prediction. Intelligent Systems in Accounting Finance & Management.2015; 3(4): 241-252.
16.
CameliaD. Grey systems theory in economics – a historical applications review. Grey Systems.2015; 5(2): 263-276.
17.
XuMLiuCLLiDZhongXL. Tourism ecological security early warning of Zhangjiajie, China based on the improved TOPSIS method and the grey GM( 1,1) model. Chinese Journal of Applied Ecology.2017; 28(9): 3731.
18.
Pinto FerreiraRMartinianoAFerreiraAFerreiraASassiRJ. Study on daily demand forecasting orders using artificial neural network. IEEE Latin America Transactions.2016; 14(3): 1519-1525.
19.
ZhangYGaoXKatayamaS. Weld appearance prediction with BP neural network improved by genetic algorithm during disk laser welding. Journal of Manufacturing Systems.2015; 34(C): 53-59.