
Abstract
Using artificial neural network (ANN) to solve the problem of time series water quality prediction has become increasingly mature. In this paper, through the study of leaky-integral echo state neural network (Leaky ESN), combined with the historical water quality data of Dongzhen Reservoir in Fujian Province, a single-day water quality prediction model was constructed, and the Bayesian optimization algorithm was used to realize the automatic optimization of hyper-parameters in the network. On this basis, multi-day prediction models were constructed by further improving the network, which used the historical water quality data of the previous 7 days to predict the water quality of the next 3 days, 5 days and 7 days. Then the prediction models were applied to the water quality prediction of the study. The experimental results show that the single-day prediction model with Bayesian optimization has high accuracy. The multi-day prediction models can also achieve good prediction effect, and have more practical application value. They are more suitable for early warning of water quality.
Keywords
Introduction
Over the years, many surface water bodies have faced a series of problems such as water quality decline, eutrophication and destruction of aquatic ecosystems, resulting in environmental degradation, affecting the orderly development of ecology and endangering the lives and health of residents [1, 2, 3]. However, the water environment monitoring method based on the monitoring point could only obtain the current water quality situation [4, 5], and cannot predict and warn the water environment pollution in advance. Therefore, in order to reduce health risks and control water pollution sources in time, it is necessary to make reliable and accurate water quality prediction in advance.
So far, a large number of scholars have studied various models to predict water quality changes and have achieved certain results [6, 7, 8, 9, 10, 11, 12]. Zhao Jun used the BP neural network to predict the water quality of the Minjiangkou Water Plant [13], and Li Xinxin used the GA-BP neural network to predict the water quality of the construction area [14]. However, the prediction accuracy of these water quality prediction models is generally low, because they can not reflect the time series characteristics of water quality monitoring data. Compared with BP neural network, recurrent neural network (RNN) can describe the internal characteristics of dynamic system [15, 16, 17], so that the system has the ability to adapt to time-varying characteristics. Especially in time series forecasting, RNN can obtain higher prediction accuracy through recursive structure. Echo State Network (ESN) [18] is a new type of RNN, which can greatly reduce the amount of calculation in training and avoid the local minimum in gradient descent to a certain extent. In this paper, we studied the Leaky-integrator echo state network (Leaky ESN), which was an improved ESN [19]. According to the characteristics of water quality factors of Dongzhen Reservoir, Leaky ESN was selected to construct single-day prediction model and multi-day prediction models for Dissolved Oxygen (DO), Ammonia Nitrogen (NH3-N) and Permanganate Index (
Leaky ESN principle and evaluation indicator
Leaky ESN principle
The network structure of Leaky ESN and ESN is exactly the same, and the network is divided into 3 layers: reservoir layer, input layer and output layer. The network structure is shown in Fig. 1.
ESN structure.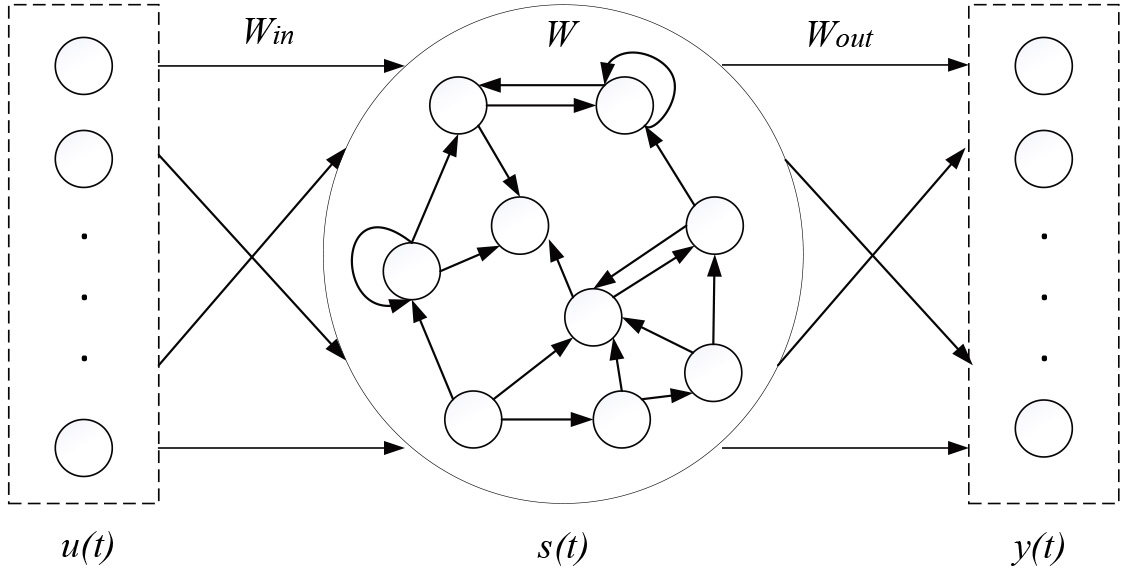
The core of leaky ESN is the reservoir. There are many sparse neurons in the reservoir, and they are randomly connected. With the continuous change of input in the network, these neurons generate a complex dynamic space and internal state information. Finally, using these internal state information and the output weight obtained by training, the required corresponding outputs are linearly combined. The input sequence, state sequence and output sequence in the network are as follows.
where
The output of the ESN can be obtained from the state of the reservoir. The equation is below.
From the above Eq. (5), the output of the Leaky ESN at each moment can be obtained. Usually the data is linear and feedforward, and the final output sequence can be written as follows.
However, the ultimate goal of network optimization is to make the actual output of the network infinitely approach the expected output, so the network output sequence can be written as the follows.
There are many ways to solve
Where
The Leaky ESN based on ridge regression can improve the prediction accuracy of the nonlinear model. Unlike other networks, it does not need to train all the weight matrix, only the output weight matrix
In order to evaluate the performance of water quality prediction model based on Leaky ESN, this study selected Nash-Sutcliffe Efficiency Coefficient (NSE) and Root-Mean-Square Error (RMSE) to verify the accuracy of the prediction model [22]. The formulas were described as follows.
where
Sample datasets
The sample set selected in this study is the monitoring data of water quality indicators of Dongzhen Reservoir in Fujian Province in the past three years from 2018 to 2020. A total of 1077 water quality indicators are sampled, and the sampling period is once a day. The statistics of each water quality factor (TEMP denoted water temperature, PH denoted potential of hydrogen, DO denoted Dissolved Oxygen, EC denoted Electric Conductivity, TUB denoted Turbidity, NH3-N denoted Ammonia Nitrogen,
Statistical table of water quality factor
Statistical table of water quality factor
Owing to the complexity of water quality and many parameters affecting water quality, it is necessary to construct a model for each indicator to complete the comprehensive water quality forecast. In this study, only three factors (DO, NH3-N and
Because of sensor errors, transmission errors and other reasons, abnormal and missing data will appear in online monitoring of big data. These abnormal and missing data need to be detected and repaired, otherwise it will seriously affect the effective construction of water quality prediction model. In order to ensure the accuracy of the model, outliers and missing values were repaired and filled in this study, and the missing data in sample datasets were filled by linear interpolation in SPASS tools [23].
Data normalized processing
The inconsistency of dimensional and dimensional units among water quality indicators will interfere with the results of data analysis. Therefore, before modeling, it is necessary to normalize each indicator for comprehensive comparison purpose [24]. When all factors are in the same order of magnitude, some low-value features can be avoided to be submerged. It is particularly emphasized that the training data and test data need to be normalized respectively to ensure the prediction effect of the model and prevent the influence of test data on the prediction accuracy of the model. The method is as follows.
Where
Single-day prediction model
Single-day prediction model based on Leay ESN acturally uses the historical data of the previous day to predict the water quality of the next day. The parameters in the training process include the size of the reservoir (i.e. N), the sparsity of the reservoir (SD), the spectral radius coefficient (SR), the input scale (IS), the regularization coefficient (Reg) and the leaky rate
Set the number of output and input neurons of the training dataset to 1, that is, L The training set Using the least square method of ridge regression, Input the data from the test set into the trained model to obtain each predicted output.
Finally, RMSE and NSE are used to validate the prediction model.
Single-day prediction model can only predict the water quality data of the next day. In practical engineering applications and environmental monitoring, it is often necessary to predict the changes of each water quality factor in the next few days so as to meet the needs of early warning of water quality. Therefore, this study improved the model on the basis of Leaky ESN, so as to achieve the prediction of multi-day water quality changes with historical data, and constructed the models of DO, NH
Initializes The biggest difference from the single-day prediction model is the adjustment of input and output. The input of the training data set is changed to From the output matrix Input the data from the test set into the model trained in step 3, and the prediction output of each model can be obtained by Eq. (5).
Finally, RMSE and NSE are used to verify the effect of each prediction model.
Hyper-parameters and error values of single-day prediction model
Hyper-parameters and error values of muti-day prediction model
Water quality prediction results (DO, 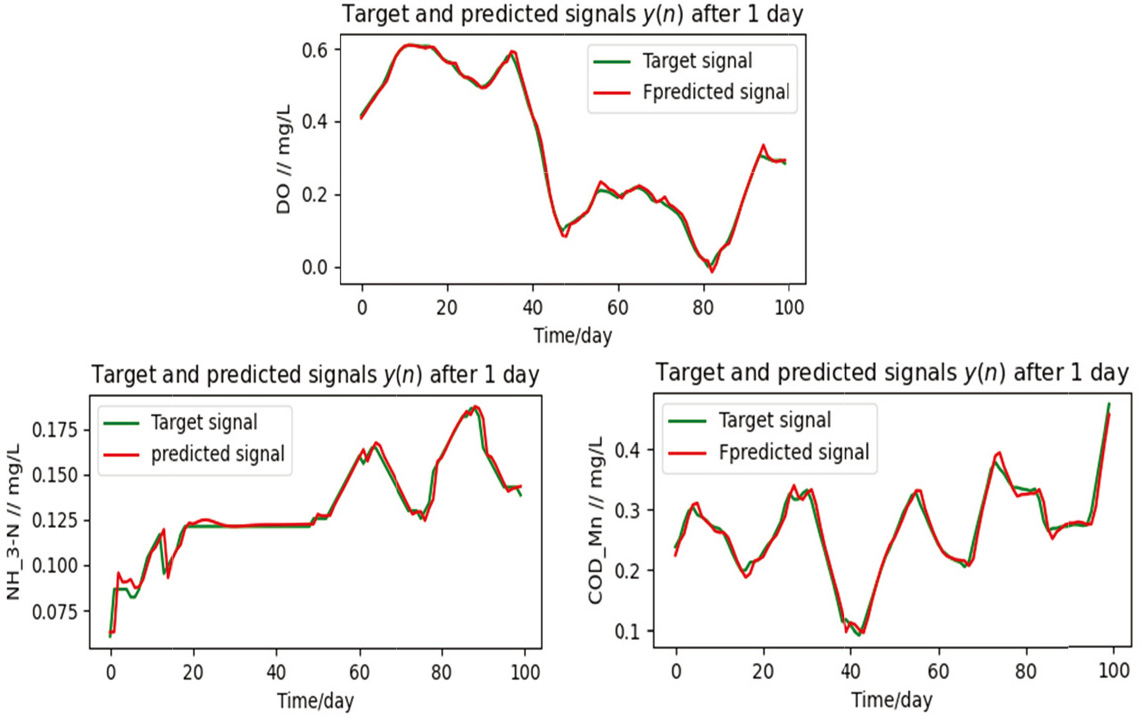
Water quality prediction results (DO, 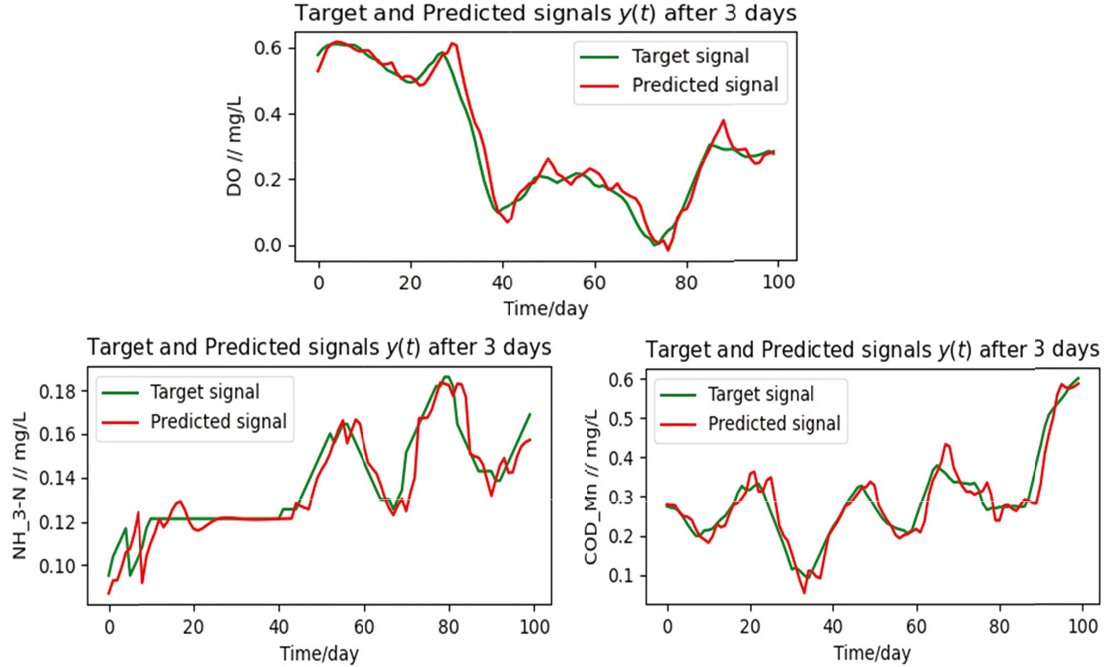
Water quality prediction results (DO, 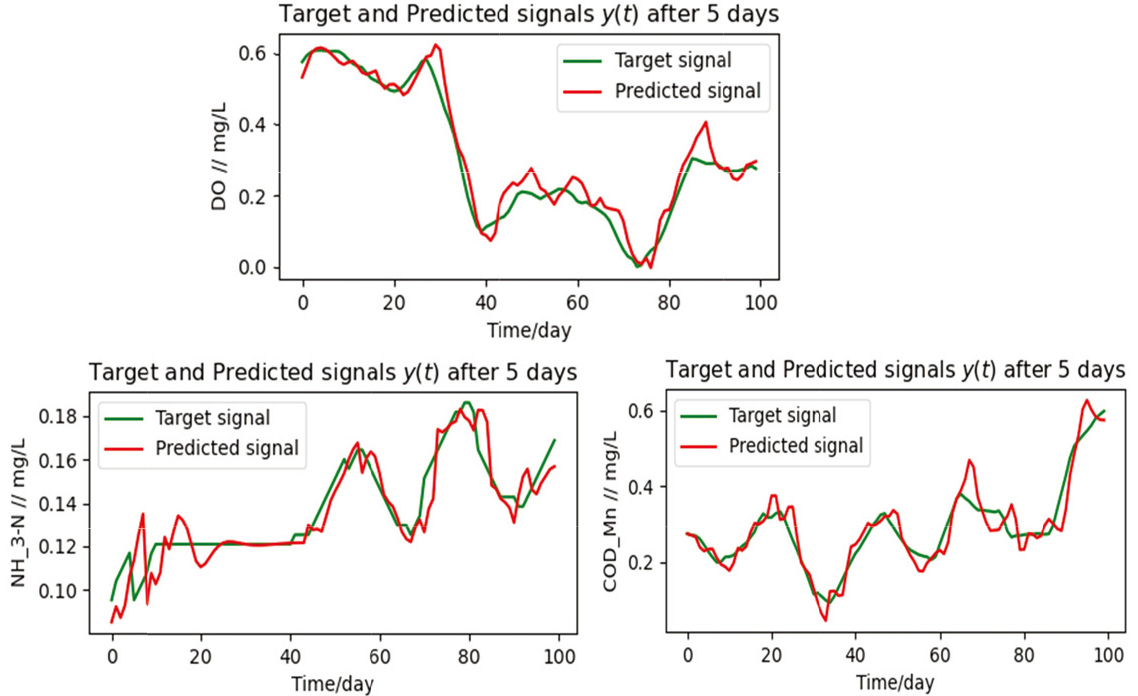
Water quality prediction results (DO, 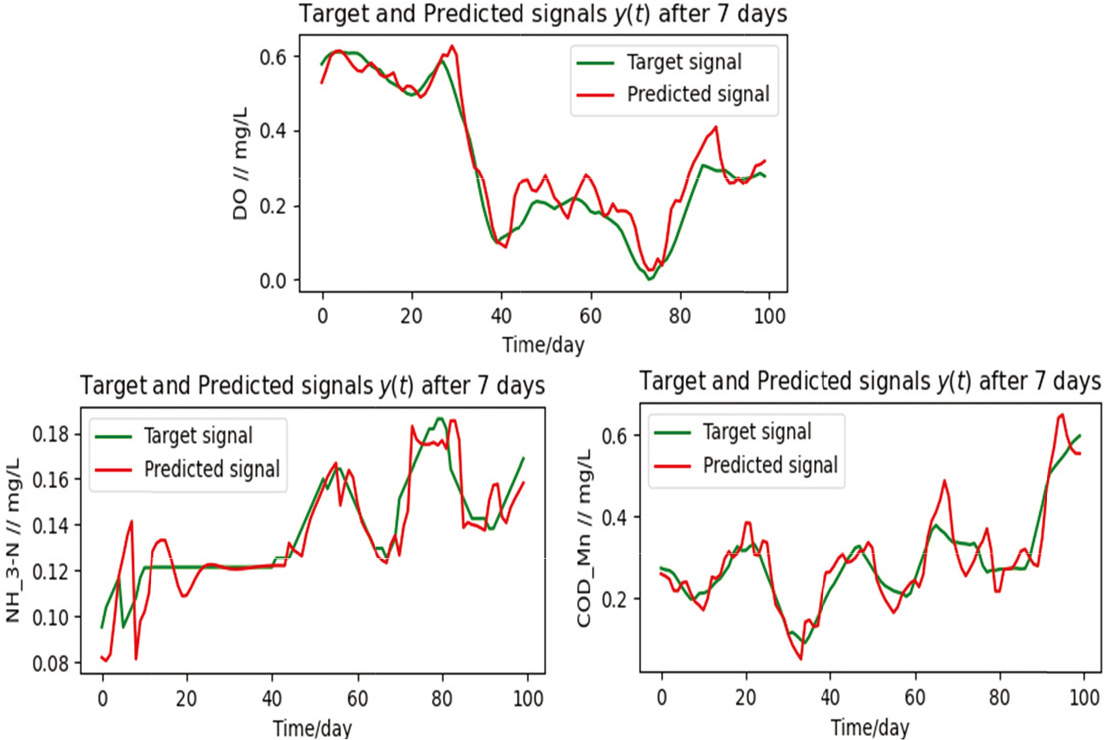
Analysis of single-day prediction results
The results of prediction demonstrated that there is a good fit between the real monitoring value and the predicted value of the model. The forecasting accuracy can be reflected from the evaluation indicators. The error value of the Leaky ESN model constructed by Bayesian optimization algorithm for the prediction of each water quality indicator is shown in Table 2, and the forecasting effect is shown in Fig. 2 (where DO represents dissolved oxygen,
Analysis of muti-day prediction results
The results in Table 2 show that the NSE values of each water quality parameter obtained from the single-day forecasting model are all above 0.96, and the reliability of the model is very high. The hyper-parameter values of the improved forecasting models and the comparison of the evaluation indicators of these models are shown in Table 3 (DO represents dissolved oxygen,
The effect of each water quality parameter predicted by the 3-day prediction model, 5-day prediction model and 7-day prediction model are shown in Figs 3 to 5.
Compared with the above prediction results, it can be concluded that with the increase of time, the RMSE value of all models will increase, and the NSE value will decrease. This is in line with the model prediction accuracy will decrease with time series. From the multi-day prediction results of three water quality parameters, the prediction accuracy of DO is the highest, and the NSE value can still reach 0.928 after 7 days. Even
Conclusions
In this paper, the single-day and multi-day forecasting models based on ridge regression Leaky ESN were constructed to predict the water quality parameters of DO,
Footnotes
Acknowledgements
Key R & D projects in Hebei Province “Study on watershed water quality prediction method based on measured and remote sensing data of water environment” under Grant 21370103D. Key R & D projects in Hebei Province “Research and demonstration of multi-source remote sensing monitoring and early warning technology for typical ecological disasters of Hebei Province coastal” under Grant 21373301D. Key R & D projects in Hebei Province “Unmanned Airborne Multispectral Joint Hyperspectral Monitoring and Early Warning Technology for Marine Ecological Disasters and Environmental Pollution” under Grant 19273301D. General project of Hebei Natural Science Foundation “Study on the mechanism of marine low frequency variation triggered by the cascade process of upper ocean kinetic energy” under Grant D2019407046. National key R & D projects “Study on Frequent Ecological Disasters Causes and Monitoring and Early Warning System in Qinhuangdao Sea Area” under Grant 2019YFC1407903. Research on Social Sciences Development in Hebei Province “Research on the Construction of River Basin Water Quality Prediction Information System in Hebei Province” under Grant 20210201445. Research on Social Sciences Development in Hebei Province “Red-tide Monitoring Information System Construction in Hebei coastal waters” under Grant 20200302075. Hebei Agricultural Data Intelligent Perception and Application Technology Innovation Center, HebeiQinhuangdao, 066004.