
Abstract
Quantitative investment can manage enterprise assets better to obtain higher revenues. This paper analyzed quantitative investment prediction using machine learning algorithms. First, the support vector machine (SVM) algorithm was introduced, and stock changes were predicted by the SVM algorithm. Then, the feature factors in stock data were extracted by maximum information coefficient (MIC) as the input of the SVM algorithm. Finally, the performance and backtest results of the SVM algorithm was analyzed. It was found that the SVM algorithm had a good performance, and its F1-score was 0.9884, which was better than C4.5 and random forest algorithms. In terms of backtesting, the portfolio built based on the prediction results of the SVM algorithm obtained a higher annualized return rate when the number of stocks was small; when the number of stocks was 10, the portfolio built based on the SVM algorithm had an annualized return rate of 83.67%, a smaller maximum retracement, and a higher Sharpe ratio than the other algorithms, which balanced the risk and return well. The results demonstrate the reliability of the SVM algorithm in predicting quantitative investment, which is beneficial to achieving the optimization of enterprise asset management.
Keywords
Introduction
In the financial markets, predicting future changes is always something that individual and enterprise investors strive for. As the stock market volatility is affected by many factors [1], predicting stocks is challenging [2], and the returns of investments are also full of uncertainties. With the development of technology, financial data can be analyzed and processed by various algorithms to forecast future returns and construct portfolios for quantitative investment [3]. Quantitative investment analyzes a large amount of data to extract useful information before building a model and then analyzes investment feasibility by validating the model. In enterprise asset management, its quantitative investment process generally consists of analyzing and screening factors related to return and risk, evaluating stocks, and recombining them to improve the return on enterprise investments. Quantitative investment uses mathematical models instead of subjective human judgment, which is a more rational and objective way of investment. It avoids errors and losses that may result from subjective decisions and balances the return and risk of enterprises better, which is more conducive to enterprise asset management. How to accurately predict stock prices [4] and then build portfolios is an important issue. Advances in machine learning algorithms have provided more new methods for stock market forecasting [5]. Wang et al. [6] predicted the one-day volatility of Chinese and Japanese stock indices with a Generalized Autoregressive Conditional Heteroskedasticity (GARCH) model, analyzed the results using the CSI 300 and Nikkei 225 indices, and found that the method had a favorable forecasting performance. Ji et al. [7] used an improved particle swarm optimization (IPSO) and Long Short Term Memory (LSTM) hybrid model for stock price prediction and found through experiments on the Australian stock market index that the model had good reliability. Ferdaus et al. [8] designed a parsimonious learning machine (PALM) to predict stock indices and found through predicting closing prices of 15 stock markets that the method had good performance. Thapa et al. [9] predicted Nepalese stock market volatility with Geometric Brownian Motion (GBM), carried out experiments on the stock market under the COVID-19 pandemic in 2020, and found that the method had a good degree of flexibility. Compared with current research, this paper made use of the advantages of machine learning algorithms in stock price prediction to build portfolios using stocks predicted to rise and applied it in the asset management of enterprises to achieve more objective and scientific quantitative investment, which is not only helpful to help enterprises get higher investment returns but also can promote the further development of the quantitative investment.
Prediction methods based on machine learning algorithms
Support vector machine
Machine learning [10] is a process of observing existing data to summarize rules, predicting future things with the rules, and simulating humans with machines. The support vector machine (SVM) algorithm, a common binary classification method in machine learning [11], has very extensive applications in data prediction [12], graphics processing [13], text mining [14], image classification [15], etc. The goal of SVM is to find a hyperplane to classify data sets, and its formula is written as:
where
The above equations are transformed into the following equation using the Lagrangian function:
where
Then, the classification function of SVM is obtained:
In practical situations, it is generally difficult to find a hyperplane that can separate the data completely and accurately; thus, slack variable
In dealing with nonlinear problems, SVM first transforms the data into a high-dimensional space and then makes the samples linearly differentiable. The decision function of the nonlinear SVM is written as:
where
where
When predicting stock changes with the SVM, the relevant factors need to be extracted from the stock data as the input to the SVM first. In this paper, the feature factors were selected from the quotation side and technical side. The quotation-side factors include the amount of increase and decrease, opening price, closing price, turnover rate, and volume. The technical-side factors are shown in Table 1.
Technical-side factors
Technical-side factors
The above 17 factors were re-screened by maximum information coefficient (MIC) [16]. MIC is an algorithm that measures the correlation between data [17]. Mutual information refers to information content shared between two variables. The formula for feature selection using mutual information can be written as:
where
where
Ultimately, the equation for feature selection based on MIC can be written as:
Quantitative investment process for enterprise asset management
The experimental data used in this paper were from the CSMAR database. The data of the CSI 300 index on trading days between January 1, 2010 and December 31, 2020 were selected, including quotation-side and technical-side feature data. The missing values were filled in. The extreme values were corrected using the quantile method. Then, the min-max standardization was performed on the data. The model was trained using the data between January 1, 2010 and December 31, 2015 and validated using the data between January 2016 and December 31, 2020. The asset management of enterprise A was simulated. The initial capital was set as 10 million yuan. The commission rate was 3 ‰. After feature factor screening by MIC, the future daily change of the stock was predicted by the SVM model. The class label was determined by the closing price. If the predicted closing price of the next trading day was higher than the current value, it indicated that the index rose, denoted as TRUE, and the stock was bought into; otherwise, it was denoted as FALSE, and the stock was sold.
Model evaluation indexes
The evaluation of the results consisted of two parts. Firstly, the performance of the SVM model was evaluated based on the confusion matrix (Table 2).
Confusion matrix
Confusion matrix
The specific indicators included:
(1) precision:
(2) recall rate:
(3) accuracy:
(4) F1-score:
The quantitative investment results were evaluated by backtesting. The specific indicators are shown below.
(1) Annualized return rate: the return rate earned through the portfolio in one year:
where
(2)
where
(3)
where
(4) Maximum retracement: the maximum decline of the portfolio that occurred in the backtest period:
where
(5) Sharpe ratio: excess return per unit of risk:
where
The features were screened using MIC. The factor with the largest
Results of feature screening by MIC.
It was seen from Fig. 1 that when the factor with the largest
To further understand the reliability of feature selection based on MIC, the SVM model was used as the predictive model to compare the accuracy of the model without feature selection with the accuracy of the model that selected features based on another commonly used feature selection method, principle component analysis (PCA) [18]. The accuracy of different methods is shown in Fig. 2.
It was seen from Fig. 2 that the accuracy of the SVM model without feature selection was 47.86% only, indicating that the absence of feature selection had a significant impact on the algorithm accuracy and led to a poor prediction accuracy; when PCA was used, the accuracy of the SVM model was 55.43%, which was 7.57% higher than that of the model without feature selection; the accuracy of the SVM model that selected features based on MIC was 14.44% higher than that based on PCA. These results verified the effectiveness of MIC, which contributed to the improvement of stock prediction accuracy.
The performance of the SVM model in predicting stocks was compared with two other machine learning methods: C4.5 [19] and random forest algorithms [20], and the results are shown in Table 3.
Results of feature screening by MIC
The effect of feature selection on the accuracy.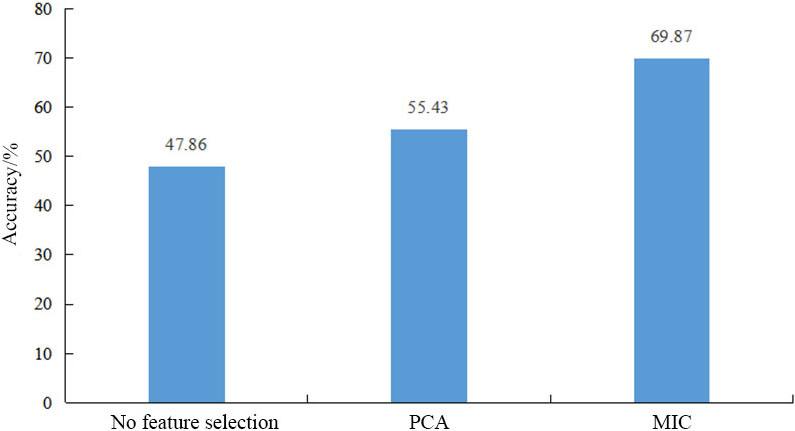
It was seen from Table 3 that the SVM algorithm had the highest precision (0.9883), the random forest algorithm had the highest recall rate (0.9987), the SVM algorithm had the highest accuracy (0.9796), and the F1-score of the SVM algorithm was 0.9884, which was 0.0018 higher than the C4.5 algorithm and 0.0015 higher than the random forest algorithm. These results suggested that the SVM algorithm had a good performance in predicting stocks and could predict the change of stocks accurately to establish proper quantitative portfolios and realize the optimization of enterprise asset management.
The quantitative investment portfolio was built using the SVM model. To determine the number of stocks in the portfolio, the annualized return rate under different situations was compared, and the results are shown in Fig. 3.
The effect of the number of stocks on the annualized return rate.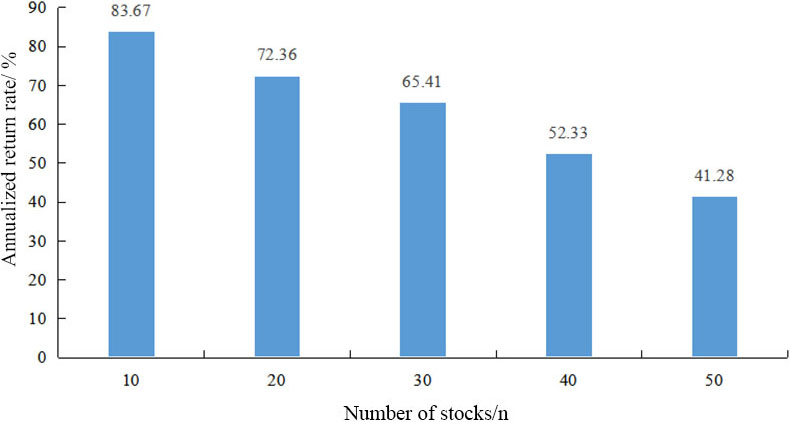
It was seen from Fig. 3 that with the increase of the number of stocks in the quantitative investment portfolio, the annualized return rate of the portfolio decreased gradually; when the number of stocks was 10, the annualized return rate was the highest, 83.67%; when the number of stocks was 20, the annualized return rate dropped by 11.31%; when the number of stocks was 50, the annualized return rate was only 41.28%, which was 42.39% lower than that when the number of stocks was 10. These results demonstrated that the greater the number of stocks was, the stronger the uncertainty was, and the higher the risk was.
Finally, the backtest results of the quantitative portfolio were analyzed. The investment portfolio was built using different models. The asset management data of enterprise A when the number of stocks in the portfolio was 10 are shown in Table 4.
The performance of the SVM algorithm
It was seen from Table 4 that the SVM algorithm had the highest annualized return, 83.67%, which was 26.03% higher than the C4.5 algorithm and 28.11% higher than the random forest algorithm, indicating that the portfolio built based on the prediction results of the SVM algorithm could achieve higher returns. Moreover, the SVM algorithm had the largest
This paper used machine learning algorithms to study quantitative investment in enterprise asset management. The future change of stocks was predicted by the SVM algorithm to build quantitative portfolios, and the algorithm was applied in the asset management of enterprise A. The performance of the algorithm was evaluated and verified through backtest. The experimental results demonstrated that the SVM algorithm had a good performance, with high accuracy and precision, and its F1-score was 0.9884, which was higher than C4.5 and random forest algorithms. The backtest results demonstrated that the portfolio built based on the prediction results of the SVM algorithm for asset management had a good balance of risk and return; the smaller the number of stocks was, the higher the annualized return rate was; when the number of the stocks was 10 in the portfolio, the annualized return rate was 83.67%, the maximum retracement was minimum, 44.32%, and the Sharpe ratio was 1.92, which verified the reliability of the SVM algorithm in quantitative investment. This work can provide scientific guidance for enterprise asset management, and the SVM algorithm can be further promoted and applied in practice.