
Abstract
In order to improve the centralized planning ability of logistics distribution path data, improve the efficiency of logistics distribution and reduce the cost of logistics distribution, this paper proposes an optimal path selection algorithm based on machine vision. Using machine vision technology to calibrate the coordinates of logistics distribution path, combined with EMD decomposition method and wavelet denoising method to remove redundant data in logistics distribution data, particle swarm optimization algorithm to complete logistics distribution path planning, and ant colony algorithm to realize the optimal path selection of logistics distribution. The experimental results show that the average distribution cost of this method is only 766.7 yuan, the distribution time is less than 0.3 h, and the customer satisfaction is as high as 98%, which shows that this method can effectively optimize the distribution path.
Introduction
Logistics distribution is an important link in modern logistics management. It refers to the distribution center in accordance with customer orders for sorting, distribution, where the goods will be prepared within the prescribed time limit to deliver goods to the customer activity, which is an important logistics link directly with consumers [1]. The time, speed and quality of distribution are directly related to the speed, quality and efficiency of electronic commerce [2]. Therefore, it is important for the development of vehicle deployment plans and distribution route plans [3]. With the increase of the number of customers, the number of alternative distribution route schemes will increase exponentially, which leads to the complexity of VRP.
As an important part of logistics system, logistics distribution affects the whole operation process of logistics and the development trend and prospect of transportation enterprises. It is an important research content in the field of logistics and distribution to optimize the logistics and distribution route by scientific and reasonable methods. Traditional logistics refers to the packaging, transportation, loading and unloading, and storage of products after they leave the factory. From the perspective of traditional logistics channels, the business flow is from manufacturers to wholesalers, retailers to consumers. Traditional logistics is a process from manufacturers to storage and transportation enterprises to wholesale and retail enterprises to consumers. China’s traditional logistics was established in the era of planned economic system. It was mainly the storage and transportation enterprises of various countries established by administrative divisions. It adapted to the storage and transportation of goods with “small variety, large batch, small batch and long cycle” at that time. After the reform and opening up, the customer demand of China’s consumer market has changed to multi variety, small batch, multi batch and short cycle. In the traditional logistics, logistics centers and distribution centers have emerged in the logistics field to provide special logistics and distribution services for customers. Also, some scholars have made some achievements in the optimization of the distribution route, but there are still many problems in the specific environment. Some experts and scholars have adopted different methods to solve this problem.
Wang and Jin [4] made use of donkey and smuggler algorithm to establish path model, find out all possible paths, solve suboptimal solution search behavior and path selection, get the adaptability of optimal path, determine the optimal path of logistics vehicle distribution, complete the optimization of logistics vehicle distribution path, improve the efficiency of logistics distribution, and reduce logistics distribution cost. Ge et al. [5] introduced a partial charging strategy, proposed a logistics distribution path optimization problem for electric vehicles with time windows considering partial charging strategy, established an integer programming model for logistics distribution path optimization, and solved the logistics distribution path with hybrid simulated annealing algorithm. Based on Delphi method, a triangular fuzzy number framework is designed by fuzzy analytic hierarchy process [6], and suitable fuzzy numbers are obtained to replace the original fuzzy numbers to calculate the relative weight of the road freight route selection criteria. Chen [7] used cloud computing technology, through the unified access interface to obtain real-time traffic information in the transportation system, the delivery time and cost of cold-chain vehicles are analyzed, and the cold-chain logistics routing optimization method based on big data cloud computing analysis is completed by using genetic algorithm.
Zhao et al. [8] designed an electric vehicle routing problem model for urban fresh and cold chain logistics under time-varying traffic conditions, considering time-varying road network traffic volume, road type, customer time window requirements, freshness of fresh products and queuing during charging, built an electric vehicle routing optimization model, and designed an improved adaptive ant colony algorithm to solve the electric vehicle routing optimization model. This method can effectively improve the effect of distribution route optimization, but the route transportation takes a long time. Xiong [9] proposed a cold chain logistics distribution path optimization method based on ant colony algorithm, which constrains the cold chain logistics distribution path through transportation time factor, transportation cooling factor and average road patency factor, restricts the pheromone of updating the cold chain logistics distribution path, and realizes the optimization of logistics distribution path through the maximum and minimum concentration of pheromone on the road. This method can improve the route transportation time, but the effect of distribution route optimization is poor. Liu [10] proposed a last mile distribution path optimization of rural e-commerce logistics based on ant colony algorithm. Considering the characteristics of long transportation chain and low consumption density, it constructs the path optimization model of the next mile distribution, adapts to the last mile distribution function of recl by modifying the heuristic information, pheromone update rules and the structure of reconciliation, and realizes the solution of the path optimization model by improving the ant colony optimization algorithm. This method can effectively improve the coverage of the recl logistics network, with a wide range of distribution users, but this method has a poor effect on the optimization of distribution routes.
To some extent, these methods can effectively optimize the path of logistics distribution, but the research on green logistics distribution is still insufficient. In order to have a systematic understanding and grasp of the efficiency level of our country’s logistics distribution, it is necessary to make statistics and inductions of the existing results.
Camera calibration based on machine vision technology
Mathematical modeling of logistics distribution
The logistics industry is sensitive to labor costs. The high automation, high efficiency, high accuracy and strong environmental adaptability of machine vision provide a new “power” for the rapid development of the logistics system. Compared with human vision, machine vision has the advantage of long-time continuous work without fatigue, and the accuracy and efficiency of detection are far higher than human vision. Machine vision technology can use infrared, ultraviolet, X-ray and ultrasonic detection technologies to detect objects that cannot be detected by human vision. It has natural advantages in detecting things in high-risk environments and things beyond human visual perception. In recent years, with the rapid development of economic scale and science and technology, the technological iteration of the logistics industry has been significantly accelerated. High and new technologies such as machine vision, robotics and artificial intelligence have been widely applied in the automated logistics system. The logistics industry is rapidly evolving from manual operation to intelligent and automation. At present, the machine vision technology is widely used in the logistics and warehousing logistics links of the production line. In the logistics system, the role and role of the machine vision system mainly include defect detection, OCR and bar code reading, positioning detection, 3D measurement, material classification detection, work movement guidance, etc., and cooperate with other functional devices to complete the logistics tasks.
The logistics and distribution process of e-commerce is mainly divided into three stages. The first stage is the product procurement stage, which means that e-commerce uses vehicles and other transport means to transport products from the origin to the warehouse or logistics center. The scope of logistics activities in the product procurement stage is from the product origin to the e-commerce warehouse or logistics center. The logistics volume of products in the procurement stage is usually large, and point-to-point vehicle transportation is generally adopted. The second stage is the product repacking stage, which refers to the logistics activities of product repacking and packaging by e-commerce according to the customer’s order requirements. The scope of logistics activities in this stage is within the e-commerce warehouse or logistics center. The third stage is the product distribution stage, which means that e-commerce uses ordinary vehicles or refrigerated vehicles to distribute products from e-commerce warehouses or logistics centers to customers according to the actual situation of customers’ demand, time windows, product freshness requirements and traffic network congestion. The distribution activities in this stage mainly occur in cities. The logistics distribution planning of e-commerce must be scientifically planned according to the enterprise objectives and actual conditions, meet the needs of customers, minimize the distribution cost, reduce the fuel consumption and carbon emissions of vehicles, give consideration to environmental protection, and achieve sustainable development.
For multi-objective logistics distribution, it can be described as: N different customer points are known to give different customer needs and coordinates, so that the overall logistics distribution costs are minimized. Each distribution vehicle has the same load and returns to the distribution centre after reaching each distribution point. The selection of the optimal distribution path must meet the following constraints:
(1) The customer’s demands shall not exceed the maximum weight of the vehicle’s load on any road:
Among them,
(2) The total length of distribution shall not exceed the maximum distance of one automobile distribution:
Among them,
(3) Only one vehicle is allowed to pass through each customer site.
Among them,
After meeting the above constraints, we must also meet all the customer points in the distribution to complete the logistics distribution.
Among them,
Therefore, the final objective equation of logistics distribution optimization is as follows:
Image preprocessing generally includes image enhancement, filtering, thinning and image segmentation and binarization of the processing part. In this paper, the logistics distribution path only uses gray-scale images; here, only binary processing is introduced. In order to ensure the consistency and applicability of the image processing algorithm, the collected data of the logistics distribution is restored to the corresponding gray image, and the results will be more credible and usable. The resolution of the grayscale image is 25
After obtaining the gray image, it is necessary to separate the target and background in the image, and binarization is the most common method of image segmentation. Binarization is a special case of thresholding method used to segment gray image. The steps are as follows: Firstly, a threshold
where
Machine vision is an important means of obtaining the external environment [11, 12]. This process requires the camera to capture the outside environment. In order to obtain better quality results, it is necessary to study the principle of the camera, and obtain the parameters of a camera.
First of all, it is necessary to study the imaging model of a camera, which can be divided into linear model like pinhole camera and nonlinear model like ordinary convex camera.
Linear camera imaging model.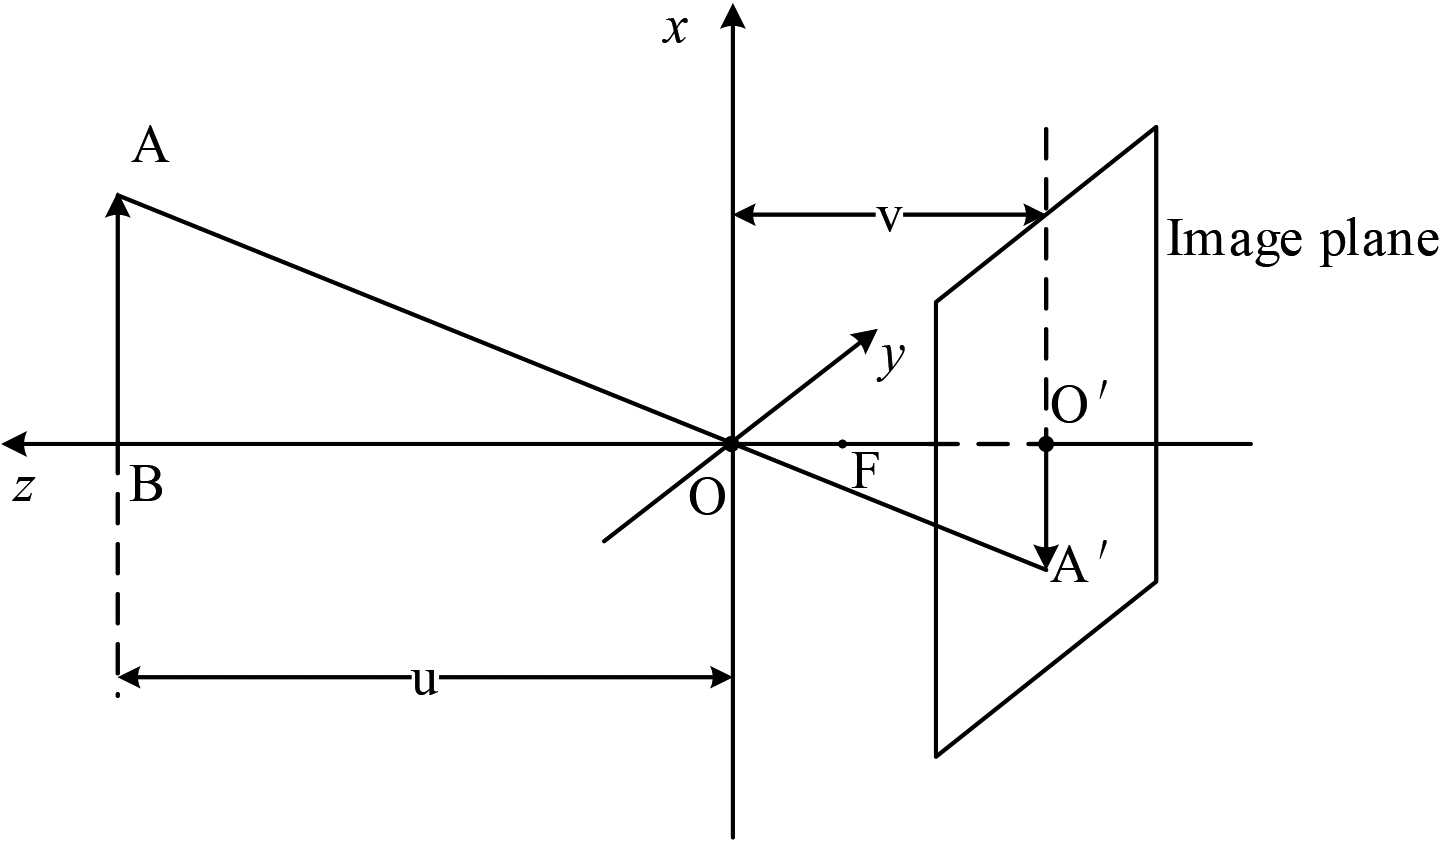
Firstly, the linear model of camera is studied. The
You will get the following after the upwarping:
Set vector
To transform the world coordinate system to the camera coordinate system, first study the translation. Let the coordinates of the origin of the world coordinate system be
To sum up, the formula for the total transformation from point
These are linear camera imaging models, and ideal pinhole cameras are part of this model.
Due to the optical characteristics of the camera lens and the error of lens production, the image taken by the camera will be distorted, so the real projection point of the object deviates from the theoretical projection point, which is the distortion of the camera. Camera distortion is mainly radial distortion and tangential distortion. The Microsoft Kinect 2.0 camera used in this section can meet the experimental accuracy requirements without considering camera distortion [13]. Therefore, this section does not correct camera distortion, but only calibrates the internal parameters of the Kinect 2.0 camera and the coordinate transformation relationship between the Kinect 2.0 camera and the logistic distribution path.
The Kinect 2.0 infrared camera calibration process is similar to the color camera calibration, using the Kinect 2.0 infrared camera on three different checkerboard grid were taken 20 images, a total of three groups. Take 5 of the pictures in each group for example. The checkerboard is shown in Fig. 2.
Camera checkerboard shot.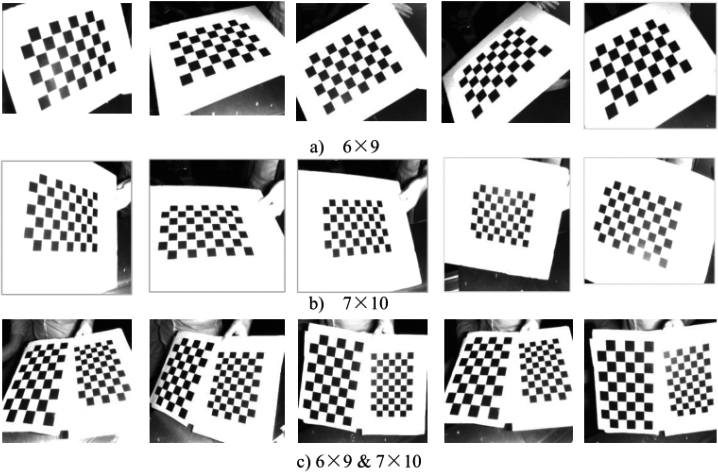
Using GML C
Internal calibration results of infrared camera
The internal parameter matrix KIR of the infrared camera can be obtained according to Table 1:
Denoising logistics distribution path data
Through the combination of EMD decomposition method and wavelet denoising method for flow distribution path data denoising processing [14, 15]. Based on the cumulative mean value index, the low-frequency IMF component and high-frequency IMF component are distinguished, and the corresponding soft or hard threshold function is selected to denoise the path data. The hard threshold function for stream distribution path data denoising is:
The soft threshold function is:
Among them,
Among them,
Through the above process, the whitened data of logistics distribution path can be obtained, which can effectively improve the data denoising performance and simplify the data structure.
Based on the actual situation of the path and personalized needs, the real number coding of the logistics distribution path planning is completed by using the particle position, which makes the coding form more intuitive and easier to decode. Assuming that
The values of position and fitness function are
After a given number of particles
Considering the constraint information such as detour limit, cost limit and so on in the process of intelligent planning, the result of PSO can be effective and practical. The expression in Eq. (20) is the condition expression of fitness function for planning the personalized logistics distribution path:
Among them,
Assuming that the time interval for iterative update is
The fitness function value calculated according to Eq. (21) shall be retained for several ideal particles, and the differential evolution algorithm shall be used to dynamically adjust the mutation probability and scaling factor according to the optimal value of population position, so as to complete the dynamic scaling of the search scope of logistics distribution path, prevent local optimization, improve the search efficiency of path and ensure the diversity of logistics distribution paths. In order to reasonably restrict the movement of particles, the positions and velocities of particles are set to
Among them, the current optimal value of the group location of the
Initialize the starting and ending points of the logistics distribution path (i.e., the random location and speed of the particle population), and the number of variables contained by each particle is equal to the number of dimensions of the search space; Evaluating the fitness function value of each particle, taking the individual demand into account, taking the starting point of the path as the optimal value of the individual particle, comparing the fitness function value of each particle with the optimal value of the population location, and completing the individualized selection of the starting point of the logistics distribution path; The starting point and ending point of the planning of logistics distribution route shall be appropriately adjusted according to the actual road conditions; Evaluating group particles, comparing the target value of particles in the group with the target value of individual particles, and updating the optimal position of individual particles and group particles; When the stopping conditions are set, the optimal value and the target value of the population position are exported; otherwise, the next process is entered; Search the search area for the value of the particle fitness function in the evaluated scaled space and return (3); repeat iterations until the termination conditions are met.
The iteration termination condition mentioned in step (6) is usually set to the maximum number of iterations allowed, or the optimal location to be searched meets the preset minimum adaptation threshold.
Set the target function for each database
Among them:
The concentrations of pheromones on each transition are the same in the initialization phase and are the natural number
In order to ensure the desired results, it is necessary to avoid the attraction of ants in individual short-delay transitions [18]. Therefore, after analyzing the operation law of Petri net, modifying the implementation degree is adopted to avoid the occurrence of ants being attracted.
In formula:
The ant numbers of all
According to Eq. (28), determine the next implementation schedule as follows:
Adjust the pheromone of transition
Next calculation:
Among them, the ratio of pheromone left after evaporation per second is
According to the Eq. (3.3), the sum of the concentration of the newly generated pheromone and the concentration of the remaining pheromone of the logistics distribution path shall be used as the concentration of the pheromone of the adjusted logistics distribution path of
Experimental design
In order to verify the good performance of the optimal selection algorithm of logistics distribution route based on machine vision, a simulation experiment is designed. A total of 13 logistics distribution points shall be set up to deliver goods to 700 customers from 7: 00 AM to 14: 00 AM, and this method (the optimal selection algorithm of logistics distribution route based on machine vision), Donkey and Smuggler Optimization Algorithm and Optimization method considering flexible charging strategy shall be adopted to carry out comparative test on logistics distribution cost, logistics distribution time consumption and customer satisfaction.
Result analysis
Logistics distribution cost
In the experiment, PSO is used to plan the distribution path, set the number of subset nodes to 200, and set the upper limit of iteration to 600. After running the program for 50 times, the optimal distribution path is output. When the departure time is different from 7: 00 to 14: 00, the planning path of the three groups of experiments is also changed. Comparing the distribution cost of the distribution path, the comparison result is shown in Table 2.
Distribution cost comparison results/yuan
Distribution cost comparison results/yuan
From the results shown in Table 2, we can see that the delivery cost of all three sets of experiments is the lowest, which reduces the cost of wasting goods, the opportunity cost of arriving early, and the fine paid to customers after arriving. The average delivery cost of this method is 766.7 yuan, but the average delivery cost of Donkey and Smuggler Optimization Algorithm and Optimization method considering flexible charging strategy is 895.0 yuan and 908.3 yuan, respectively, compared with the experimental Donkey and Smuggler Optimization Algorithm and Optimization method considering flexible charging strategy, the cost of this method is 128.3 yuan and 141.6 yuan, respectively.
Set 9: 00 as the departure time of the logistics distribution car, so that the distribution time is closer to the customer time window. The time reliability of the three methods is compared, and the experimental results are shown in Fig. 3.
Comparison of temporal reliability.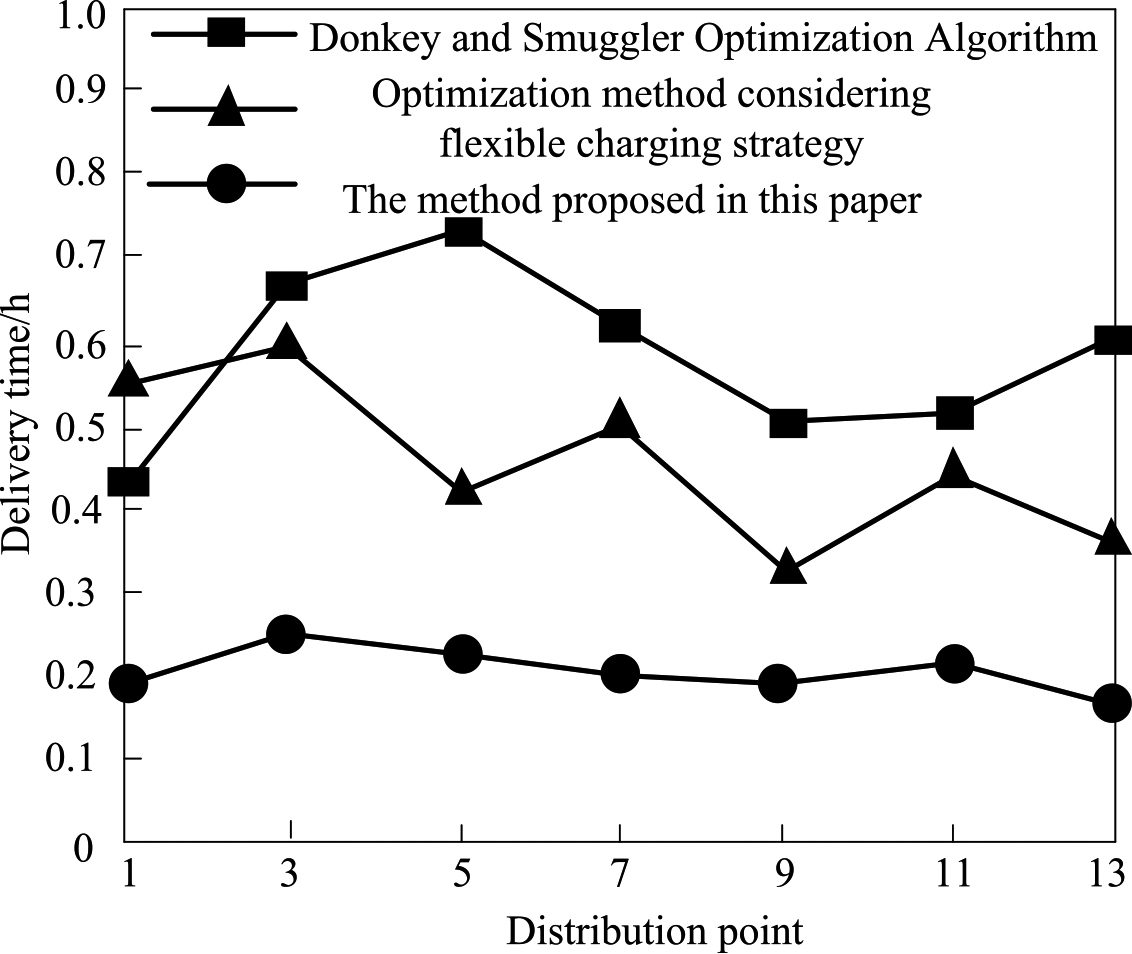
From the results shown in Fig. 3, it can be seen that the proposed method is more reliable for the distribution points with different coordinates, and the delivery time is less than 0.3 h, which is obviously higher than the Donkey and Smuggler Optimization Algorithm and Optimization method considering flexible charging strategy. Under the same distribution quantity, this method can accomplish the distribution quantity of 600 customers in a shorter time.
Based on the time-consuming experiment of logistics and distribution, the goods demand of 700 customers in different distribution places is counted, and the customer satisfaction under the planning of logistics and distribution route of text method and Donkey and Smuggler Optimization Algorithm and Optimization method considering flexible charging strategy is compared. The comparison result is shown in Fig. 4.
Comparative results of customer satisfaction.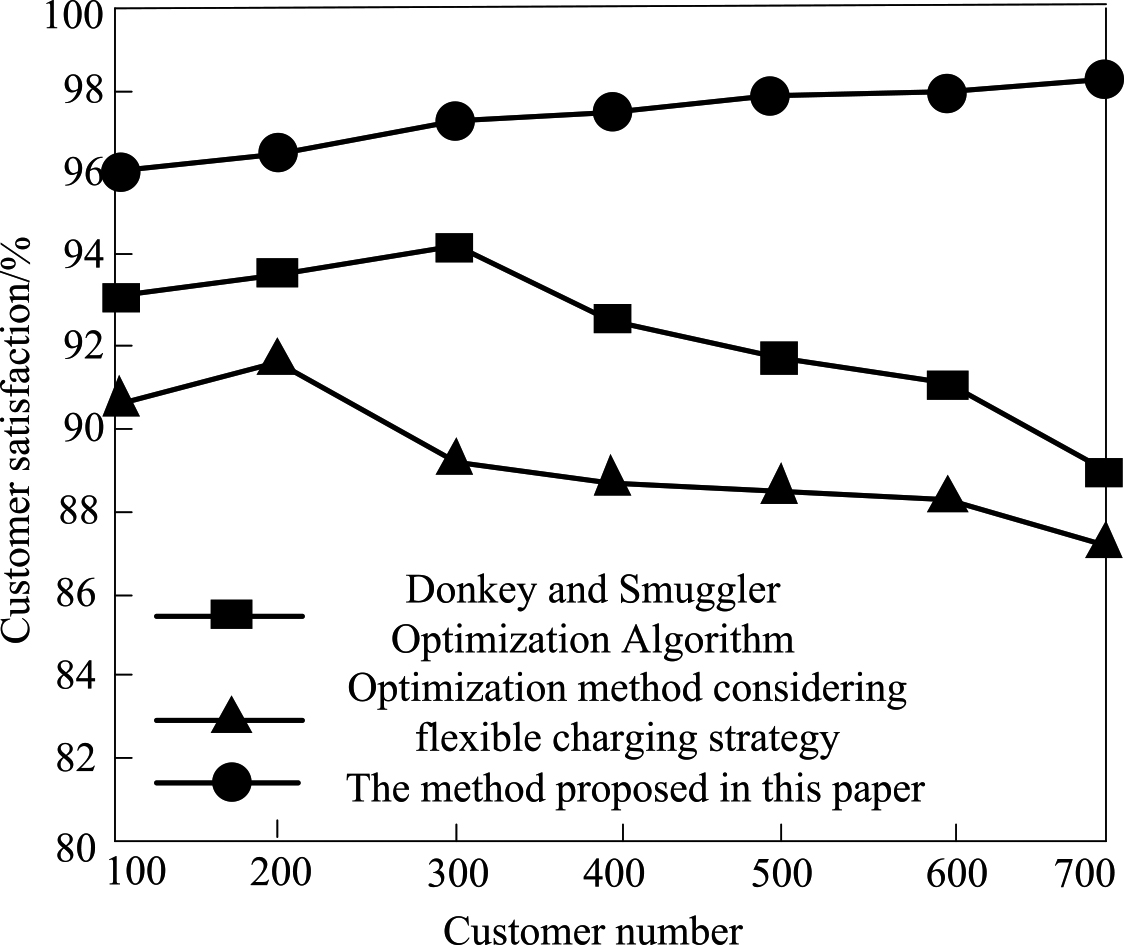
As can be seen from Fig. 4, with the increase of the number of customers, the method of this paper maintains a steady rising trend of customer satisfaction, after the completion of the cargo transportation of 700 customers, customer satisfaction is 98%, and the customer satisfaction of Donkey and Smuggler Optimization Algorithm and Optimization method considering flexible charging strategy decreases with the increase of the number of customers, 91% and 89% respectively.
In order to solve the centralized planning problem of distribution route, an optimal selection algorithm of distribution route based on machine vision is proposed. Through constructing mathematical model preprocessing and edge detection image of logistics distribution, using machine vision technology to demarcate the coordinates of logistics distribution path, complete the logistics distribution path planning, and achieve the optimal path selection of logistics distribution. In order to verify the effectiveness of the proposed method, simulation experiments are designed. The results show that the cost and time of the proposed method are ideal and the customer satisfaction is high.
In order to solve the problem of centralized planning of distribution routes, an optimal selection algorithm of distribution routes based on machine vision is proposed. By constructing the mathematical model of logistics distribution, preprocessing and edge detection image, using machine vision technology to calibrate the coordinates of logistics distribution path, completing logistics distribution path planning, and realizing the optimal path selection of logistics distribution. The following conclusions are drawn through experiments:
In the three groups of experiments, the delivery cost of this method is the lowest, and the average delivery cost is only 766.7 yuan, which reduces the cost of wasted goods, the opportunity cost of arriving in advance, and the penalty paid to customers after arrival. The delivery time of this method is less than 0.3 h. Under the same distribution volume, this method can complete the distribution volume of 600 customers in a relatively short time, which shows that this method has a high effect of distribution path optimization. After completing the cargo transportation of 700 customers, the customer satisfaction of this method is 98%, which shows that this method can effectively realize the optimization of distribution route.
Although this method can improve the delivery effect of goods, the implementation process of this method is more complex, and then we need to further optimize the distribution path optimization algorithm process.