
Abstract
The safe operation of bridges is a major issue related to the national economy and people’s livelihood. With the rapid development of the water transport industry, the problems of ship yaw and bridge collision avoidance occur frequently, which cause serious harm to the bridge structure and safety. However, the current bridge health monitoring system is difficult to feed back the monitored information in time, and in the process of collecting information by wireless sensors, information errors or missing problems easily occur, which hinders the normal monitoring of bridge health. With the rapid development of the Internet and the gradual maturity of wireless sensor technology, how to achieve complete and effective collection and feedback of monitoring information has become a hot research topic and an urgent problem. Therefore, on the basis of Internet technology, this study perceives, collects and processes the ship information in the bridge monitoring area covered by the network through the wireless sensor network, uses the embedded wavelet neural network model to denoise the monitoring data, and finally transmits it to the data processing center, thus establishing a centralized remote real-time Long-span bridge health monitoring system based on the Internet. The experimental results show that the monitoring deformation displacement curve based on the Internet centralized remote real-time long-span bridge health monitoring system technology presents a stable fluctuation state. The cumulative shape variable fluctuates in the range of
Keywords
Introduction
The bridge is an important facility in the transportation construction of various countries. It is the backbone transportation road connecting the two sides of the water area. It plays an important role in the development of the national transportation economy and provides a good development environment for the improvement of the transportation logistics system [1]. During the construction of long-span bridges, some foundations will be replaced. The use of powder injection piles to reinforce the soft foundation has become a common means of strengthening the soft foundation [2]. However, during the construction of the bridge, such soft subgrade will have a certain settlement [3]. During the operation period after the completion of the bridge, it will also have a certain settlement due to the load weight. When the soft foundation Subgrade in the transition section settles, certain deformation will occur for the bridge, and there are certain potential safety hazards for vehicles and pedestrians passing through the bridge [4]. According to the project approval and construction of the current bridge project, there are more and more bridges with a span greater than 150 m, so many long-span bridge buildings have been built. In order to ensure the engineering life and traffic safety, it is very necessary to monitor the health of long-span bridges.
Relevant scholars have conducted in-depth research on this. Ahmad and Khan [5] proposed to design a bridge health monitoring system based on an electromagnetic energy collector with two degrees of freedom vibration. An electromagnetic energy collector is introduced to extract the low-frequency and low acceleration vibration energy available in the bridge environment. The developed harvester is a multi-mode oscillator with dual electromagnetic conversion mechanism. The harvester is composed of two cantilever beams. The open circuit voltage of the mathematical model is simulated in MATLAB, and the simulation results are in good agreement with the experimental values. Moallemi et al. [6] proposed Scalable Distributed Real-time Anomaly Detection for bridge health monitoring. Modern real-time structural health monitoring system can generate a large amount of information, which must be processed and evaluated to detect early anomalies and generate timely warnings and alerts about civil infrastructure conditions. The actual case study shows that the combination of near sensor computing, intelligent preprocessing and low-power WAN protocol of anomaly detection algorithm can greatly reduce the cost of data communication and cloud computing, and will not adversely affect the accuracy of anomaly detection. Xiao et al. [7] proposed a bridge health monitoring data prediction model based on LSTM neural network, and discussed the modeling process of LSTM neural network model. The LSTM neural network model is used to analyze the actual data of the bridge. The results show that the prediction accuracy of LSTM model is high. Therefore, LSTM neural network can be used for data analysis and prediction of bridge monitoring system. In order to evaluate the practicability of the newly developed bus monitoring system, Miyamoto et al. [8] conducted a field test for about four years by using an in-service fixed route bus running on the bus route in Yubu City, Yamaguchi Prefecture, Japan. The results show that the sensitivity of “characteristic deflection” can be verified by introducing artificial damage to the bridges that have finished their service life and are waiting to be demolished. The research results will help to establish a reasonable long-term health monitoring system for medium and short span bridges and help bridge managers to formulate reasonable maintenance strategies.
To sum up, most researchers have proposed methods for monitoring the health of bridges, effectively monitoring the abnormal conditions of bridges to a certain extent, and feedback the collected data to carry out prediction. However, there are three main problems as follows: first, the system cost is high, leading to the lack of long-term health monitoring system for most bridges; Second, a small number of health monitoring systems may not operate in real time due to high maintenance costs, resulting in incomplete data of the health monitoring system, which can not effectively diagnose the health of the bridge; Third, many construction monitoring systems are not perfect and intelligent enough to be transformed into long-term health monitoring systems, resulting in a certain degree of waste. The remote control under the Internet can reduce the cost of time, traffic and manpower, realize real-time control and monitoring, and greatly improve the timeliness and efficiency of work. Therefore, on the basis of Internet technology, a remote long-span bridge health monitoring system is proposed to improve the timeliness and accuracy of bridge health monitoring.
Internet centralized remote real-time long-span bridge health monitoring system
Overall system design
The basic connotation of bridge health monitoring is to provide early warning signals for bridges under special climate, traffic conditions or abnormal severe bridge operation conditions through monitoring and evaluation of bridge structure conditions, and provide basis and guidance for bridge maintenance and management decisions. However, the health monitoring of bridge structure is not only for the monitoring and evaluation of structural state, but also for the feedback of information to structural design. The more profound significance is that the structural design methods and corresponding codes and standards may be improved. Moreover, the bridge health monitoring not only brings about the monitoring system and reflection on a specific bridge design, but also may and should become the “field laboratory” of bridge research. Bridge health monitoring provides a new opportunity for the research of unknown problems in bridge engineering and super long-span bridges. The information obtained from the bridge structure and its environment in operation is not only a supplement to theoretical research and laboratory investigation, but also provides the truest information about the structural behavior and environmental laws. The overall design of the Internet centralized remote real-time long-span bridge health monitoring system consists of two parts: hardware and software, which are designed with industrial cameras, ship speed sensors, network nodes and development boards. The monitoring radar is jy-50 fully coherent Doppler moving target monitoring radar [9, 10]. The system workstation mainly realizes its functions through water level monitoring module, ship superelevation detection module, hull detection module and bridge lighting module.
The system is generally networked through the communication feature technology, and cooperates with the system through two sets of JY-50 radars, covering an all-round range of 5000 m upstream and downstream around the water area near the bridge, to complete the Internet centralized remote real-time long-span bridge health monitoring. The overall structure of the specific system is shown in Fig. 1.
Overall structure of Internet centralized remote real-time long-span bridge health monitoring system.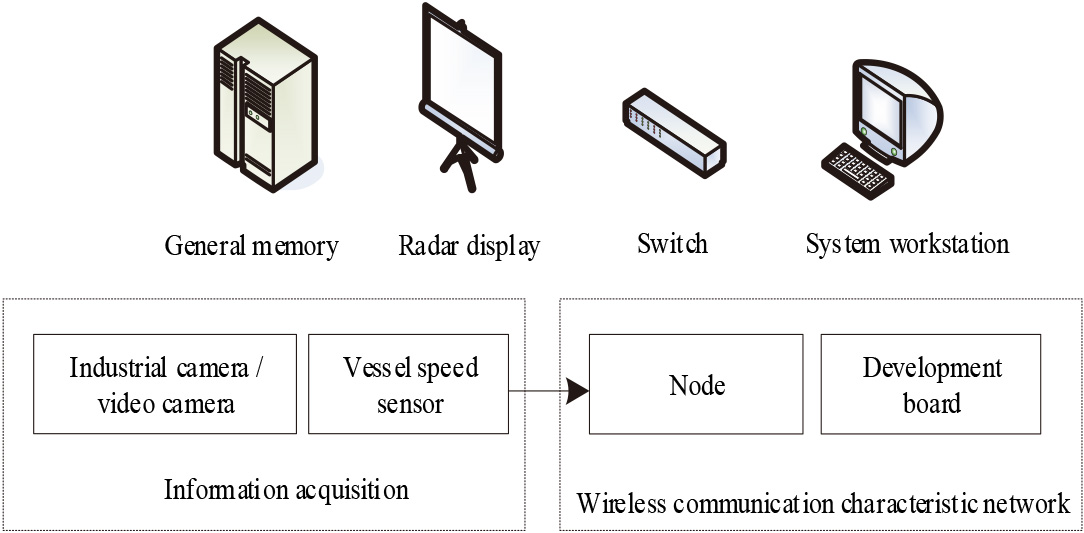
System hardware module composition
Complete the hardware design of the Internet centralized remote real-time long-span bridge health monitoring system through the following hardware design drawings. The wireless communication feature network module is composed of communication RF signals. According to the RF signals of collected information transmitted by the wireless communication feature network module, the system workstation completes the system work through the water level monitoring module, ship superelevation detection module, hull detection module and bridge lighting module.
System hardware composition.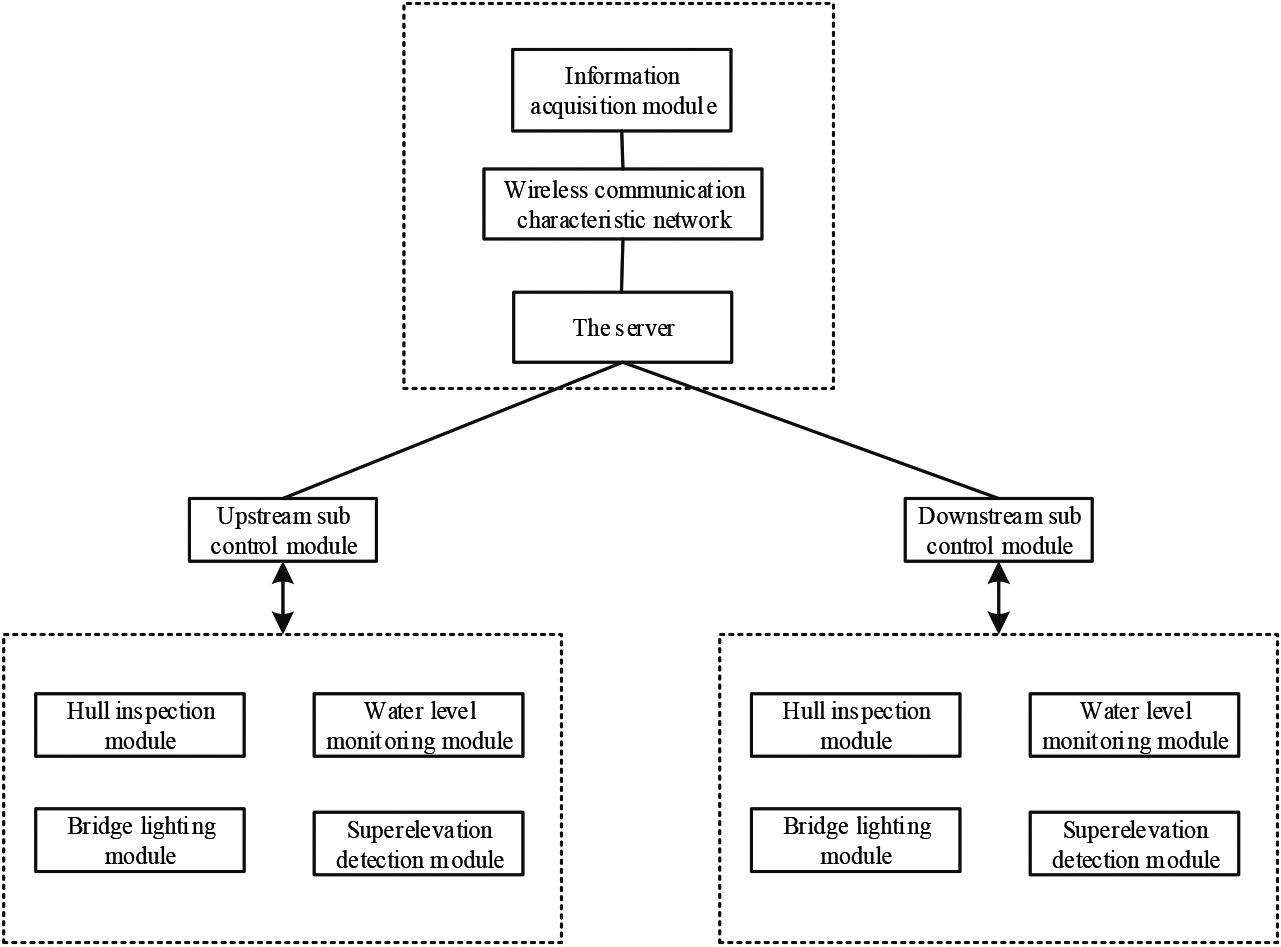
(1) Water level monitoring module
The water level sensor is installed to monitor the water level change in real time, record the water level change, and send the water level status to the server in real time [11]. A water level detection device is designed for water level monitoring, which uses single-chip microcomputer as the core controller. The arm is connected to the WDT (remote data transmission terminal), and the detected data is transmitted by the WDT to the wireless gateway (operator) through the GPRS/CDMA network. The data is sent to WSG (wireless gateway) through the Internet network, and the data is sent to DSC (Data Service Center) after passing through WSG. In this way, the detected water level information can be transmitted to the upper computer for storage and processing, so as to realize the real-time monitoring of water level, as shown in Fig. 3.
Water level monitoring module.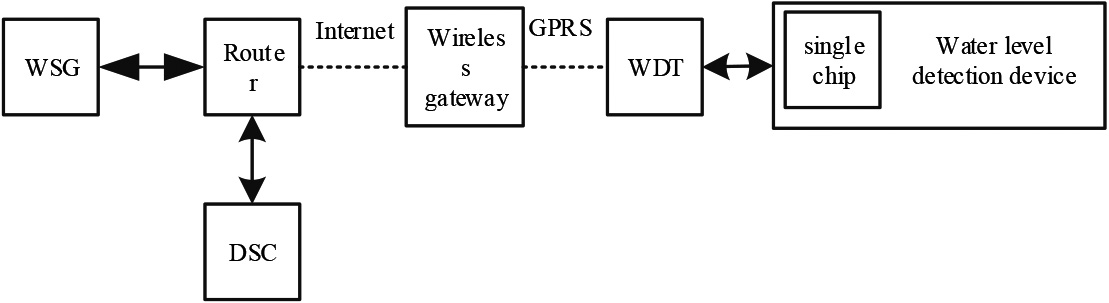
(2) Superelevation detection module
Through the thermal imaging camera, the temperature difference around the bridge is monitored and transmitted in the form of thermal profile image. A set of thermal imaging superelevation detection unit is set at the upstream and downstream bridgeheads. They are installed at the position of the pier, the height is consistent with the warning height of the bridge body, the channel is observed horizontally, and the angle of view of the thermal imaging superelevation detection unit is arranged in a fork shape. The use of the thermal imaging camera and the image recognition algorithm can realize the superelevation detection of ships in the river all day, as shown in Fig. 4.
Superelevation detection module.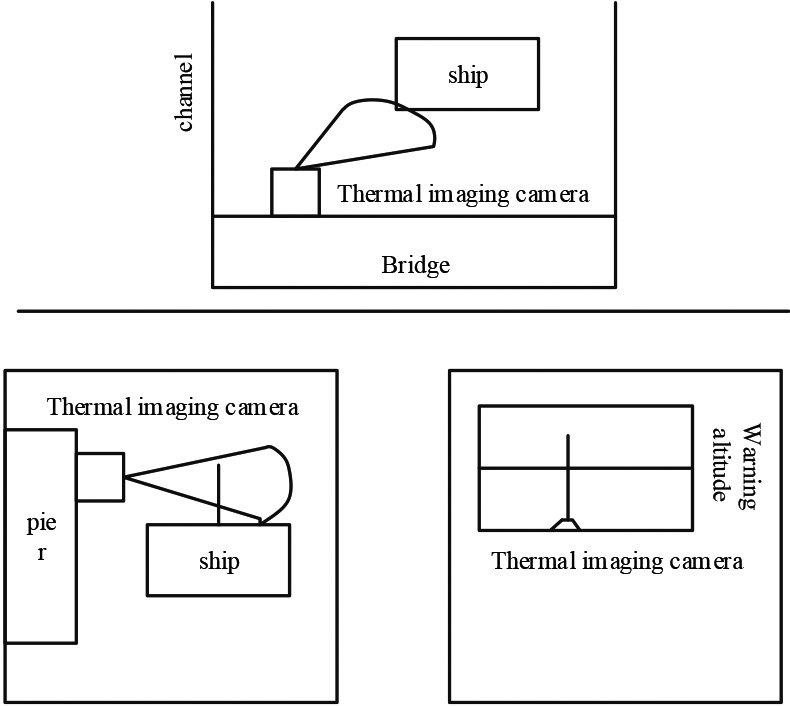
(3) Bridge lighting module
Place the LED lighting lamp group on the top of the bridge. If there is a ship in the area, the lighting control module controls the light group for lighting. If the ship leaves the area, the light will be turned off.
(4) Hull inspection module
The network processing terminal, hull sensor, MV-EM120C industrial camera and Xbee PRO900HP network transmission node are connected through USB data cable and network cable to form a hull detection module, which is placed near the driver’s seat of the ship and cooperates with the wireless communication feature network module to detect the hull target.
According to the functions of different modules, the corresponding hardware devices are placed in each area of the long-span bridge to successively detect the position, status, height and other data of the passing ships. If the ships are detected to be yaw or close to the bridge, the early warning signal is transmitted to the server through the wireless communication feature network, and the ship shooting and video equipment is turned on to collect the violations of the passing ships, and the collected images are sent to the system, Through the monitoring equipment, the administrator can obtain the navigation status of vessels in the channel in real time [12, 13].
In order to collect the relative speed of ships, this paper builds a wireless communication feature network to obtain the speed information. Through the communication feature analysis, the relative speed of ships traveling in the same river can be obtained in time.
The construction of wireless communication characteristic network mainly includes two steps: embedded development of single chip microcomputer and construction of network. The specific operation process is as follows:
Generally, electromagnetic interference, traveling speed and other impacts will occur during the navigation of ships, resulting in unstable captured network signals and increased packet loss rate. Therefore, this paper constructs a wireless communication feature network, which is applied to the 900 MHz frequency band, and can effectively improve the acceptability of signal transmission compared with other equipment. In the process of network construction, the main basis is to establish wireless communication characteristic standards, including baud rate, channel mask, LAN address and other data. In this system, the network requirements are established.
After setting the communication standard, associate the node with the node through the MAC address of the node, collect 32 bits of high and low in the 64 bit address of the node, set the MAC information transmitted by node B as 32 bits of high and low sent by the MAC address of point A, and set the information of node A to be saved to node B. when the operation is completed, send the RF signals of the two nodes to the corresponding address to complete the process of building the network.
System software design
System software flow
The software part of this system is mainly composed of embedded software and main program. In the main program, MFC architecture is adopted to continuously train the files through the source file correlation function to realize the detection of real-time hull detector, and complete the hull distance detection and hull approach early warning according to the images collected by the radar. First of all, the designed software program will initialize the collected images, including grayscale, simple binarization and so on. Then analyze the collected image data, and mobilize the ship inspection system to operate. After obtaining the complete ship network information, decide whether to give early warning according to the safety data preset in the program, and finally end the information transmission. The specific software work steps are shown in Fig. 5.
Software program flow chart.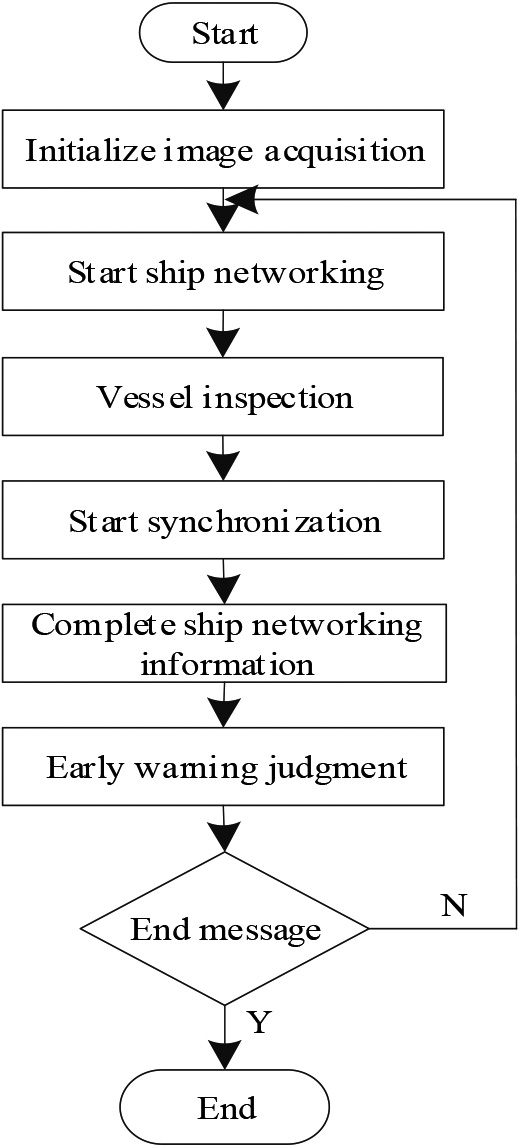
The monitoring process of the system in this paper is mainly completed by dividing the monitoring area in advance. If the radar finds the ship sailing, the system monitors the passing ships in real time, analyzes the longitude and latitude, speed, distance and various characteristics of the ship position, and sends out monitoring through the system according to the ship position and ship situation within the monitoring range [14]. If the ship is captured by radar during its traveling, the navigation status of the ship will be tracked in real time. If the ship sails to the monitoring range, the system will analyze the future risk level according to the navigation conditions of the ship and send out monitoring in time.
According to the actual situation of long-span bridges, three alarm ranges are set in the bridge, namely, emergency alarm, monitoring and alarm, and monitoring is realized through one-way form.
(1) Monitoring location
The monitoring parameters are set as the sailing speed and the volume of the ship. When there are large ships with fast speed in the area 100–2000 m away from the bridge, the system starts monitoring, sends a suspected danger signal, sends a monitoring message to the monitoring administrator, sends visibility, hydrological information and other data through VHF, and captures the danger signal in real time through intelligent cameras.
(2) Alarm position
The main parameter for setting the alarm position is the running speed of the ship. When there is a fast ship within 500–500 m from the bridge, the system will start the alarm, send out a confirmed danger signal, warn by the staff in the control room, and capture the danger signal in real time through the intelligent camera.
(3) Emergency alarm position
Set the parameters of the emergency alarm as the heading and the speed of the ship. When there is a yaw or fast-moving ship within 500 m from the bridge, the system will start the emergency alarm, send out an emergency danger signal, guide the personnel in the control room to use the loudspeaker to shout in real time, and track the signal in real time through the intelligent camera.
Internet centralized remote real-time monitoring
Design the structure of IOT monitoring equipment
For the health monitoring of long-span bridges in the Internet of things environment, image based on-line monitoring can monitor the complex and changeable soft subgrade, get the observation data and find its settlement deformation. For bridge engineering, the key to health monitoring is the settlement deformation on the subgrade section. However, in long-span bridge engineering, the construction monitoring conditions of subgrade soft foundation are poor. Therefore, in the monitoring process, the monitoring equipment under the Internet centralized remote real-time monitoring environment should be designed first. The measurement diagram of monitoring equipment is shown in Fig. 6.
Measurement diagram of monitoring equipment in Internet centralized remote real-time monitoring environment.
In Fig. 6, it mainly includes the settlement deformation monitoring terminal and monitoring center of the long-span bridge. In the monitoring terminal, the main auxiliary devices include storage battery, inclination sensor, etc., the embedded systems such as digital signal processor can complete data storage and spot image acquisition. It has a good monitoring effect on the center positioning of the spot. In this monitoring device, GPRS is mainly used for communication. The monitoring center is mainly composed of alarm device, image data processing and control center. The settlement is calculated by correcting the position and orientation of the target surface, and the noise in the data is eliminated. During the monitoring process, the laser in Fig. 6 is placed on the soft foundation subgrade of the bridge project, and the laser emitted from the laser irradiates the target surface to form a spot. When the soft foundation subgrade is deformed or subsided, the position of the laser will change, and the spot will shift accordingly.
Health monitoring terminals are placed on both sides along the direction of the bridge, and both sides of the soft foundation Subgrade of the bridge in front of the projection target are installed in front of them. So far, the structure design of the centralized remote real-time monitoring equipment of the Internet of things has been completed.
As the environment for health monitoring is poor and generally outdoors, it will be disturbed by natural conditions, resulting in a lot of noise data in the obtained settlement observation data. Although these noise data have little impact on the overall monitoring results, they will cause some trouble to the staff when studying the settlement law. Therefore, in the health monitoring method in this paper, it is necessary to process the data and denoise the health monitoring data. The threshold denoising method is mainly used. This nonlinear denoising method is more suitable for the situation that white noise is mixed in the health monitoring data center. This method mainly sets a threshold as the threshold, treats the data below the threshold as noise, and sets its wavelet coefficient to 0, so as to achieve the purpose of denoising. The wavelet decomposition and reconstruction denoising method is simple and fast. It is most suitable for the denoising of deterministic noise with the separation of signal and noise bands. Moreover, when there are multiple singular points in the signal, the modulus maximum method of wavelet transform has good denoising performance. The wavelet neural network model used is an embedded model, which takes the BP neural network model as the origin and the wavelet transform function as the precondition. The prediction model is divided into input layer, hidden layer and output layer. Among them, the input values are x1, x2 … xn, and the output values are y1, y2 … ym. The network weights are respectively
Embedded wavelet neural network model.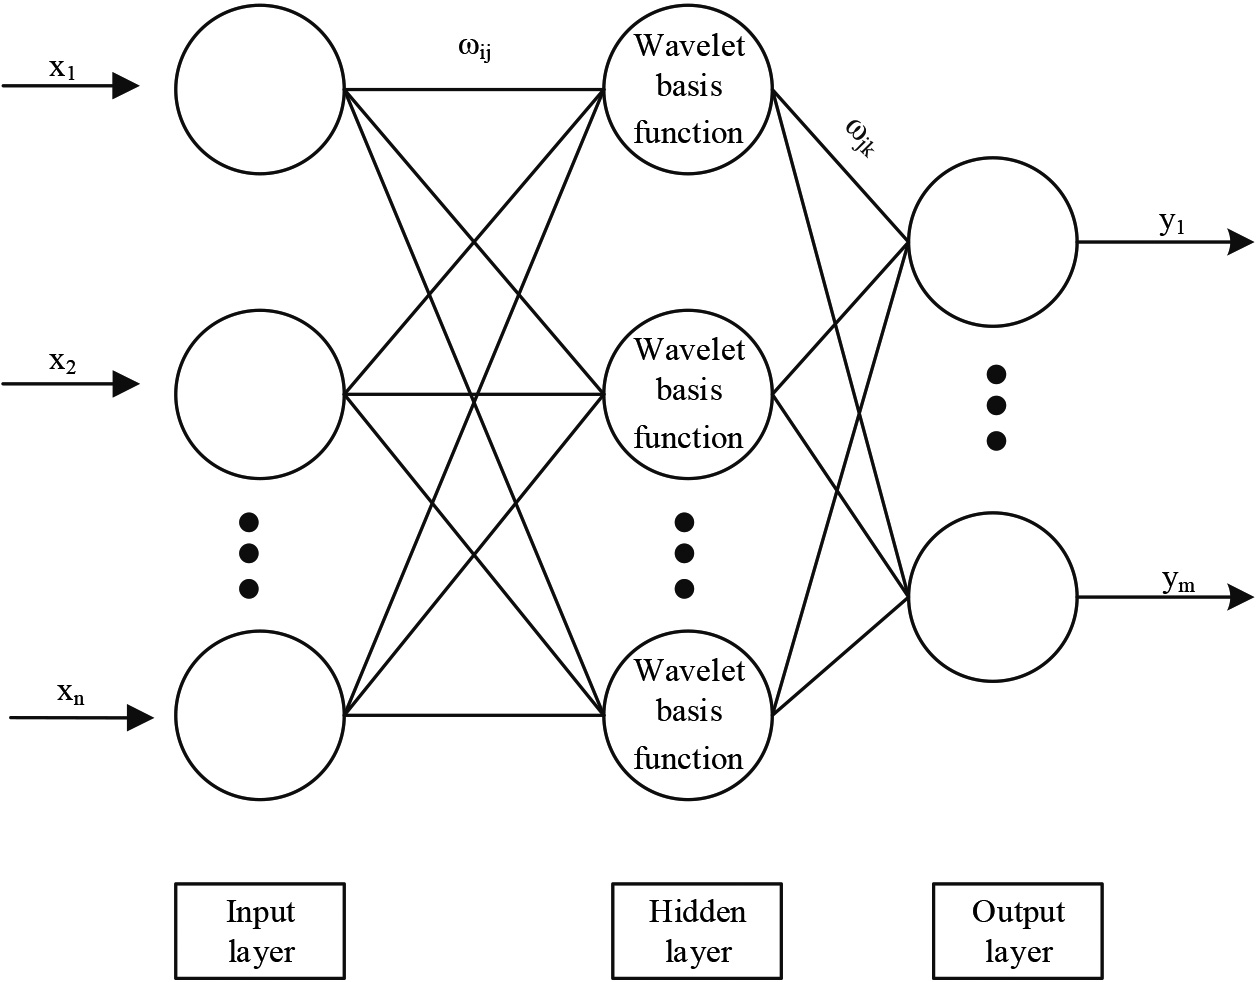
According to Fig. 7, this embedded wavelet neural network is a network model that embeds wavelet transform and artificial neural network. Wavelet function, scale factor and translation factor are used to replace the activation function, weight and threshold in the traditional artificial neural network [15]. Assuming that the sample form in health monitoring is
In Eq. (1), the high-dimensional variable weight vector is represented by
In Eq. (2),
In Eq. (3),
In Eq. (4),
In the process of building the embedded wavelet neural network model of long-span bridge, the modeling work is divided into two steps: component parametric transformation and component assembly. The specific modeling process is shown in Fig. 8.
Flow chart of health monitoring for long-span bridges.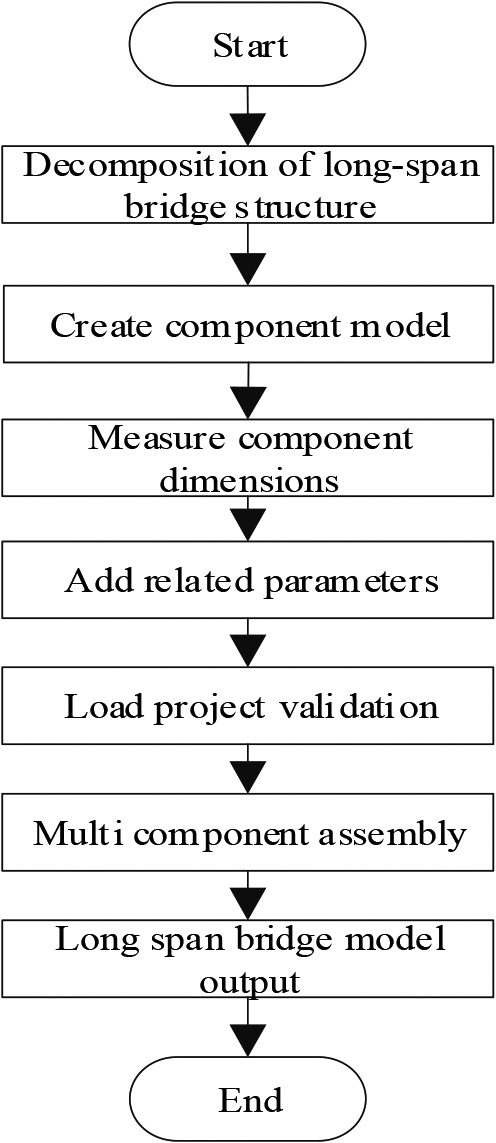
According to Fig. 8, the parametric transformation of components refers to the relationship between objects and objects. The attributes of objects are changed through numerical values, formulas, logic languages, etc., so that the variability of objects can be controlled. The generation and modification of models and the reuse of components can be greatly accelerated through the parametric model. A key issue in bridge health monitoring is the sensor location. The sensor location of the bridge health monitoring proposed in the study is shown in Fig. 9.
Bridge real map and sensor location.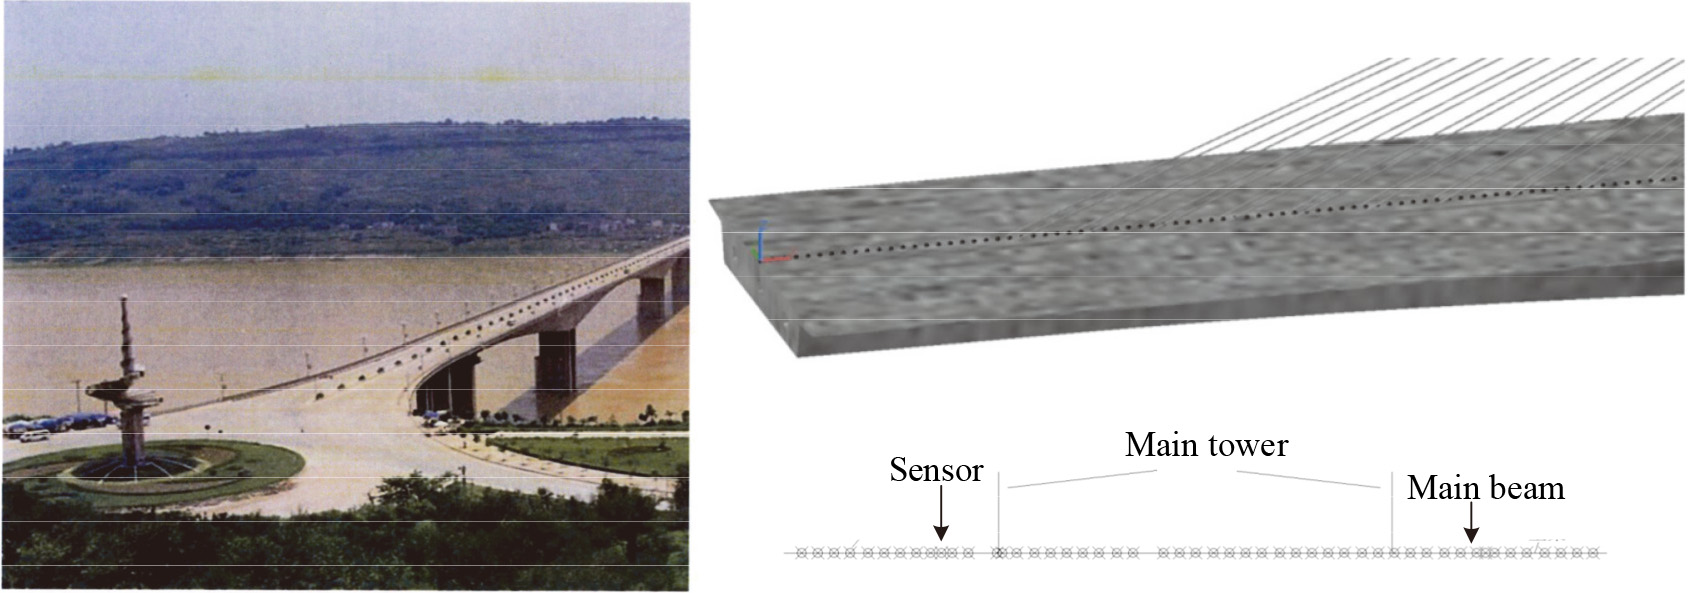
In order to verify the effect and feasibility of the Internet-based centralized remote real-time long-span bridge health monitoring system technology, a river crossing bridge project is selected as the experimental object. All the engineering data of the engineering building are imported into the finite element software to obtain the corresponding three-dimensional model, thereby obtaining the experimental environment of the three-dimensional simulation experiment, and the finite element software used is COMSOL Multiphysics. The selected bridge project includes 156 bridge pile foundations, with a total span of 2000 m and a deck width of 40 m. During the bridge operation of the river crossing bridge project, the tilt camera is used for photographing and monitoring at the normal visual observation position, and the infrared thermal imager is used as the photographing instrument. A total of 4 cameras are set up, taking the southeast corner, northeast corner, northwest corner and southwest corner of the arch rib pier inside the bridge as the reference points, and the distance between the 4 cameras is the same. A signal sensor is placed at the center of the four point mapping on the ground to receive the information data monitored by the camera. The measured data comes from the relational database management system. The database contains a large amount of geological and architectural information, with wide coverage and strong information reliability, which ensures the real-time and synchronization of the data transmission of the four cameras. The schematic diagram of the bridge is shown in Fig. 10.
Based on the three-dimensional constitutive model of long-span bridge pile foundation and its environmental model, the model parameters are set as shown in Table 1.
Parameter settings adopted by the model
Parameter settings adopted by the model
Schematic diagram of highway bridge in simulation experiment.
In order to facilitate the test and data management of the simulation experiment, the tilt camera is used to monitor the data at the southeast corner, northeast corner, northwest corner and southwest corner, and the southeast position is selected for comparative test, which is compared with the Reference [5] system and the Reference [6] system to accurately and reasonably determine the effectiveness of the system for long-span bridge health monitoring. The specific comparison method is to monitor the data in the southeast direction through the tilt camera, monitor the accumulated shape variables of the bridge through three methods within 50 minutes, and compare the monitoring results of the three algorithms with the actual measurement results. The simulation experiment results are shown in Fig. 11.
Comparison of health monitoring results of long-span bridges under different methods.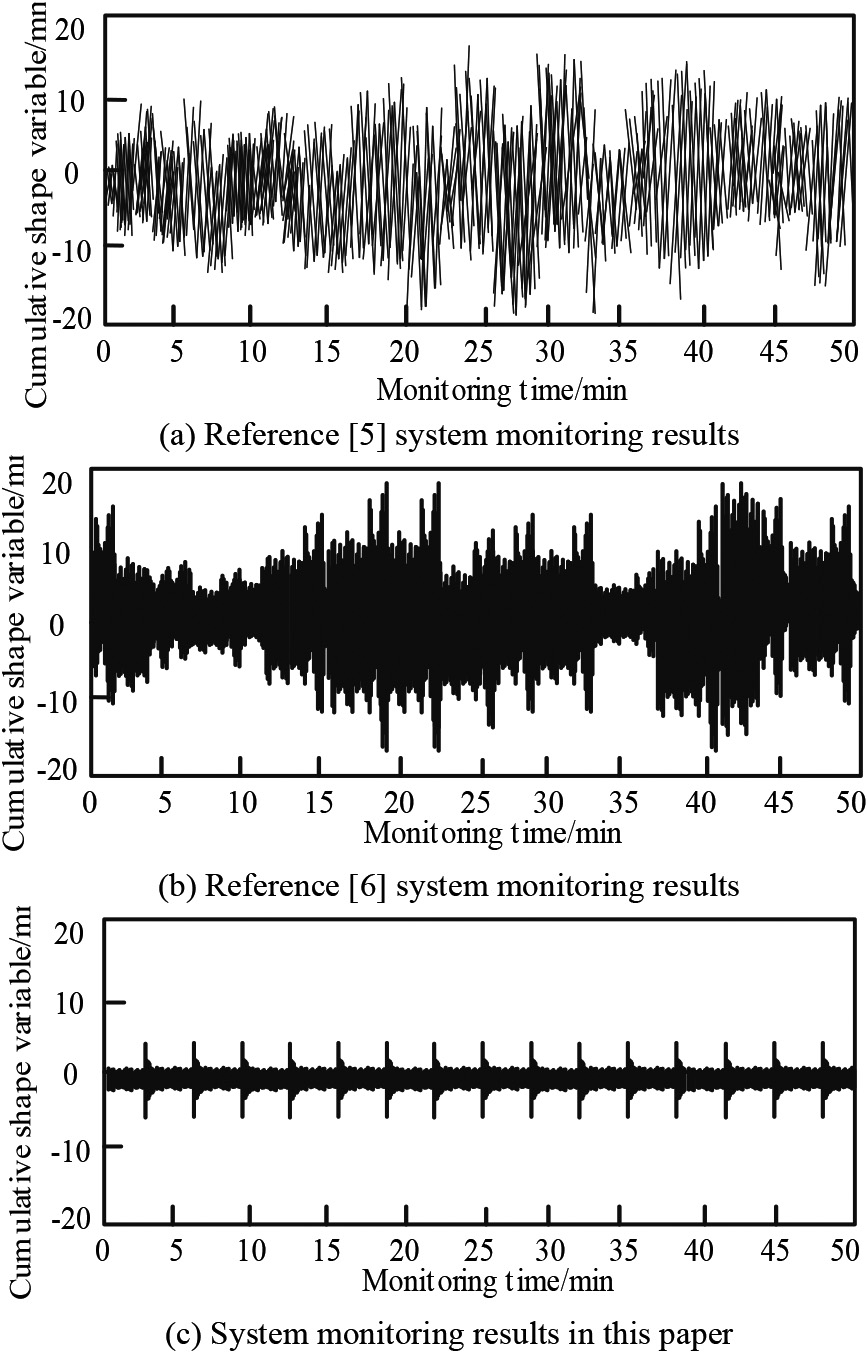
It can be seen from Fig. 11 that under the system of Reference [5], the health monitoring curve of long-span bridges changes greatly, the cumulative shape variable fluctuates within the range of
For the design purpose of wind stability monitoring of long-span bridges, performance tests are carried out from two aspects: monitoring accuracy and monitoring timeliness. The monitoring errors of wind-induced vibration amplitude
In Eq. (5),
In Eq. (6),
Set the static wind, dynamic wind and natural wind respectively, read the output results of the monitoring system and compare them with the set data to obtain the test results reflecting the accuracy performance of technical monitoring, as shown in Table 2.
Monitoring accuracy performance test results
By substituting the standard data of the monitoring accuracy performance parameters set in Table 2 into Eq. (5), and combining the three experimental environments, it can be concluded that the four monitoring indicators of the output vibration amplitude, frequency, wind speed and wind pressure of the design monitoring technology are not significantly different from the monitoring error of the standard data of the monitoring accuracy performance parameters set, which shows that the design monitoring system has good accuracy. Extract the background data of the monitoring technology operation degree, and obtain the timeliness test results of the monitoring system through the calculation of Eq. (6), as shown in Fig. 12.
Timeliness test results of monitoring system.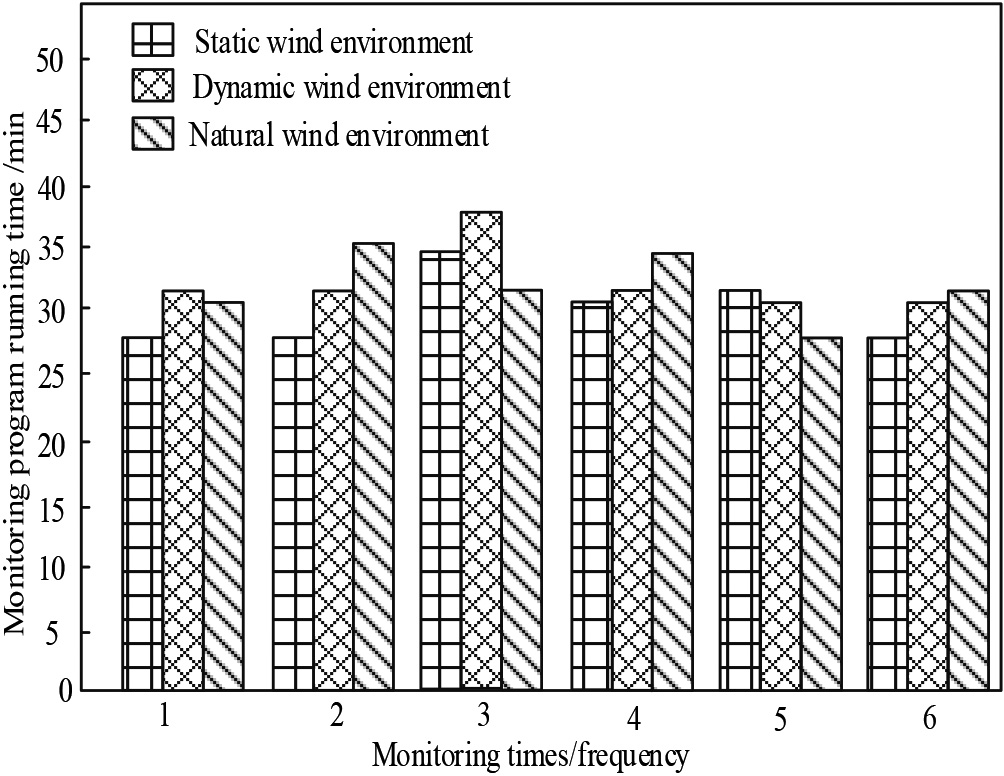
In Fig. 12, the abscissa is the number of monitoring times, and the ordinate is the time of monitoring operation. The unit is minute. It can be seen from Fig. 11 that the running time of the designed monitoring is always less than 60 min under the three experimental environments, and there is little difference in the monitoring timeliness under the static wind, dynamic wind and natural wind environment. The designed system has good timeliness.
In order to further verify the reliability of the Internet-based centralized remote real-time long-span bridge health monitoring system technology, Reference [5] system and Reference [6] system are set as the experimental comparison system method, and the stability coefficients of different bridge pile foundations are set through the simulation program. The three system methods are substituted into the simulation experiment environment, and the stability analysis results obtained are compared with the setting data to obtain the experimental comparison results of the reliability of the stability analysis results, as shown in Table 3.
Reliability comparison results of bridge pile foundation stability analysis
It can be seen from the experimental results in Table 3 that, compared with the analysis methods of Reference [5] system and Reference [6] system, the stability analysis results obtained by the system in this paper are closer to the set stability data, so the reliability of the results obtained by the design analysis method is higher.
Conclusion
The monitoring deformation displacement curve based on the Internet centralized remote real-time long-span bridge health monitoring system technology shows a stable fluctuation state. The cumulative shape variable fluctuates in the range of The four monitoring indicators of vibration amplitude, frequency, wind speed and wind pressure of the designed monitoring system have no significant difference with the monitoring error of the set monitoring accuracy performance parameter standard data, which shows that the designed monitoring system has good accuracy. The monitoring timeliness under static wind, dynamic wind and natural wind environment is similar, which has good timeliness. The stability analysis results obtained by the system in this paper are closer to the set stability data, that is, when the River Scouring speed is 10, 20 and 30 cm/s, the stability levels are no unstable damage, slight unstable damage and moderate unstable damage respectively. The method proposed by the research is consistent with this, so the reliability of the results obtained by the design analysis method is higher.
The research on the health monitoring system for long-span bridges is not enough, and a more reliable health assessment standard for long-span bridges is developed. How to determine the impact of damage on structural life for an assessment and establish an approximate value between structural damage index and structural life can be further studied. In addition, how to optimize the sensor layout in long-span bridge health monitoring to make it play a more effective role is also a key point in bridge health. The next work is about the calculation of the displacement of the whole bridge. The spline curve is used to explain. The finite element method is proposed in the structural analysis. The displacement of the whole bridge is calculated according to the displacement of the monitoring points, which is divided into two parts: static load displacement and dynamic load displacement. On this basis, the strain and stress of the bridge are further calculated. In order to better analyze the structure of the bridge, the best way is to increase the GPS measuring points. However, considering the cost, the method of one machine with multiple antennas can be considered to increase the measuring points. The following work can be developed from dynamic demonstration to structural simulation analysis. The constitutive relationship and physical properties of materials are added to the solid modeling. Effective numerical methods are used to simulate the actual long-span bridge, which can more truly reflect the deformation of the bridge and carry out effective health monitoring.
Footnotes
Fundings
The research is supported by: 2020 Industry-University-Research Project (City-level industry-University-Research Project): Three-dimensional BIM Management System for Bridge Inspection Information (Fund Number: x2tjB8200430); The Fundamental Research Funds for the Central Universities in 2019 (Natural Science): Bridge Inspection Information Three-dimensional Management System (Fund Number: x2tjD2192960).