
Abstract
In order to improve the signal processing effect and efficiency of Coriolis mass flowmeter, a signal processing system of Coriolis mass flowmeter based on time-varying signal model is designed. Based on the analysis of the structure and working principle of Coriolis mass flowmeter, the environmental factors affecting the performance of Coriolis mass flowmeter are discussed. Based on the above analysis, the signal processing environment is designed, including serial signal processing environment and dual core parallel signal processing environment. Then the effective signal processing of Coriolis mass flowmeter is completed from three aspects: initial processing, phase calculation and frequency tracking. The experimental results show that after the time-varying signal model is applied, a complete signal frame can be collected in less than 50 ms in the pre-processing process, and the signal processing frame can be completed in less than 80 ms in the post-processing process. This shows that the signal processing time of the system is short, and the phase difference detection accuracy of the signal processing system based on the time-varying signal model is high, which is of great value to further improve the application effect of Coriolis mass flowmeter.
Introduction
In the process of industrialization, as an important part of industrial measurement, flow measurement plays an important role in improving production efficiency. Among various flow measurement technologies, Coriolis mass flowmeter (CMF) has been widely concerned and applied because of its high accuracy and stability. Coriolis mass flowmeter is a device that directly measures the mass flow rate by using the principle of Coriolis force, which is proportional to the mass flow rate of the fluid flowing in the vibrating pipe. It is composed of flow detection components and converters [1]. At the same time, it can realize the direct measurement of mass flow and is widely used in petrochemical, pharmaceutical, food and other industries with the characteristics of high accuracy, multi-media and multi-process parameters [2]. In addition, Coriolis mass flowmeter has no flow blocking elements and moving parts in the fluid channel, so it has good reliability and long service life, and can measure the flow of high viscosity fluid and high-pressure gas [3]. The appearance of Coriolis mass flowmeter has brought profound changes to fluid measurement technology and is regarded by experts as the mainstream flowmeter in the 21st century [4].
Coriolis mass flowmeter obtains the mass flow of fluid by measuring the phase difference (or time difference) between the output signals of two flow sensors. However, Coriolis mass flowmeter is vulnerable to various noises. At the same time, due to the nonlinear relationship of the sensor itself, there will be various harmonics in its output signal, which will also affect the measurement accuracy of the flowmeter [5]. Therefore, the signal processing part of Coriolis flowmeter is required to have good noise suppression ability. In addition, since the natural frequency of the vibrating tube of the Coriolis flowmeter changes with the change of the fluid density, the signal processing part is required to have a good frequency tracking ability.
Related work
Coriolis flow measurement technology has a long history of development. Wang and Baker [6] made a comprehensive review of the development process in the past two decades, and gave a proper description of the innovative achievements made at present and the future development direction. Henry et al. [7] described a new achievement of Coriolis mass flowmeter transmitter, which has improved measurement accuracy and performance compared with commercial transmitters. Ming and Henry [8] analyzed the new complex signal processing methods of complex band-pass filter (CBF), complex notch filter (CNF) and their combination (CBF-CNF), and the research shows that the new technology has the advantages of short delay, high noise suppression, high accuracy and low computational cost. In order to accurately extract flow information from sensor output signals containing noise, a series of flowmeter signal processing systems have been designed by relevant scholars. A parallel signal processing system of Coriolis mass flowmeter based on dual-core DSP is designed by Hu et al. [9]. In this study, aiming at the problem that single processor can not guarantee the real-time requirement of CMF signal processing, a parallel CMF signal processing method based on dual-core DSP with multi-task distribution is designed. After the pre-processing of data acquisition and digital filtering, the post-processing of frequency detection and phase difference detection is completed, which are distributed in parallel in dual-core DSP. The two processes are synchronized through an intercore interrupt. However, the signal processing calculation of this method is difficult, and the signal processing accuracy needs to be improved. A multi-channel cross-correlation detection system based on ultrasonic Doppler flow signals is designed by Shi et al. [10]. Aiming at the problem that the liquid ultrasonic Doppler flow signal is weak and messy and difficult to measure at low flow rate, a processing system using multiple receiving channels to collect data and carry out multiple cross-correlation operation is proposed, which can filter out noise interference and extract useful signals without changing the characteristics of useful signals. Firstly, the frequency range of the current signal is measured by using FFT spectrum analysis method, and then the data is collected at the same time in multiple channels at appropriate time intervals. Finally, the signal to noise ratio of the signal is improved by using multiple cross-correlation method to achieve the purpose of weak signal extraction. But the signal processing takes a long time.
Hu et al. [11] conducted in-depth analysis on the fluid solid coupling effect of Coriolis mass flowmeter. Through simulation and experimental research, they simulated and verified the double U-shaped tubular flowmeter to obtain the fluid solid coupling dynamics information and dynamic balance data of the flowmeter, so as to put forward new methods for the design of Coriolis mass flowmeter to improve the design and manufacturing efficiency. However, this method has high analysis difficulty and requirements. Shen et al. [12] proposed the phase difference measurement method of Coriolis mass flowmeter based on the correlation theory, combined with adaptive notch filtering to estimate the signal frequency, determine the sampling signal period, expand the non integer period, calculate and process the extended signal using Hilbert transform, obtain the correlation function between the transformed signal and the extended signal, and finally obtain the phase difference of the signal. But the processing accuracy of this study is not high. Chen et al. [13] introduced the extended Kalman filter algorithm into the phase difference measurement of Coriolis mass flowmeter. First, the signal was preprocessed, and the Mallat algorithm was used to filter out the interference factors in the signal. Then, the extended Kalman filter algorithm was used to detect and analyze the signal frequency and phase difference, so as to improve the anti-interference of the phase difference measurement of the flowmeter. However, the signal processing method of this flowmeter has low computational efficiency, and can not realize the calculation at a high speed while ensuring the accuracy. In order to further expand the signal processing method of flowmeter, the signal processing research of various flowmeters is studied and analyzed. Li et al. [14] applied the peak bit eigenvalue sequence to the signal processing of the ultrasonic gas flowmeter, and proposed that based on the mathematical model of the ultrasonic signal, the matching analysis of the peak ratio eigenvalue and the peak number of the signal should be realized according to the corresponding relationship between the two, so as to reduce the flow calculation error caused by the ultrasonic transmission time. Zhao et al. [15] proposed a signal processing method of ultrasonic flowmeter based on the combination of numerical simulation and measurement. Aiming at the problem that the calculation of ultrasonic flowmeter is difficult, the wave propagation is simulated based on the vibration speed of the transducer, and the estimated force and electric pressure signal on the surface of the transducer are combined to obtain the receiver propagation function and realize the prediction of the received acoustic signal.
Through the analysis of relevant studies, it is known that the signal processing methods proposed by some scholars have greatly improved the traditional methods, but there are still shortcomings such as time-consuming, complex and weak anti-interference. Therefore, in order to further improve the detection effect of Coriolis mass flowmeter, a new signal processing system of Coriolis mass flowmeter based on time-varying signal model is researched and designed. The system completes effective signal processing from three aspects: initial processing, phase calculation and frequency tracking.
Coriolis mass flowmeter model
Structure analysis of Coriolis mass flowmeter
The Coriolis mass flowmeter structure is shown in Fig. 1. The measuring tubes of the flow meter are two parallel U-shaped tubes. The driver that drives the U-shaped tubes perpendicular to the pipe is composed of excitation coils and permanent magnets. Two detectors located in the two straight pipe ends of the U-shaped tube are used to monitor the vibration of the driver and detect the displacement of the pipe end, and detect the vibration time difference between the two vibration tubes so as to give the mass flow through the sensor through the converter.
In the mass flowmeter, the detection tube vibrates with the natural frequency of the system under the excitation of the drive coil. The vibration frequency of the vibration system is inversely proportional to the square root of the fluid density in the tube, so the fluid density can be measured by measuring the vibration frequency. Adding a thermal resistance to the sensor of the mass flowmeter can effectively compensate the rigidity change of the measuring tube caused by temperature changes [16].
Coriolis mass flowmeter structure diagram.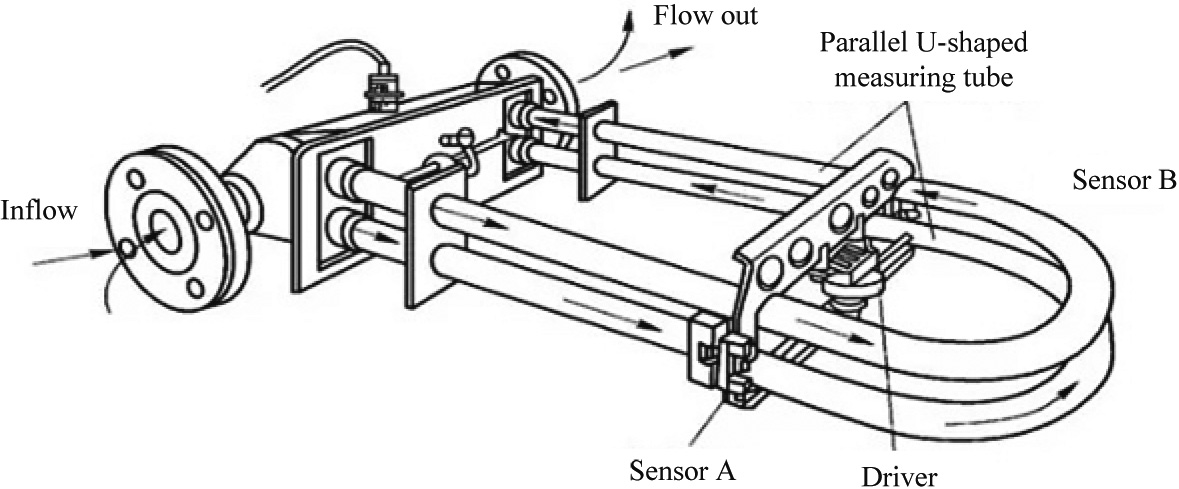
Diagram of Coriolis force action.
When a tube rotates around the origin, a particle is allowed to flow outward through the tube from the origin, that is, the linear velocity of the particle increases gradually from zero, and the particle is endowed with energy. The resulting reaction force
Connect the outer ends of two identical tubes rotating about the same axis in the same phase with the same tube, as shown in Fig. 2b. The connection pipe is parallel to the axis when no fluid flows through the pipe. When fluid flows through the pipe, due to Coriolis force, phase difference occurs between the two rotating pipes (particle outflow side is ahead of inflow side), and the connecting pipe is no longer parallel to the axis. Coriolis flowmeter is made by using this principle [18]. Coriolis flowmeters usually use vibration instead of rotary motion because rotary motion is not suitable for practical applications. The thin wall measuring tube fixed at both ends is stimulated by tube resonance or near resonance at the center. Thus, if the measuring segment is regarded as two segments separated from the center, the two segments are equivalent to rotating back and forth around the fixed points at each end. When the fluid flows from one end to the other, Coriolis force is generated, which distorts the two halves before and after the midpoint of the measuring tube in opposite directions, resulting in phase difference [19, 20]. By measuring the amount of twist-twist angle, or the time difference between the two tubes passing through the central plane, the mass flow rate can be known. Coriolis force is calculated as shown in Eq. (1).
where
Coriolis mass flowmeter is a direct mass flow meter made by using the Coriolis force principle that is proportional to mass flow when fluid moves in a straight line while in a rotating system [21]. Two u-tube (it may be a root) under the action of the drive coil, at a certain frequency vibrations, is current flow from U tube body, its flow direction and the vertical vibration direction, under the action of Coriolis force, torsion Angle
where
CMF has many characteristics, for example, its sensor design is unique, and there is no insertion, sealing and bearing structure, so it does not need too much maintenance and has good integrity [23]. In terms of installation, it does not need rectification and instrument protection, so the installation is simple and easy to operate. At the same time, CMF can obtain volume flow, temperature, density, etc., which is multifunctional and has high stability in the face of various environments. In the measurement process, solid particles have little impact on the CMF measurement accuracy and can maintain high accuracy in many measurement environments [24]. But at the same time, it has some disadvantages, such as zero instability and sensitivity to vibration. In addition, the performance of CMF is also vulnerable to process temperature, pressure, electromagnetic radio frequency interference, flow pulsation effect, etc. [25].
In terms of structure, when testing the mass flow of fluid, the Coriolis force generated by fluid particles is often very small, so the accuracy of its measurement process will be affected to a certain extent. Therefore, increasing the measurement system induced by Coriolis force, or increasing the induction strength of the measurement system under the action of Coriolis force, can make the measurement system produce accurate available signal identification [26]. Therefore, it is an effective means to improve the strength of Coriolis force in the pipeline of the test system. The method is to improve the elasticity of the pipeline of the test system. The deformation of the test system pipe can be increased by reducing the stiffness of the system pipe, selecting a material with excellent elasticity, and accurately determining the oscillation frequency of the test system [27]. According to experience, the more obvious the Coriolis force on the tube, the greater the elasticity of the system, and the thinner and longer the wall of the measuring tube. Based on this theory, it can be seen that this method not only increases the deformation and signal-to-noise ratio of the pipeline in the test system, but also reduces the interference of external signals.
Signal processing system design
Processing environment design
CMF serial signal processing method
Typical CMF signal processing tasks can be divided into two types: pre-processing tasks (data acquisition and digital filtering calculation) and post-processing tasks (frequency detection and phase difference detection) [28]. Sample-based tasks are performed repeatedly according to the sampling frequency. When the number of sampling points reaches the data frame length, the frame-based task is executed once. In a data frame cycle, the pre-processing and post-processing tasks are mutually exclusive. At the beginning of the data frame cycle, the system performs the pre-processing task and blocks the post-processing task. When the number of sampling points reaches the data frame length, the system performs the post-processing task and blocks the pre-processing task.
During the time of preprocessing, the analog signal output by CMF cannot be collected. Therefore, the CMF serial signal processing method has obvious disadvantages of low signal utilization rate and poor real-time performance of the system.
CMF parallel signal processing method
To solve the above problems, CMF signal processing tasks are reorganized and run in parallel in distributed processor. The preprocessing process in the main processor performs the preprocessing tasks repeatedly according to the sampling frequency, that is, data acquisition and digital filtering calculation tasks. When the number of sampling points reaches the data frame length, the preprocessor sends an event notification to the postprocessor [29].
When the post-processing process running in the processor receives the event notification from the pre-processing process, it can start post-processing tasks such as frequency detection and phase difference detection for this data frame. It should be pointed out that the time slice of the last pretreatment task in the pretreatment process requires additional work such as sending event notification and outputting phase difference detection results, so the time slice is slightly longer than other pretreatment tasks, as shown in Fig. 3.
CMF parallel signal processing sequence diagram.
In addition, it can be seen from the processing time sequence that the post-processing process lags one data frame cycle behind the pre-processing process. Since the frame period of CMF signal processing data is usually very short (typical value is about 40 ms), it can be considered that the processing results output by the post-processing process are real-time [30].
CMF parallel signal processing software is developed based on TMS320F28379D MCU. The MCU integrates two 32-bit DSP cores (CPU01 and CPU02), two independent floating point coprocessors (CLA), two six-channel Dmas, intercore communication module (IPC) and 128 KB shared memory. The pre-processing process and the post-processing process are distributed and run in parallel in the dual-core DSP.
(A) Pre-processing processes
The preprocessing process completes data acquisition and digital filtering calculation tasks at equal time intervals based on timer interruption. In each timer interrupt handler:
Enable two ADCs to sample two CHANNELS of CMF analog signals respectively, and transmit the sampling data to CLA1; After CLA1 completes the digital filtering calculation, the filtering calculation result is written into the circular cache. When the last position of the circular cache is written into the calculation result of digital filtering, the data collection of this data frame is completed, and the preprocessing process needs to complete the following additional work within the time slice of the last preprocessing task:
Start two DMA channels, which transfer the data frame to the working memory of the post-processing process; Reset the circular cache pointer, ready to start writing new data frames; Write the phase difference detection result in dual-core DSP shared memory into the DAC register; Send event notification to the backprocessing process through intercore interrupt to inform it to carry out frequency detection and phase difference detection tasks based on this data frame.
(B) Post-processing processes
The post-processing process is in the state of waiting for event notification after initialization. When it receives an event notification from the preprocessor, it does the following in sequence:
Frequency detection of this data frame based on adaptive Notch filtering algorithm (ANF frequency detection algorithm); Phase difference detection of this data frame based on discrete time Fourier Transform algorithm (DTFT phase difference detection algorithm) or three-parameter sine fitting algorithm (SWF3 phase difference detection algorithm); Write the phase difference detection results into dual-core DSP shared memory; Enter the state of waiting for the event notification of the preprocessor again.
Design of time-varying signal model
According to the working principle of Coriolis flowmeter, the output signal of sensor is standard sinusoidal signal under ideal condition. However, in practical applications, the frequency and phase of the signal are not constant due to the influence of the fluid characteristics such as velocity, density, fluid pulsation and flow field. Therefore, the frequency, phase and so on with time changes in the signal.
This is called a time-varying signal. By observing the actual working process of Koch mass flow sensor, it is found that:
a) When the flow is relatively stable, the phase of the two signals will change slowly and slightly with time. Such change is random and irregular, but the range of change generally does not exceed 1% of the given phase. In small flow measurement, e.g. 1 kg/min.
The phase difference corresponding to the flow of is about 0.020. At this time, the phase fluctuation does not exceed 0.00020, and the range of variation is very small. However, such fluctuation can not be ignored in order to improve the measurement accuracy of small flow.
b) When the fluid density is determined, the frequency of the sensor signal will also change, but the range of change is much smaller than the phase, the maximum is not more than 1/10,000 of the flow tube vibration frequency. At the same time, the signal frequency reflects the density of the fluid, so the algorithm must be suitable for testing different fluids, and also need to track the signal frequency.
These changes are often unpredictable and random. At the same time, due to the presence of sensor measurement noise and environmental noise, the following model is defined to simulate the real Coriolis flowmeter signal:
where
Equation (4) indicates that the phase and frequency of the signal are changing. The value of each moment is the value of the previous moment plus A random number.
The signal processing of Coriolis mass flowmeter is completed by using the time-varying signal model designed by the above process.
(A) Fundamental principles analysis
Coriolis flowmeter sensor output signal model is:
where
In the working process of Coriolis flowmeter, its natural frequency will change with the change of fluid density.
where
Assuming that
Similarly, the same processing for the second signal can be obtained:
By observing Eqs (9) and (10), it can be obtained:
where
(B) Handle initialization
The system designed in this study firstly initializes the digital processor, detects the vibration frequency of the measuring tube, and makes preparations for the measurement of mass flow. In order to ensure the measurement accuracy and reduce the measurement time, vibration frequency detection is divided into two processes: rough measurement and fine measurement. In order to further improve the accuracy of the algorithm and overcome the long convergence process, this paper chooses to organically combine the adaptive lattice notch filter and the DTFT phase difference calculation method of negative frequency correction. The adaptive lattice notch filter tracks the change of signal frequency, calculates the fundamental frequency of flow tube vibration, and eliminates the influence of random and deterministic interference to enhance the signal; Finally, for the enhanced signal after notch filtering, the negative frequency modified DTFT recursive algorithm is used to calculate the real-time phase difference between the two signals, which can greatly shorten the convergence process of phase difference and time difference calculation, track the change of phase in real time, and improve the calculation accuracy.
Sampling with a low frequency resolution, the initial determination of frequency range, Coriolis flowmeter measuring pipe vibration frequency is generally within the range of 75
By DFT calculation of sampling points, the Fourier coefficients and power spectrum of each harmonic can be obtained. By comparing all the power spectrum values, the maximum harmonic number
The results of coarse frequency detection obtained above are only a range, and the maximum error is
In fine detection, the sampling frequency
When the sampling frequency changes, the frequency resolution also changes, so the frequency corresponding to the
(C) Phase difference calculation
When the signal frequency is detected, the phase difference can be measured. Taking the sampling frequency as 64 times of the signal frequency, sampling 64 points, the corresponding harmonic number of the signal is 1 (that is, fundamental wave). The output signals of two magnetoelectric sensors are cross-sampled, and the Fourier coefficient (
Therefore, only the Fourier coefficient of the two signals at the fundamental wave can be obtained to obtain the phase difference of the two signals. However, since it is cross-sampling, the lag time between the two signals should be taken into account, that is, a constant should be removed to obtain the correct result.
(D) Frequency tracking
The frequency error plays a decisive role in the measurement of mass flow, and the vibration frequency of measuring tube is closely related to the fluid density, and the vibration frequency of measuring tube will change with the change of fluid density. If the sampling frequency is not changed, it will inevitably lead to non-integral sampling, which will bring large error. Therefore, in the process of mass flow measurement, it is necessary to track the frequency change in time.
Firstly, the zero-crossing sampling method is used to realize frequency tracking. The so-called zero-crossing sampling, that is, when the signal is zero start time, after a sampling cycle to start sampling. Suppose that the signal frequency is
After a period of time, the signal frequency changes
According to the above process, when the signal frequency changes but the sampling frequency remains unchanged, the signal frequency change will be reflected in the form of the initial phase. Therefore, when zero-crossing sampling is carried out on a signal channel, the phase determined by the Fourier coefficient
Assume that there is no error at this frequency, and 64 points are sampled at the frequency of
Assume that the frequency change is
For this signal, 64 points are sampled at the frequency of
Thus, it can be obtained:
Since the phase difference calculated by DFT is the average phase shift in the whole sampling time, then the Fourier coefficient under this situation is set as
Therefore, the frequency changes in two adjacent signal cycles can be tracked more accurately.
To sum up, the effective signal processing of Coriolis mass flowmeter is completed from three aspects of initialization processing, phase calculation and frequency tracking. Innovation of research: For complex flow measurement, the time-varying signal model is improved according to the characteristics of the signal, and the SDTFT method with adaptive lattice notch and negative frequency correction is proposed to track the changing frequency and phase difference. Whether it is a slowly changing fluctuation signal or a sudden change signal, this method can be well applied by adjusting parameters. It not only has a fast reaction speed but also has a high calculation accuracy. It has a good application prospect for complex flow measurement.
Experimental background and environment
In order to verify the practical application effect of Coriolis mass flowmeter signal processing system based on time-varying signal model, the following experiments are designed.
The model CNG050 corioli mass flow sensor is used in the experiment. When the full tube vibrates, the fundamental frequency of the sensor signal is 188.64 Hz, so the signal frequency is 188.64 Hz in the simulation. The phase difference corresponding to small flow is mainly simulated to verify the real-time performance and accuracy of phase difference detection of the system in this paper.
The experiment is carried out on the MATLAB simulation platform, and the phase difference between two analog sinusoidal signals output by the host is detected by the target computer. In the experiment, the phase difference between the two analog signals output by the host software was set as 0
Simulation experiment results
The system performance can be verified and analyzed by the phase and frequency changes of signals generated by the time-varying model and the time-varying signal waveform. Figure 4 shows the tracking effect of the system when the phase changes and the time-varying signal waveform.
A time-varying signal generated according to a time-varying signal model.
Figure 4a shows the tracking effect of the system when the phase changes within [0.00990, 0.01000]. It can be seen that the system built by the research still has good tracking speed and tracking accuracy when the fluctuation amplitude is 1% of 0.01.
To further highlight in this paper, the application effect of system will be of Reference [9] of Coriolis mass flowmeter based on dual DSP parallel signal processing system, Reference [10] based on ultrasonic doppler flow signals in the multichannel cross-correlation detection system for comparison, for signal processing timeliness and phase difference detection precision index, verify the feasibility of different systems. The signal processing time of different systems is shown in Table 1.
Statistical results of signal processing time of different systems (ms)
By analyzing the results shown in Table 1, it can be seen that after the application of the system in this paper, it takes less than 50 ms for the pre-processing process to collect a complete signal frame, and less than 80 ms for the post-processing process to complete the signal processing of a signal frame. Compared with the two traditional systems, the signal processing time of the system in this paper is less.
The experimental results show that the time of starting DMA, sending event notification and writing the phase difference detection result into DAC register is less than 120
The above experimental results indicate that the post-processing process has enough time to complete all the signal processing tasks of the last signal frame during the time of signal frame acquisition by the pre-processing process, indicating that the signal processing timeliness of the system in this paper is higher.
On this basis, the phase difference detection results of the target machine collected by the host software are counted, and the phase difference detection accuracy results of system of Reference [9] and system of this paper are obtained respectively, as shown in Table 2.
Phase difference detection precision comparison
Time consumption of phase difference detection experiment
Calculation results of phase difference within 1 s of sampling.
After analyzing the results shown in Table 2, the average relative error of the phase difference detection results of the system in Reference [9] is 0.162%, and the average relative error of the system in this paper is 0.098%. It can be seen that the phase difference detection accuracy of system of this paper is better than that of traditional systems, thus highlighting the application advantages of the system in this paper.
In order to verify the validity of the time-varying signal model, the proposed time-varying signal model is simulated and compared with the parallel CMF signal processing method based on multitask distributed dual core DSP. The verification platform consists of a host computer and a target computer. The host computer is a desktop computer equipped with NI PCI-6154 multi-function data acquisition card, and the target computer is a C2000 series development board equipped with TMS320F28379D dual core DSP. The host provides CMF analog signals for the target machine through the analog signal output channel of the data acquisition card, and collects the phase difference detection results of the target machine through the analog signal input channel of the data acquisition card. That is, the host computer realizes the output of CMF analog signals and the acquisition of phase difference detection results. The target computer carries CMF parallel signal processing software to detect the phase difference of two CMF analog signals. The analog signal output channel of the host data acquisition card is connected to the ADC pin of the target computer, and the DAC pin of the target computer is connected to the analog signal input channel of the host data acquisition card. The real-time dynamic results of its phase difference detection are shown in Table 3.
The phase difference calculation results within the sampling time of 1 s are shown in Fig. 5.
It can be seen from Fig. 5 that the time-varying signal model can quickly track the phase difference of the flowmeter signal, and the signal processing time is short. However, the dual core DSP model has the problem that the signal tracking processing accuracy decreases due to the constant change of the signal frequency, which proves the practicability and effectiveness of the time-varying signal model.
Conclusion
Coriolis mass flowmeter is widely used in the field of flow measurement, and its excellent performance makes it have broad prospects for development. The traditional signal processing method of Coriolis mass flowmeter is sensitive to noise. Therefore, in order to improve the signal processing efficiency of Coriolis mass flowmeter, a signal processing system of Coriolis mass flowmeter based on time-varying signal model is researched and designed. This system can complete effective signal processing from three aspects: initial processing, phase calculation and frequency tracking. The simulation results show that the system can effectively track the time-varying signal generated by the time-varying signal model. At the same time, the time required for the system to collect the complete signal frame in the pre-processing process is less than 50 ms, and the time required for the post-processing process to complete the signal processing of the signal frame is less than 80 ms, which is shorter than the signal processing time of the other two traditional systems. And in the system phase difference detection, the detection average relative error of the system designed by the research institute is 0.098%, which is smaller than the detection average relative error of the traditional system (0.162%) in previous study. In addition, in practical application, the time-varying signal model of the system can quickly track the phase difference of the flowmeter signal, and the signal processing time is short, which proves its practicality and effectiveness. However, there is still room for improvement in the research. In the future research, it can be combined with the corresponding algorithm processing technology to further improve the efficiency of signal detection.
Footnotes
Funding
The research is supported by: Scientific Research Project of Beijing Educational Committee (NO.: KM202110858003).